


preview/001-Performance-Evaluations-Meter.JPG preview/002-Customer-Satisfaction-Dashboard.JPG preview/003-Customer-Service-Benchmarking-Dashboard.JPG preview/004-Business-Progress-Growth-Dashboard.JPG preview/005-Satisfaction-Dashboard.JPG preview/006-Satisfaction-Dashboard.JPG preview/007-Satisfaction-Dashboard.JPG preview/008-Satisfaction-Dashboard.JPG preview/009-World-Traffic-Dashboard.JPG preview/010-Sales-Manager-Dashboard.JPG preview/011-Monthly-MRR-Retention-and-Sales-Value-Productivity-Dashboard.JPG preview/012-Monthly-MRR-Retention-and-Sales-Value-Productivity-Dashboard.JPG preview/013-Monthly-Sales-Growth-and-Net-Profit-Margin-Dashboard.JPG preview/014-Financial-Performance-KPI-Dashboard.JPG preview/015-Financial-Performance-KPI-Dashboard.JPG preview/016-Sales-Growth-Ratio-and-Booking-Month-Dashboard.JPG preview/017-Accounting-Gross-Profit-and-Net-Profit-Margin-Dashboard.JPG preview/018-Social-Media-Dashboard.JPG preview/019-Monthly-Social-Media-Dashboard.JPG preview/020-Social-Media-Reporting-Tool-and-Dashboard.JPG preview/021-IT-Project-Management-Dashboard.JPG preview/022-Sales-KPI-Performance-Dashboard.JPG preview/023-Sales-Performance-Dashboard.JPG preview/024-Delivery-KPI-Dashboard.JPG preview/025-Revenue-Debt-to-Equity-and-Net-Profit-Margin-Sales-Dashboard.JPG preview/026-Project-Status-KPI-Dashboard.JPG preview/027-Chief-Marketing-Officer-(CMO)-Dashboard.JPG preview/028-Chief-Marketing-Officer-(CMO)-Dashboard.JPG preview/029-Chief-Marketing-Officer-(CMO)-Dashboard.JPG preview/030-Marketing-KPI-Dashboard.JPG preview/031-Revenue-and-Customer-KPI-Dashboard.JPG preview/032-Financial-Overview-Dashboard.JPG preview/033-Financial-Overview-Dashboard.JPG preview/034-Investor-Relations-Dashboard.JPG preview/035-SAAS-Management-Dashboard.JPG preview/036-Web-Analytics-Dashboard.JPG preview/037-Cash-Management-Dashboard.JPG preview/038-Financial-KPI-Dashboard.JPG preview/039-Chief-Financial-Officer-(CFO)-Dashboard.JPG preview/040-Sales-Cycle-Length-Dashboard.JPG preview/041-Sales-Conversion-Dashboard.JPG preview/042-Sales-Opportunity-Dashboard.JPG preview/043-Human-Resources-Dashboard-Employee-Performance.JPG preview/044-Human-Resources-Dashboard-Recruiting-Dashboard.JPG preview/045-Talent-Management-Dashboard.JPG preview/046-Workforce-Dashboard.JPG preview/047-Customer-Service-Team-Dashboard.JPG preview/048-Customer-Support-KPI-Dashboard.JPG preview/049-Customer-Retention-Dashboard.JPG preview/050-Procurement-KPI-Dashboard.JPG preview/051-Procurement-Quality-Dashboard.JPG preview/052-Supplier-Delivery-Dashboard.JPG preview/053-Procurement-Cost-Dashboard.JPG preview/Data Charts-Data Driven-PowerPoint-Template-001.JPG preview/Data Charts-Data Driven-PowerPoint-Template-002.JPG preview/Data Charts-Data Driven-PowerPoint-Template-003.JPG preview/Data Charts-Data Driven-PowerPoint-Template-004.JPG preview/Data Charts-Data Driven-PowerPoint-Template-005.JPG preview/Data Charts-Data Driven-PowerPoint-Template-006.JPG preview/Data Charts-Data Driven-PowerPoint-Template-007.JPG preview/Data Charts-Data Driven-PowerPoint-Template-008.JPG preview/Data Charts-Data Driven-PowerPoint-Template-009.JPG preview/Data Charts-Data Driven-PowerPoint-Template-010.JPG preview/Data Charts-Data Driven-PowerPoint-Template-011.JPG preview/Data Charts-Data Driven-PowerPoint-Template-012.JPG preview/Data Charts-Data Driven-PowerPoint-Template-013.JPG preview/Data Charts-Data Driven-PowerPoint-Template-014.JPG preview/Data Charts-Data Driven-PowerPoint-Template-015.JPG preview/Data Charts-Data Driven-PowerPoint-Template-016.JPG preview/Data Charts-Data Driven-PowerPoint-Template-017.JPG preview/Data Charts-Data Driven-PowerPoint-Template-018.JPG preview/Data Charts-Data Driven-PowerPoint-Template-019.JPG preview/Data Charts-Data Driven-PowerPoint-Template-020.JPG preview/Data Charts-Data Driven-PowerPoint-Template-021.JPG preview/Data Charts-Data Driven-PowerPoint-Template-022.JPG preview/Data Charts-Data Driven-PowerPoint-Template-023.JPG preview/Data Charts-Data Driven-PowerPoint-Template-024.JPG preview/Data Charts-Data Driven-PowerPoint-Template-025.JPG preview/Data Charts-Data Driven-PowerPoint-Template-026.JPG preview/Data Charts-Data Driven-PowerPoint-Template-027.JPG preview/Data Charts-Data Driven-PowerPoint-Template-028.JPG preview/Data Charts-Data Driven-PowerPoint-Template-029.JPG preview/Data Charts-Data Driven-PowerPoint-Template-030.JPG preview/Data Charts-Data Driven-PowerPoint-Template-031.JPG preview/Data Charts-Data Driven-PowerPoint-Template-032.JPG preview/Data Charts-Data Driven-PowerPoint-Template-033.JPG preview/Data Charts-Data Driven-PowerPoint-Template-034.JPG preview/Data Charts-Data Driven-PowerPoint-Template-035.JPG preview/Data Charts-Data Driven-PowerPoint-Template-036.JPG preview/Data Charts-Data Driven-PowerPoint-Template-037.JPG preview/Data Charts-Data Driven-PowerPoint-Template-038.JPG preview/Data Charts-Data Driven-PowerPoint-Template-039.JPG preview/Data Charts-Data Driven-PowerPoint-Template-040.JPG preview/Data Charts-Data Driven-PowerPoint-Template-041.JPG preview/Data Charts-Data Driven-PowerPoint-Template-042.JPG preview/Data Charts-Data Driven-PowerPoint-Template-043.JPG preview/Data Charts-Data Driven-PowerPoint-Template-044.JPG preview/Data Charts-Data Driven-PowerPoint-Template-045.JPG preview/Data Charts-Data Driven-PowerPoint-Template-046.JPG preview/Data Charts-Data Driven-PowerPoint-Template-047.JPG preview/Data Charts-Data Driven-PowerPoint-Template-048.JPG preview/Data Charts-Data Driven-PowerPoint-Template-049.JPG preview/Data Charts-Data Driven-PowerPoint-Template-050.JPG preview/Data Charts-Data Driven-PowerPoint-Template-051.JPG preview/Data Charts-Data Driven-PowerPoint-Template-052.JPG preview/Data Charts-Data Driven-PowerPoint-Template-053.JPG preview/Data Charts-Data Driven-PowerPoint-Template-054.JPG preview/Data Charts-Data Driven-PowerPoint-Template-055.JPG preview/Data Charts-Data Driven-PowerPoint-Template-056.JPG preview/Data Charts-Data Driven-PowerPoint-Template-057.JPG preview/Data Charts-Data Driven-PowerPoint-Template-058.JPG preview/Data Charts-Data Driven-PowerPoint-Template-059.JPG preview/Data Charts-Data Driven-PowerPoint-Template-060.JPG preview/Data Charts-Data Driven-PowerPoint-Template-061.JPG preview/Data Charts-Data Driven-PowerPoint-Template-062.JPG
-Dashboard.JPG)
-Dashboard.JPG)
-Dashboard.JPG)
-Dashboard.JPG)
Check My Other Presentations Templates
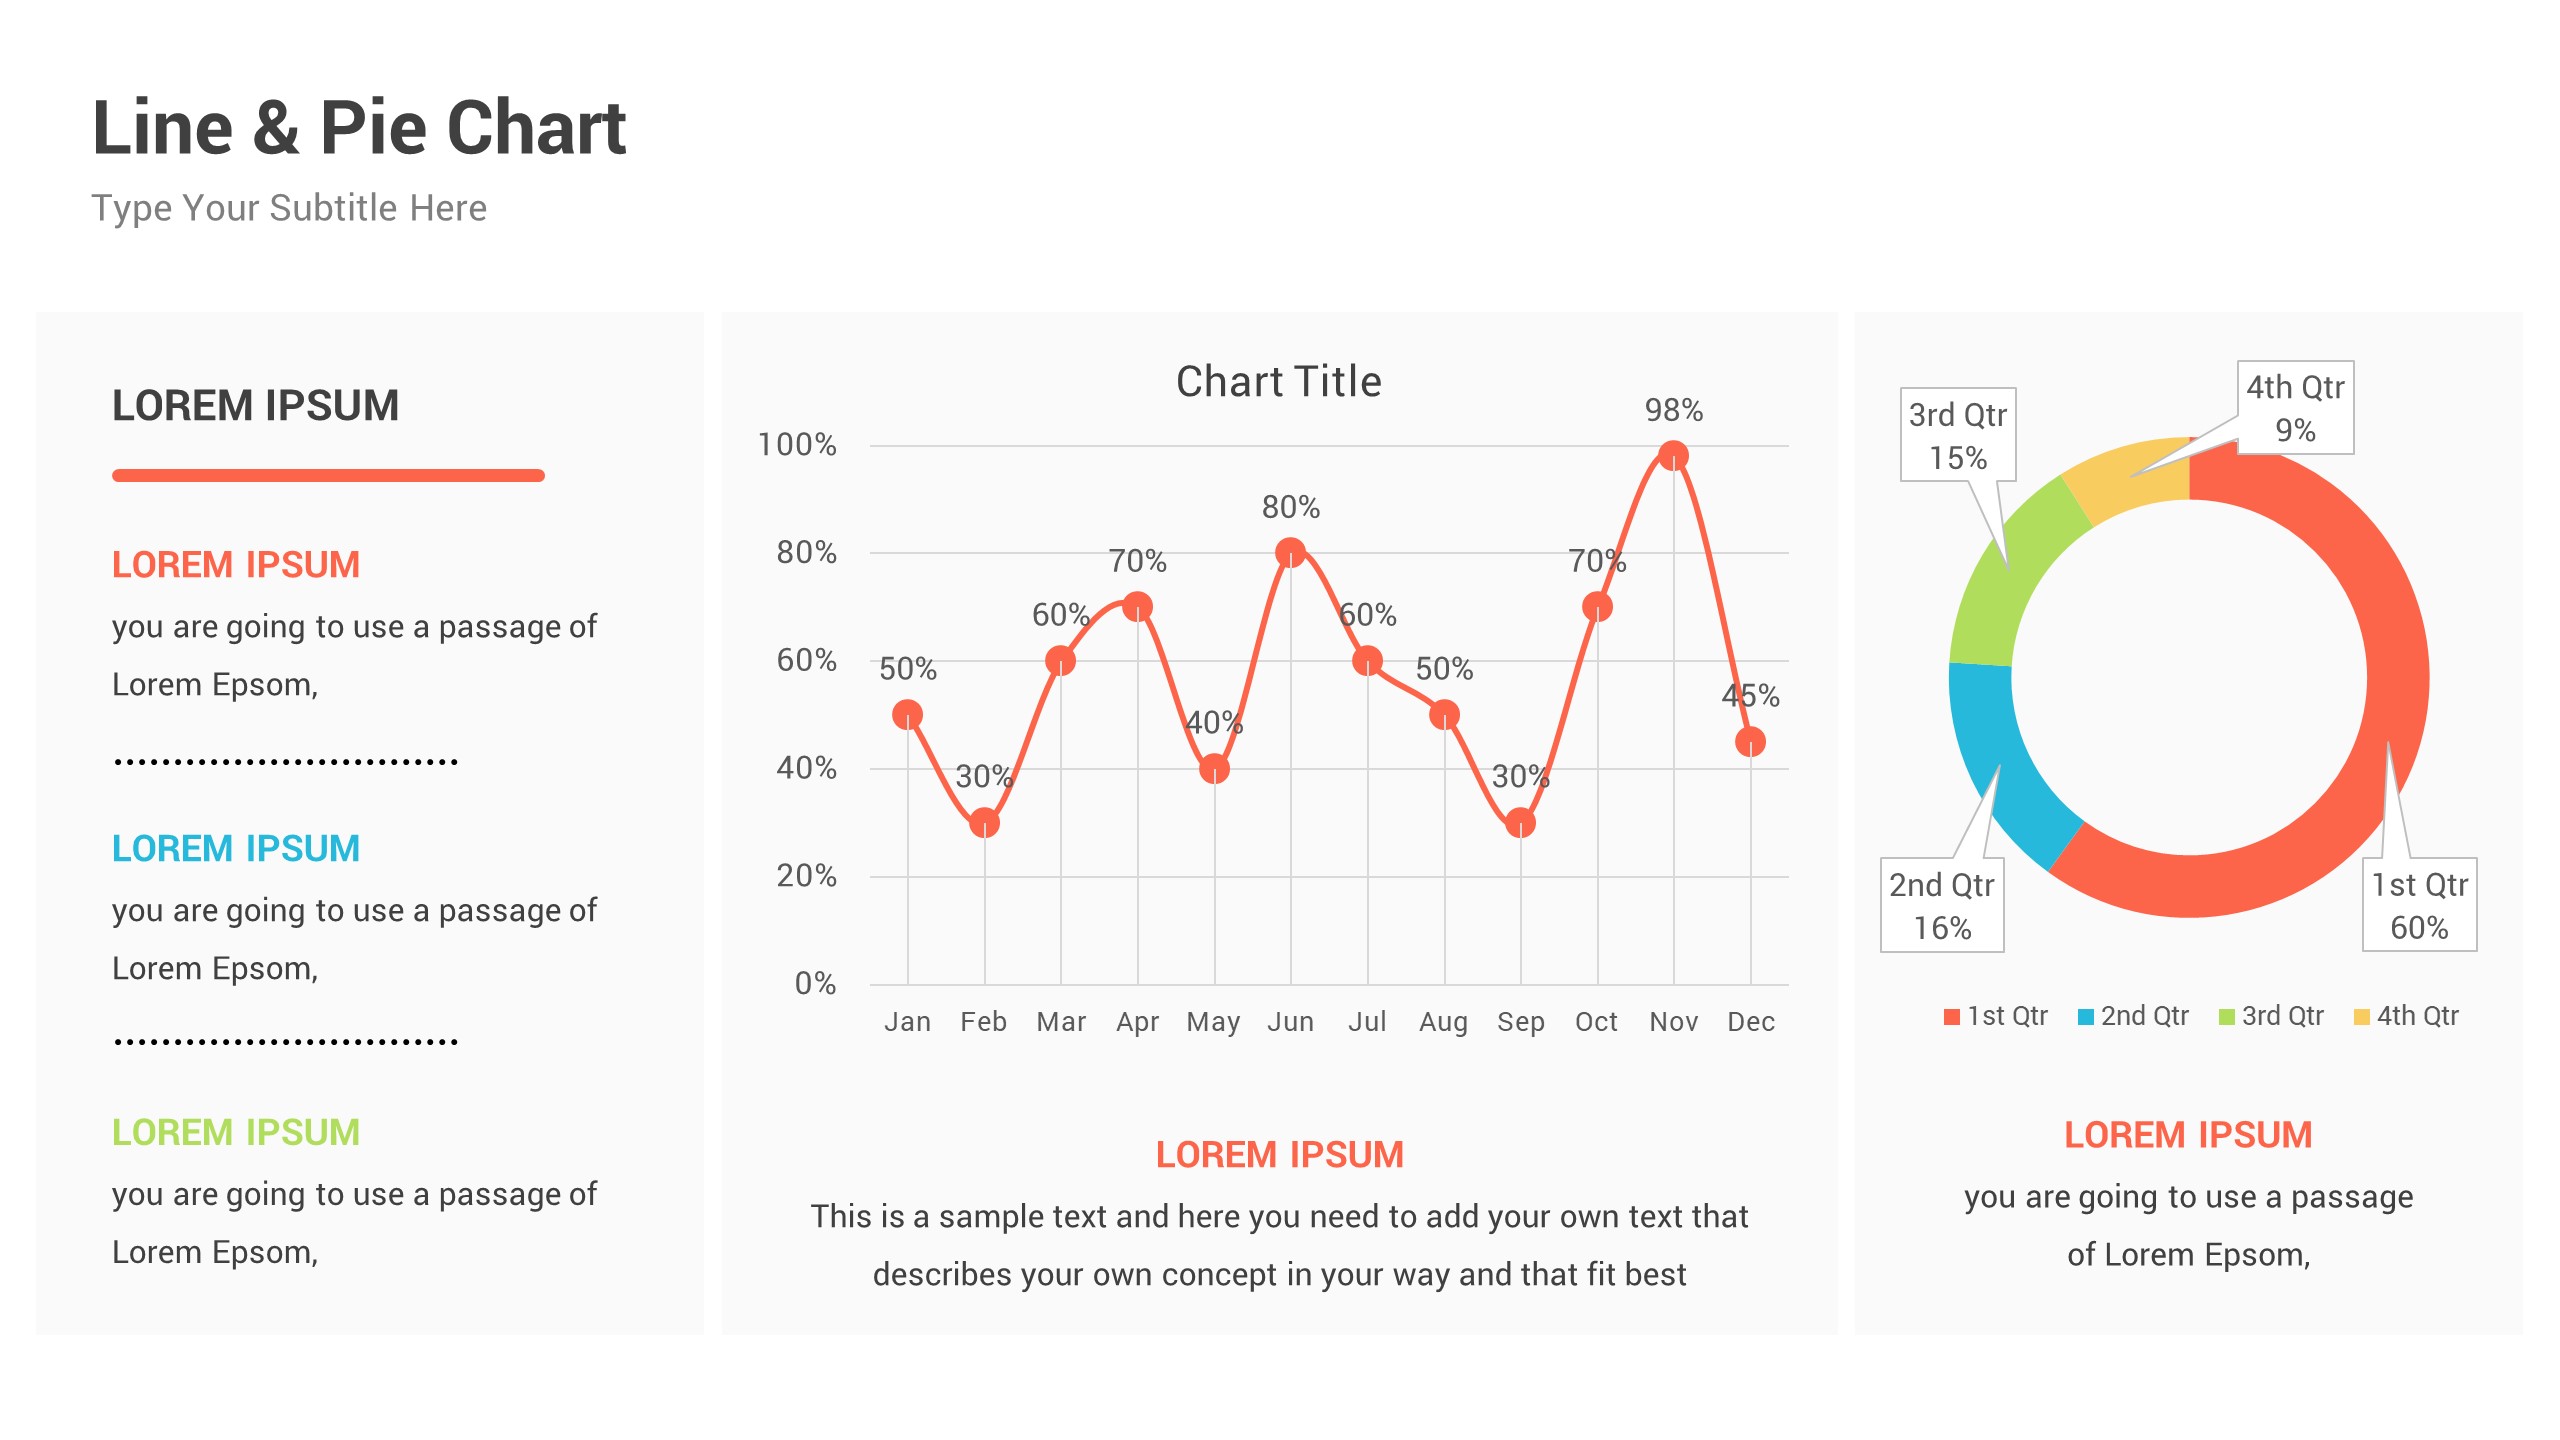
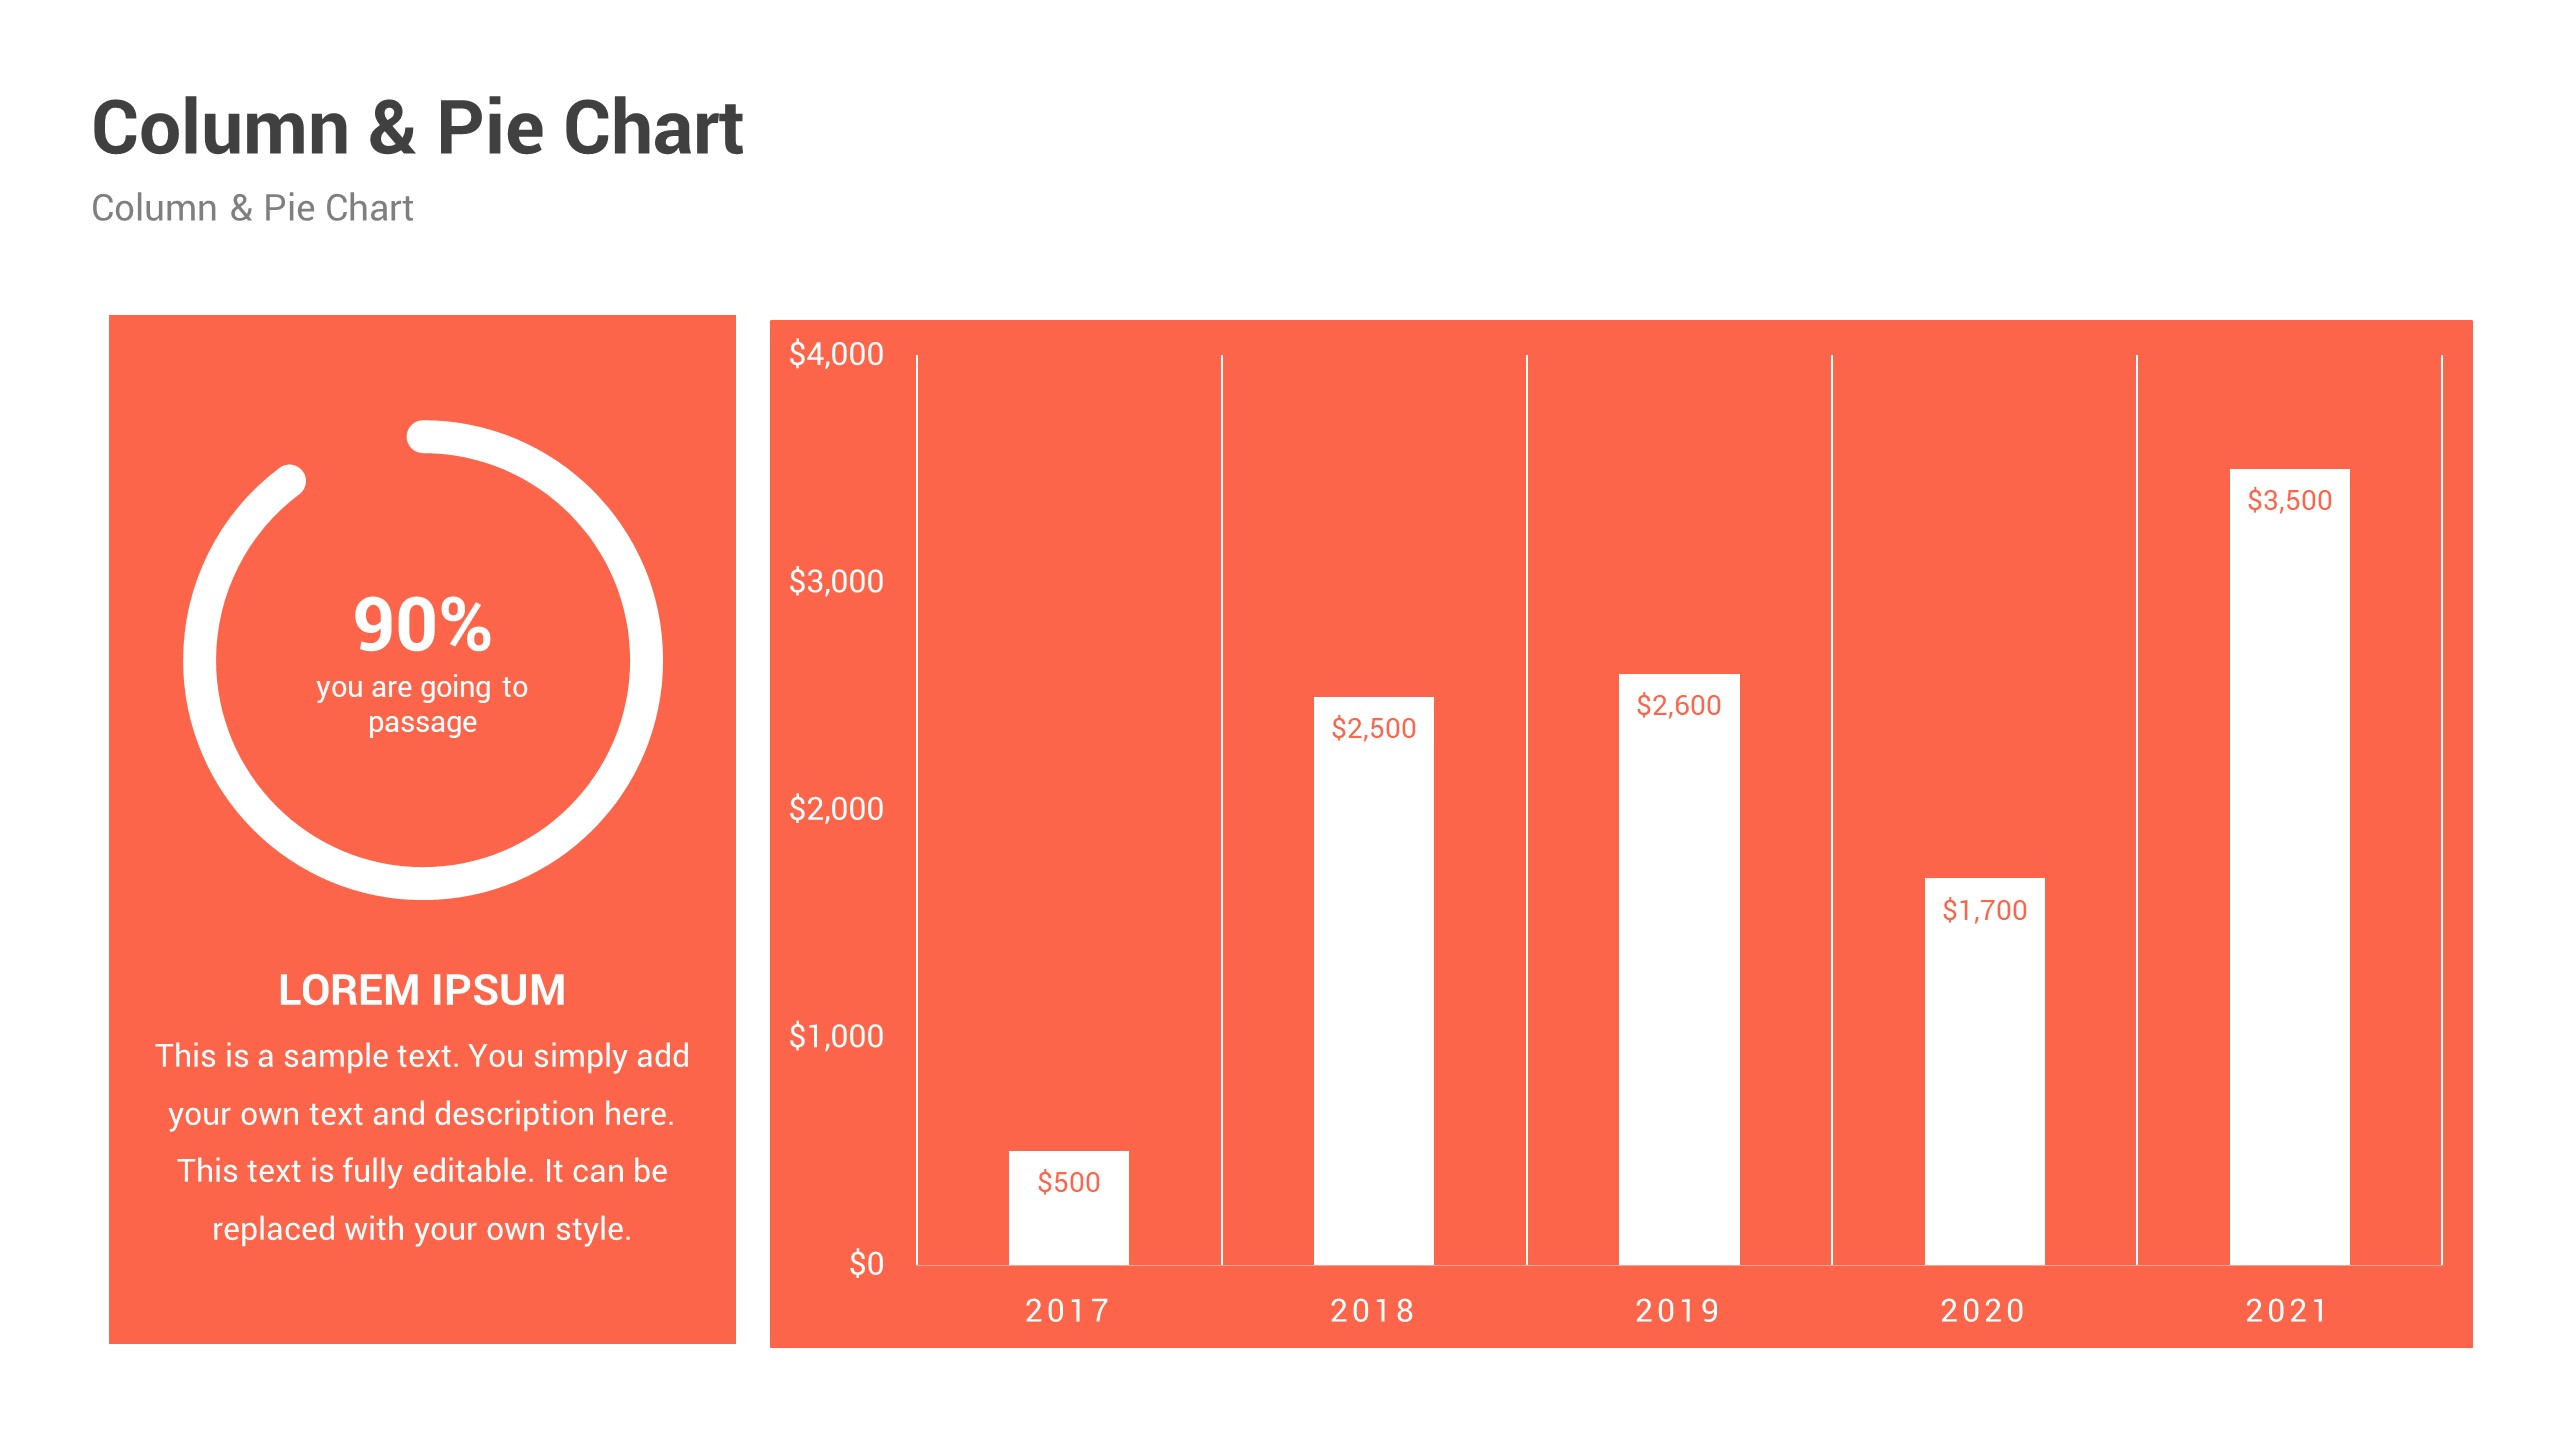
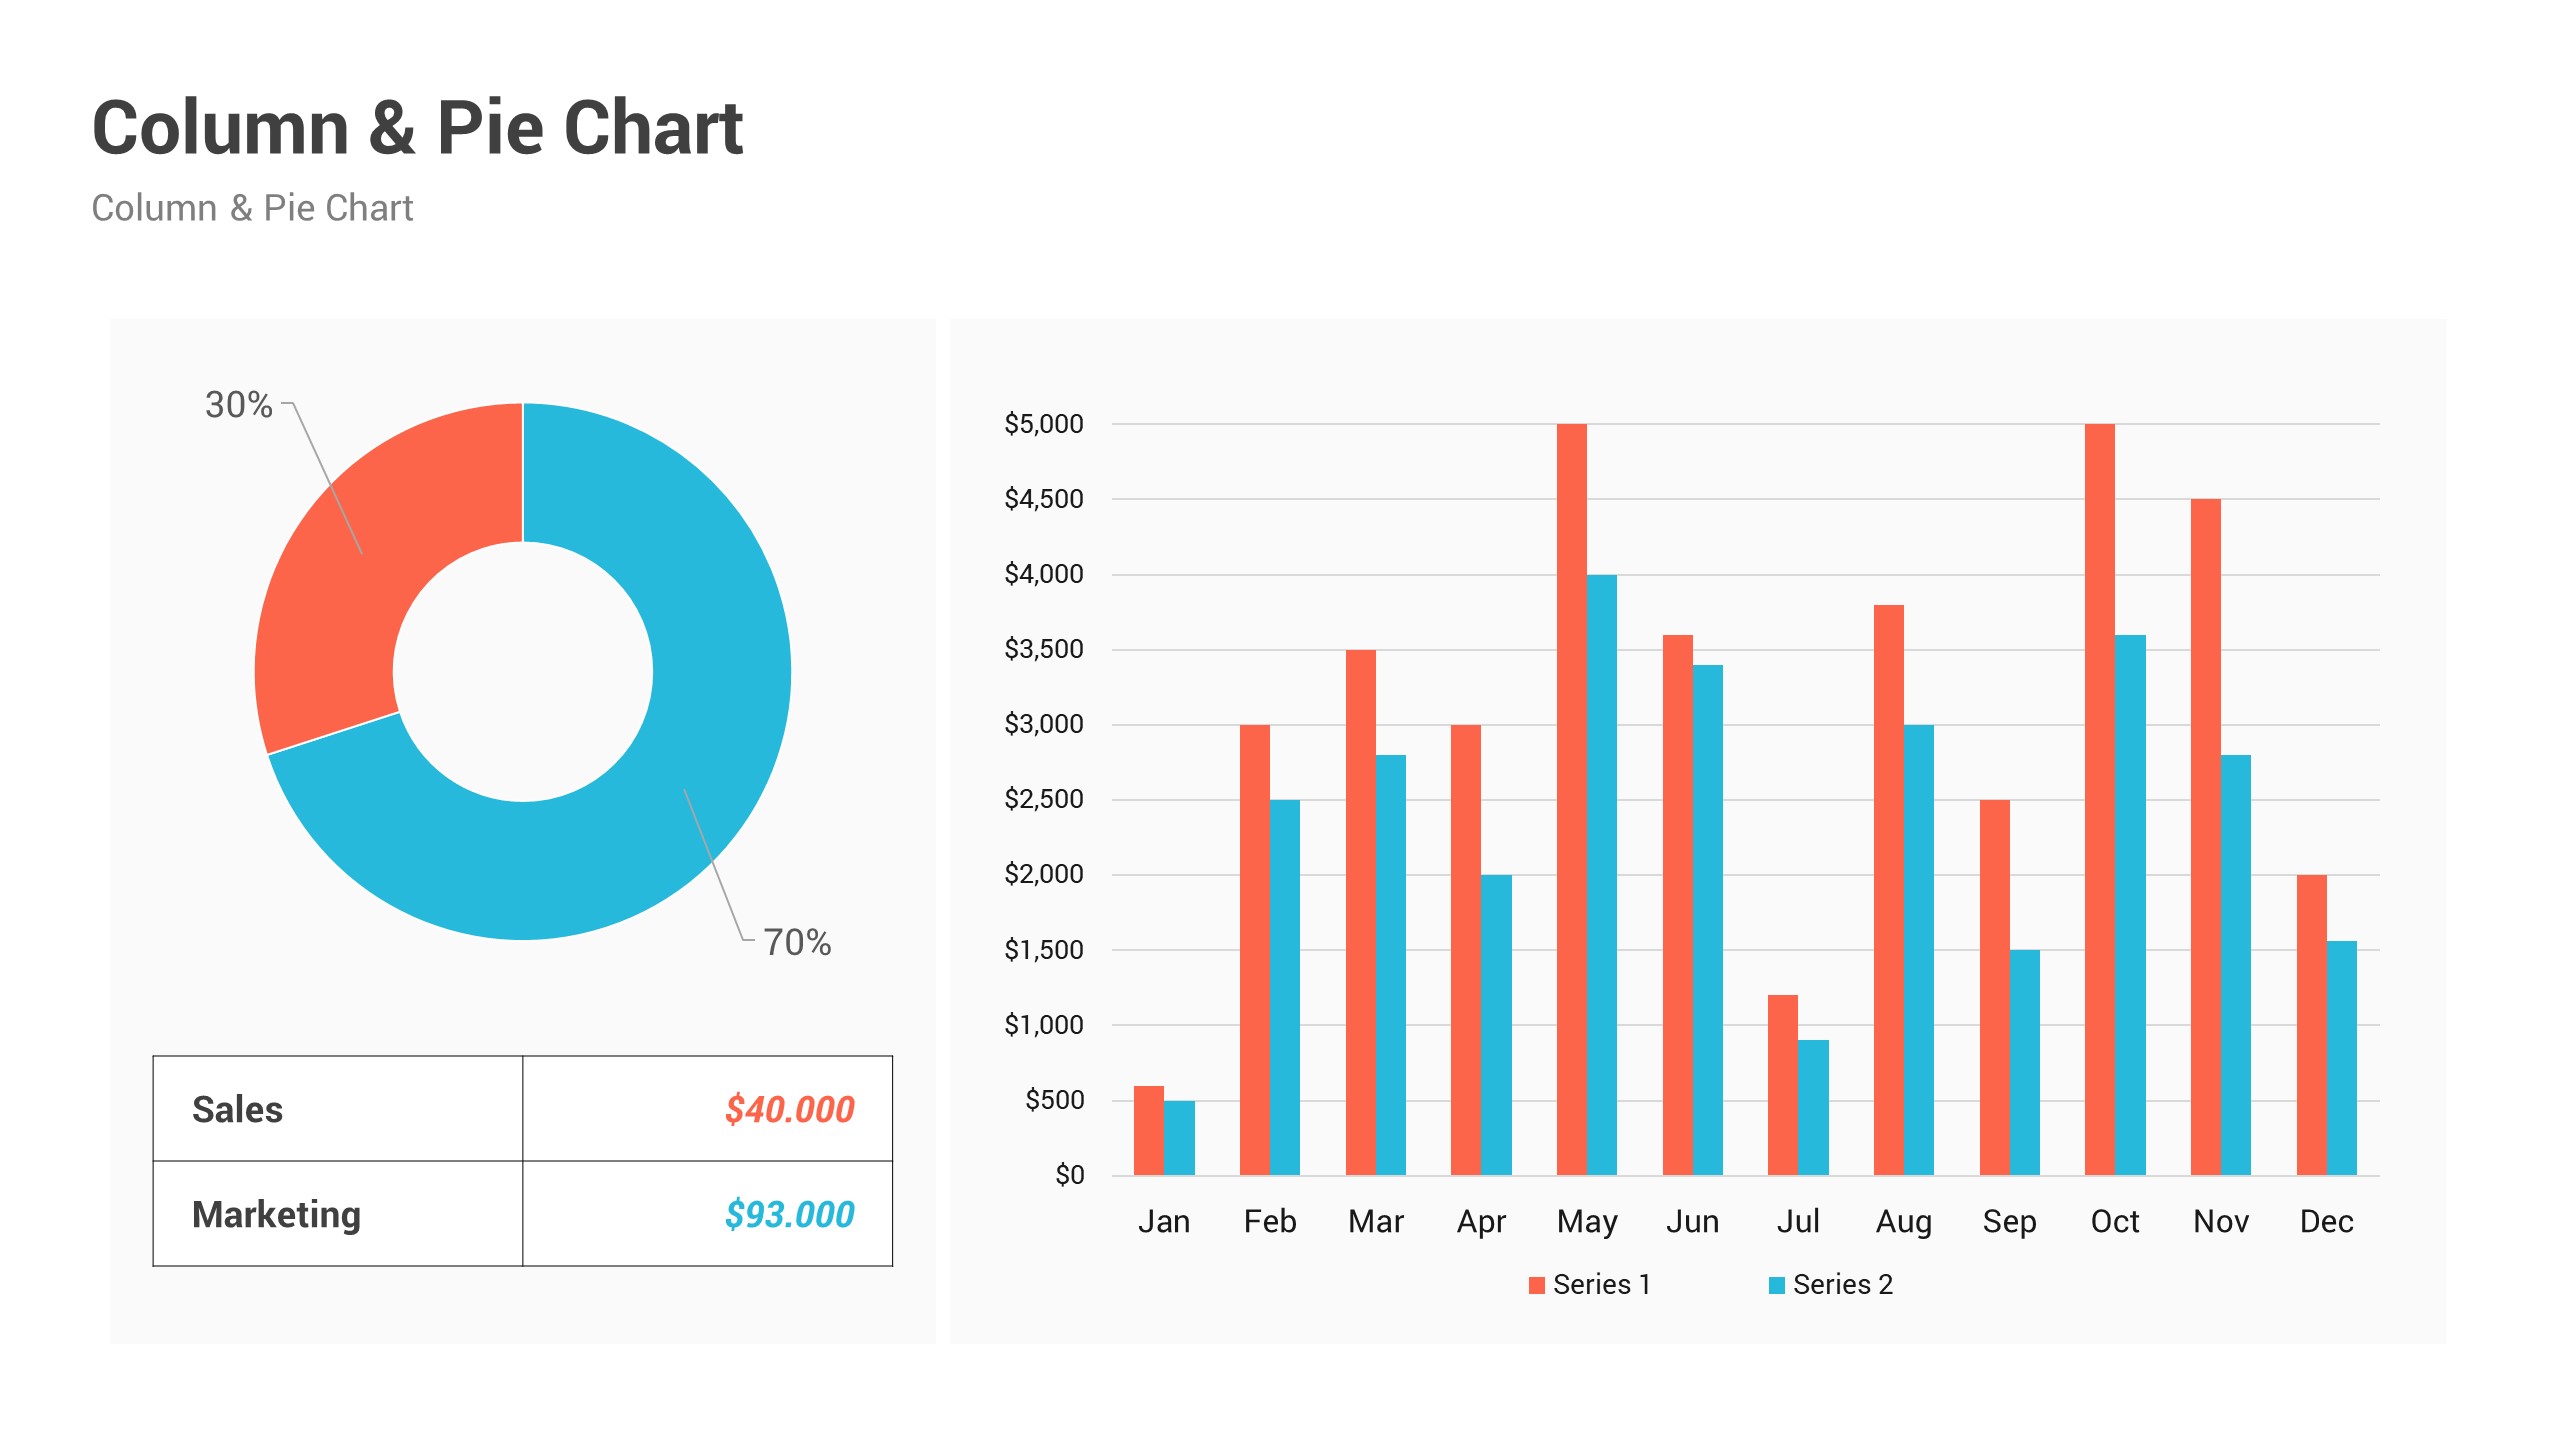
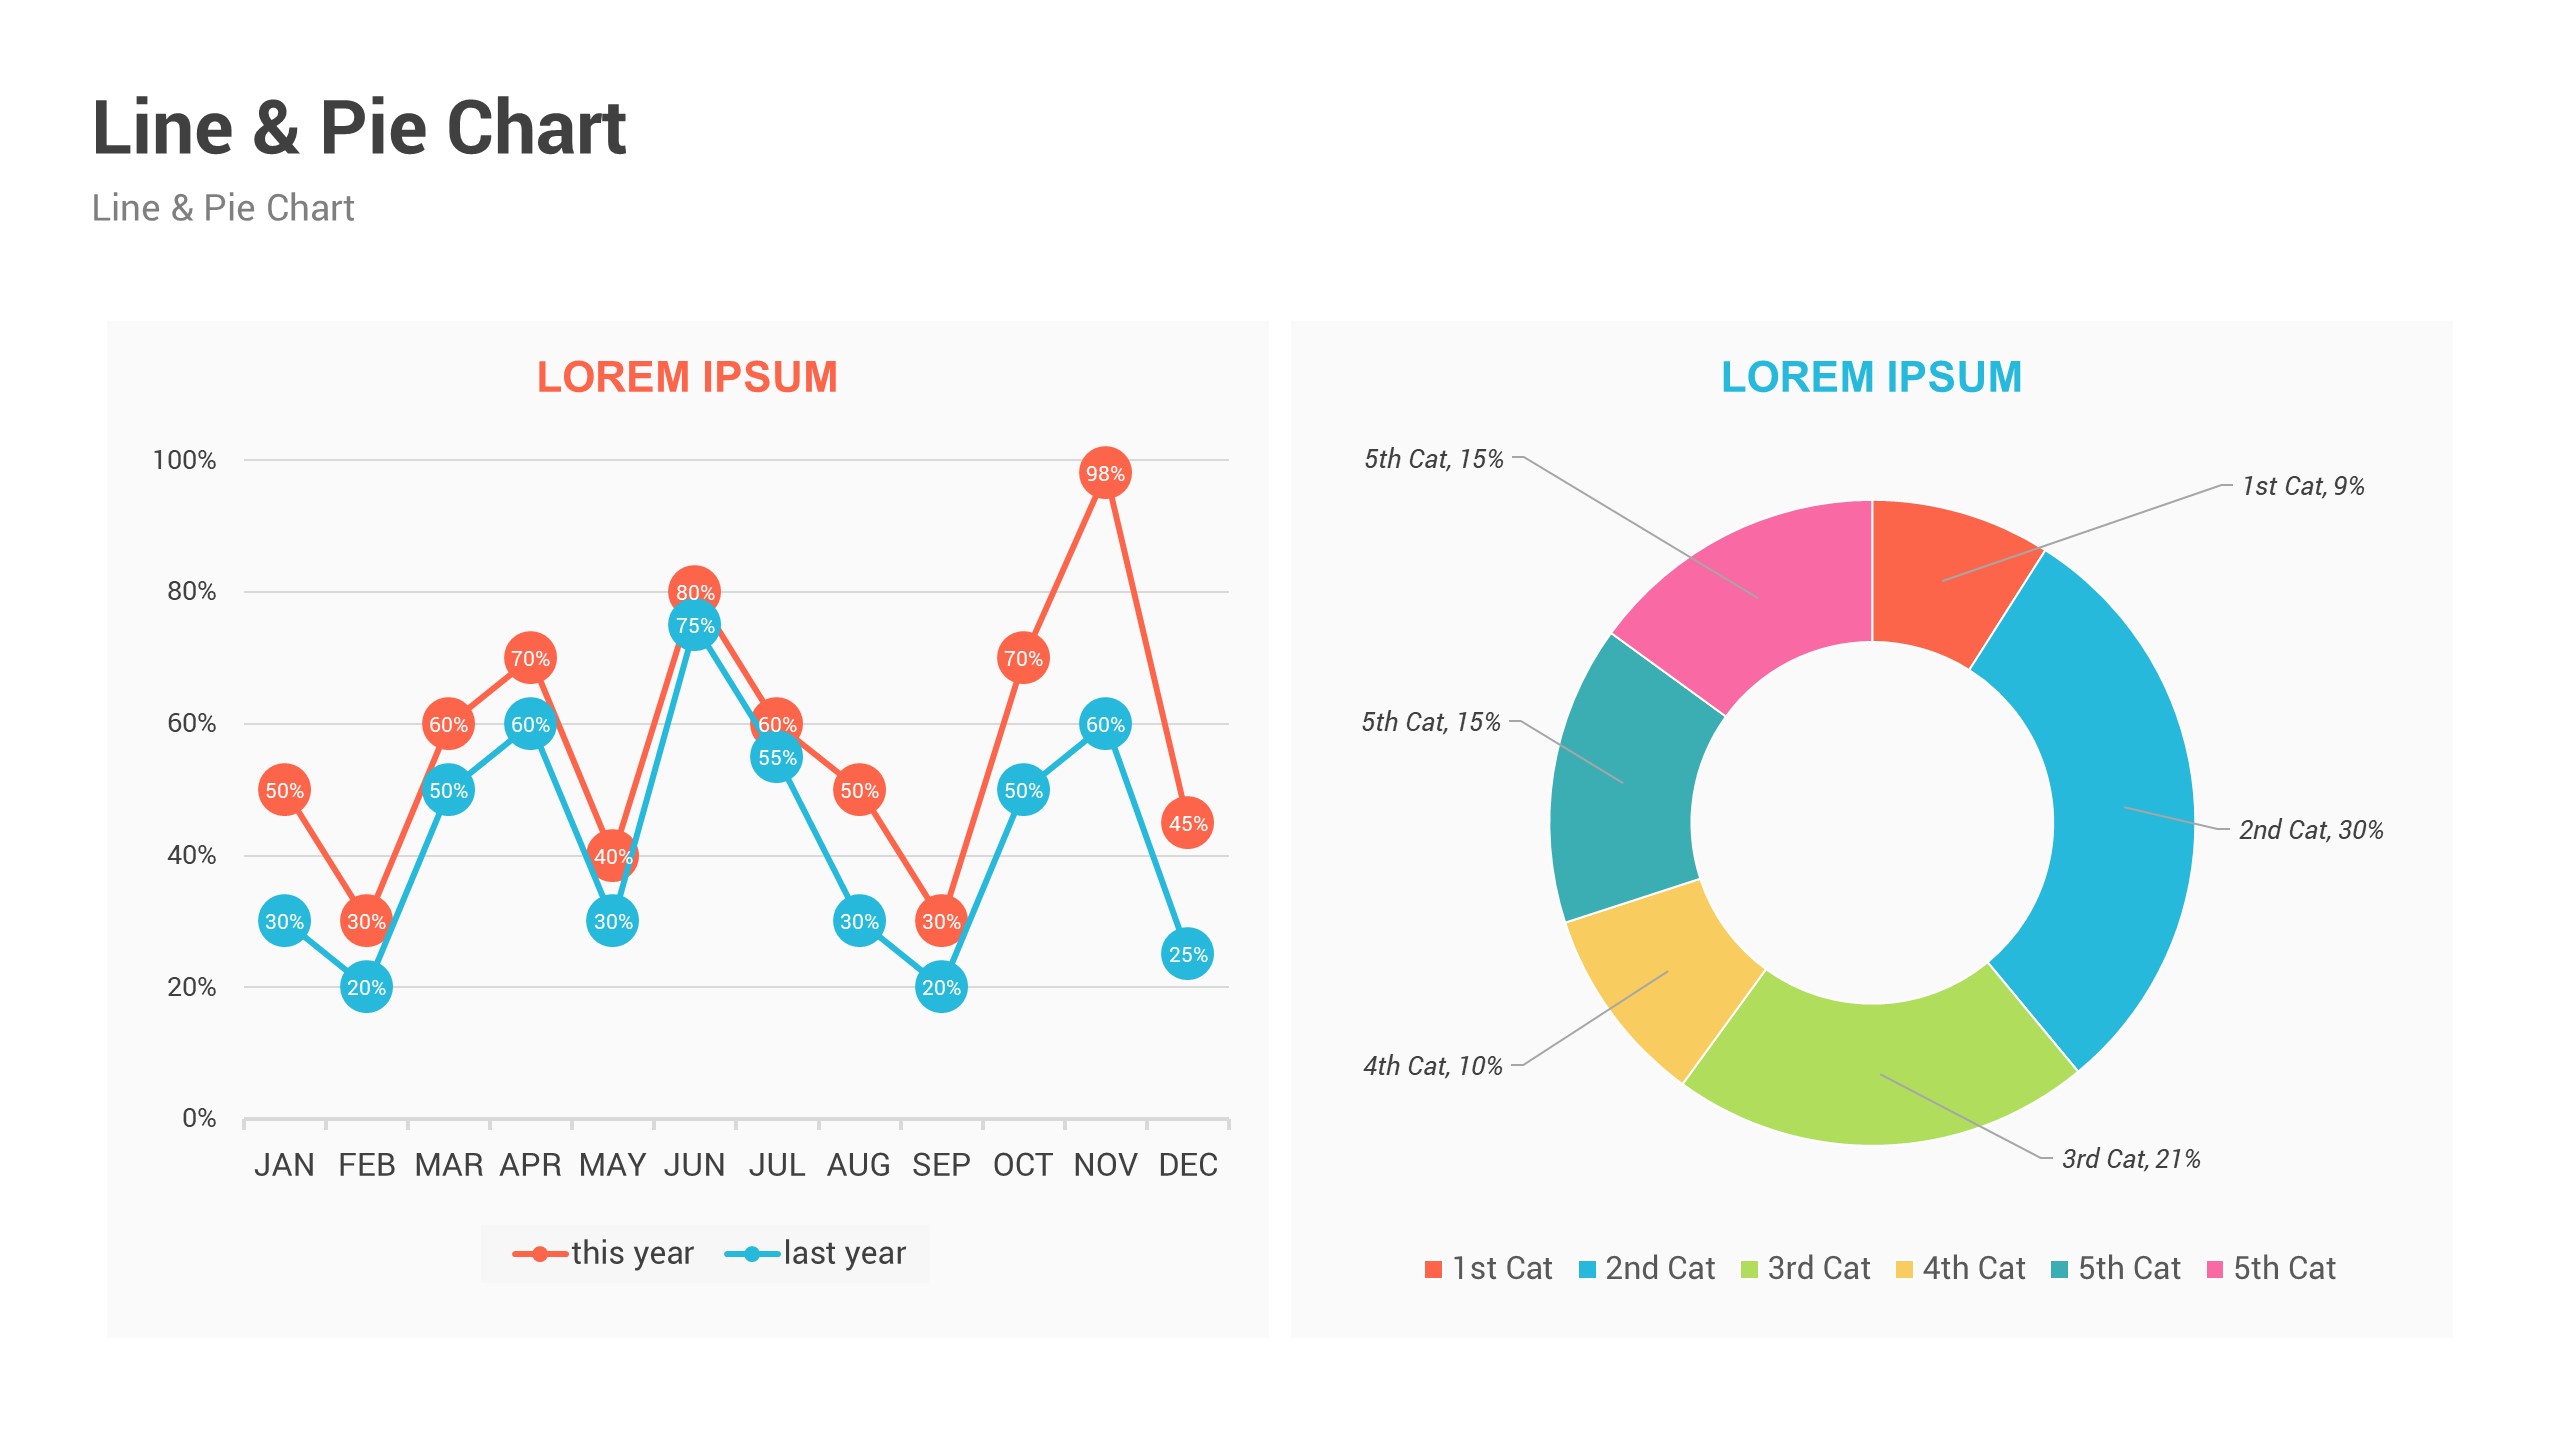
KPI Dashboard and Data Charts PowerPoint Presentation Templates
KPI Dashboard and Data Charts PowerPoint Presentation Bundle Professional Pack provides you a way an easy & elegant ways to report project metrics, KPIs, and the state of a project to share weekly, monthly, quarterly reports across your organization.
This Bundle features all kinds of graphics and vectors that will help you measure and analyze various parameters of KPIs under one roof.
Features:
- 115 Unique Slides as Total
- 53 KPI Dashboard Slides
- 62 Data Charts Slides
- 2 Aspect Ratio (4:3 & 16:9)
- 90 Themes
- Just One Click for change the colors and auto recolored
- Free Fonts and Icons
- Fully and Easy editable content
- 4500+ Multi Icons! Easily change size & color
Font info
- Roboto (Free Font) http://www.fontsquirrel.com/fonts/roboto
Contents
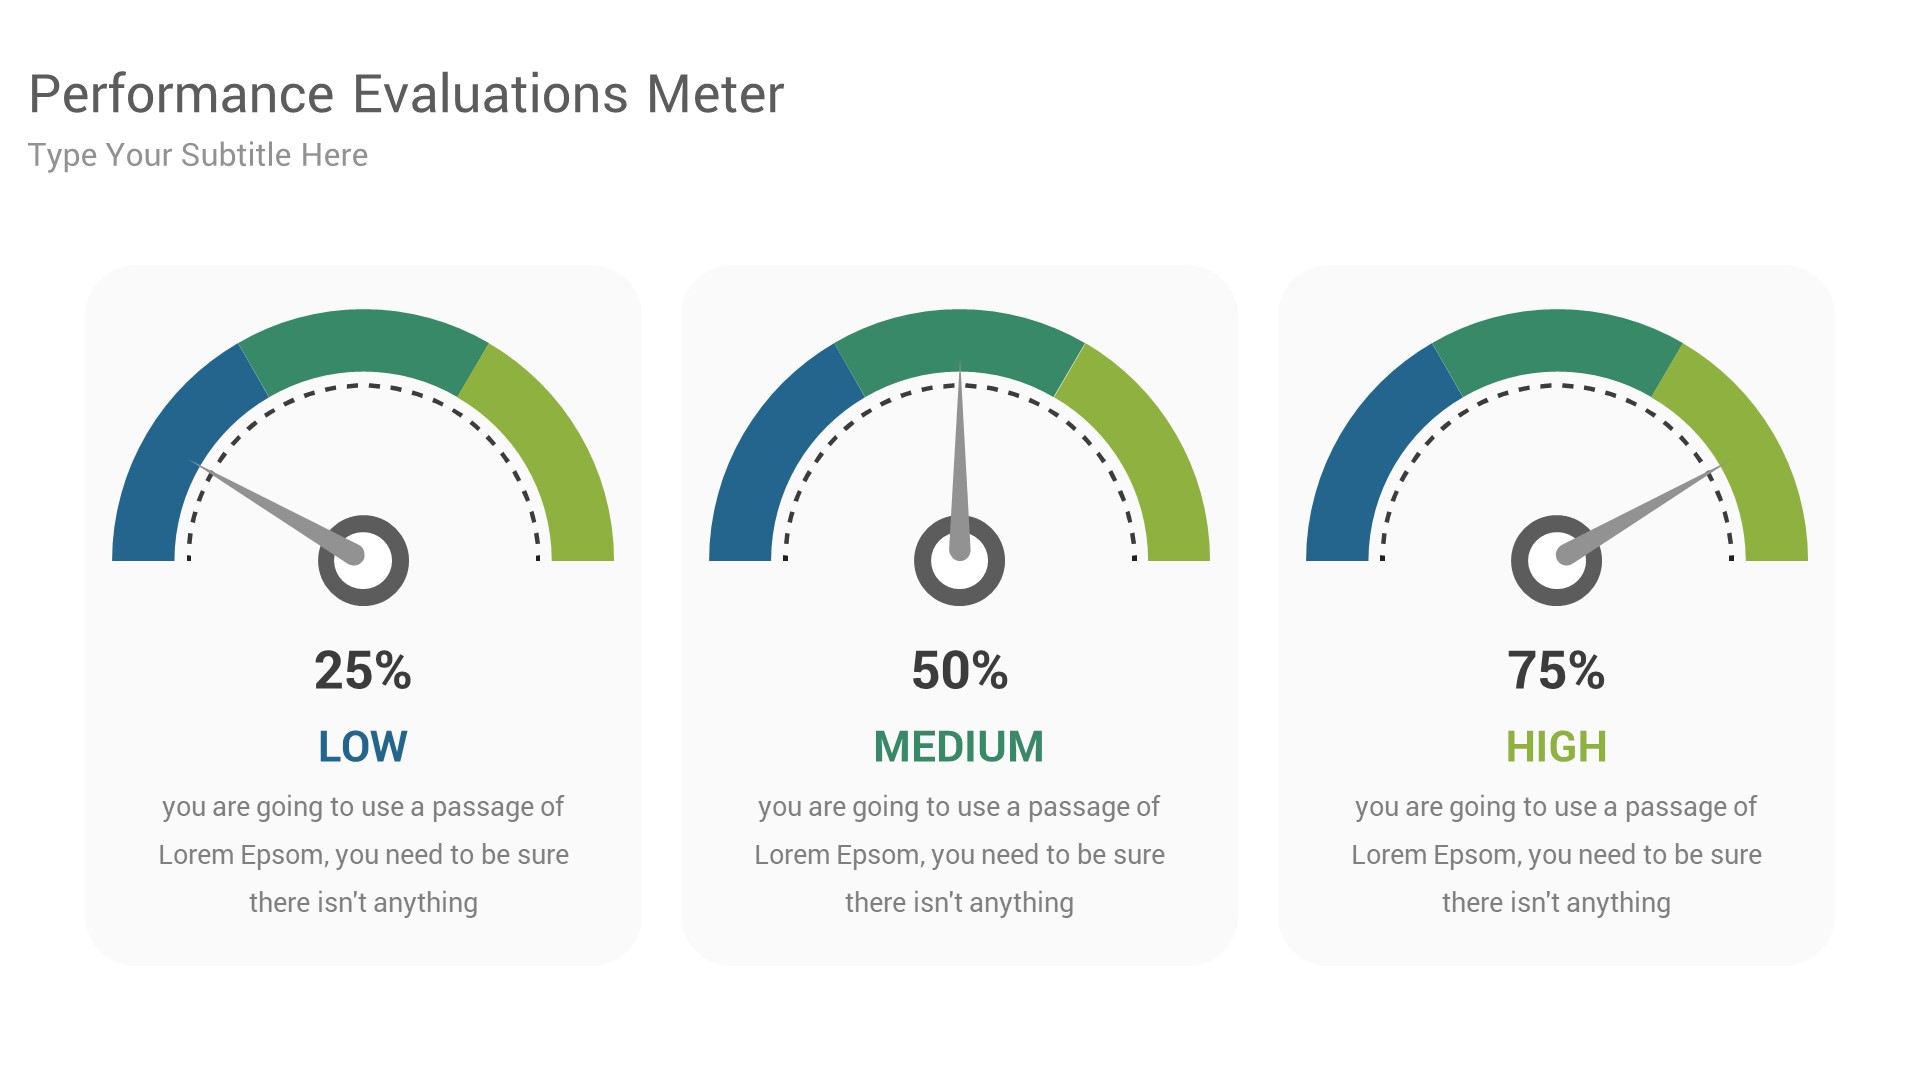
- Performance Evaluations Meter
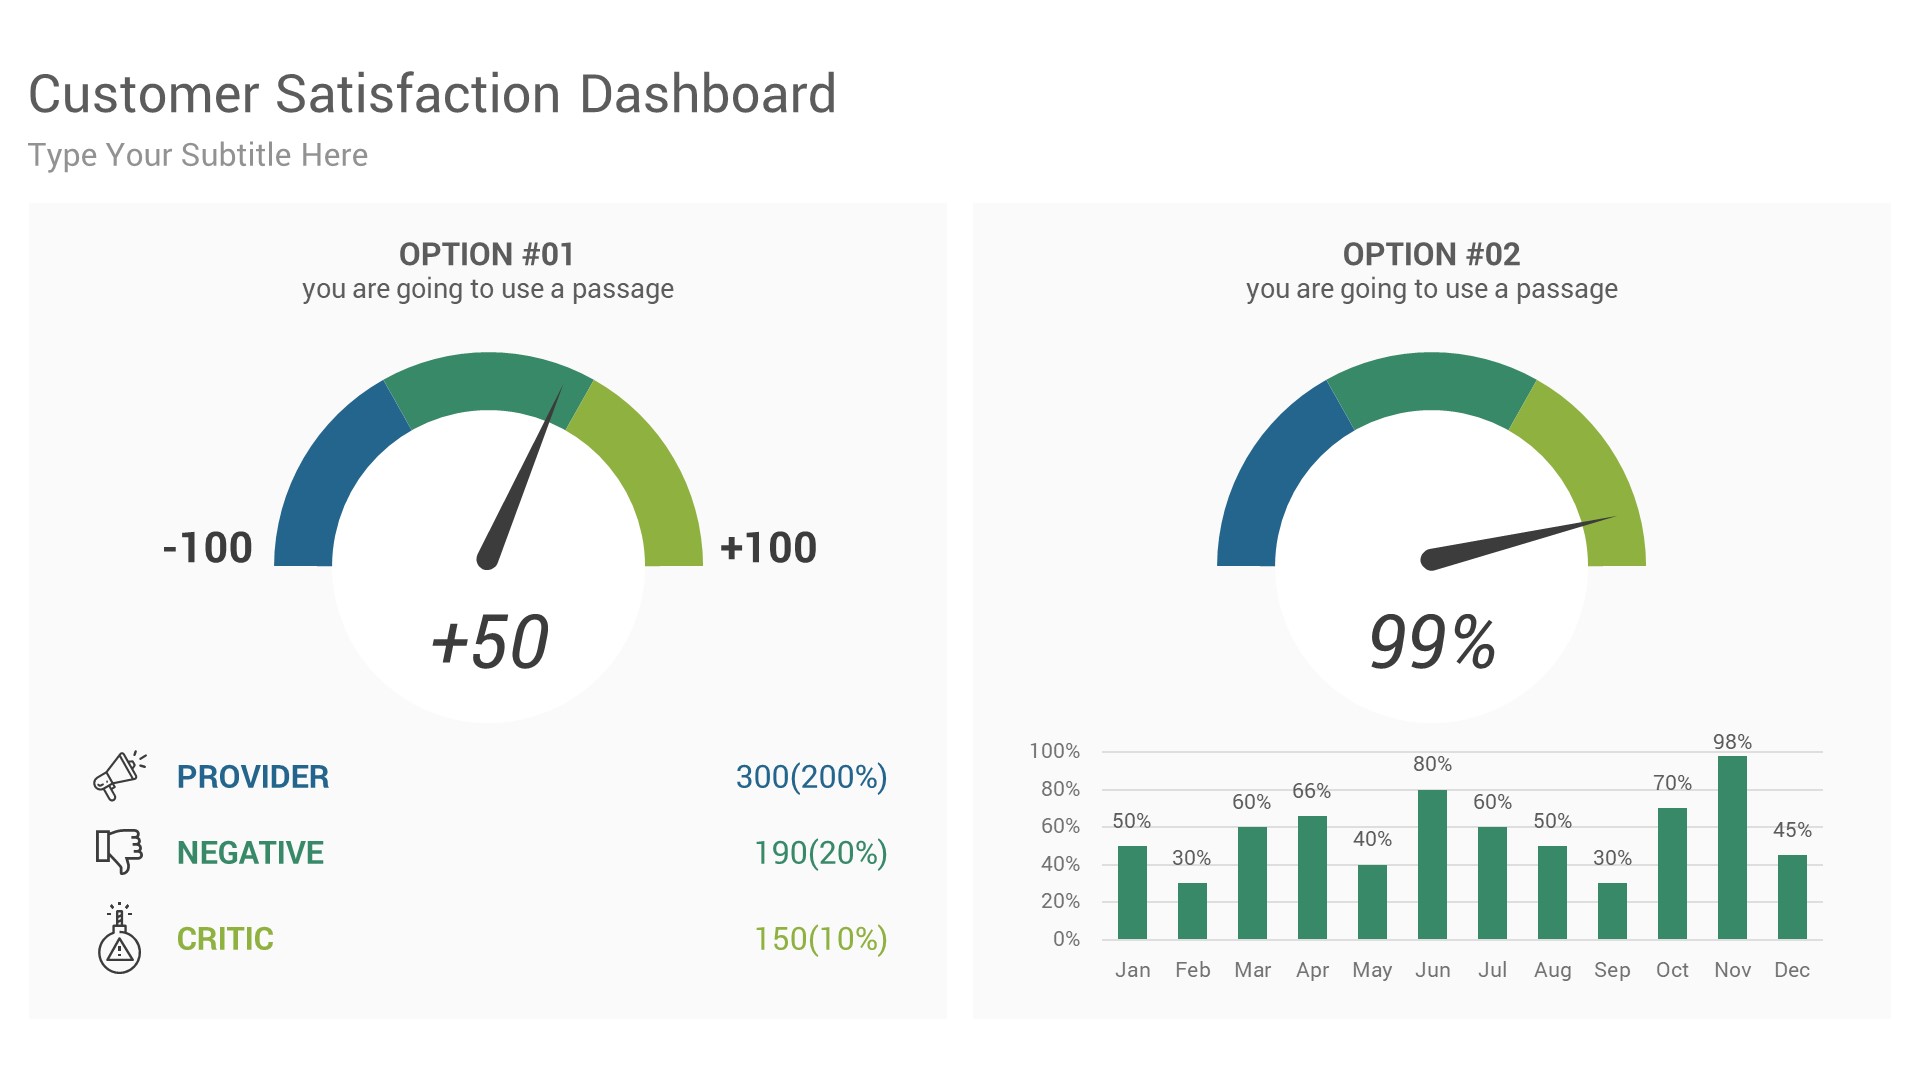
- Customer Satisfaction Dashboard
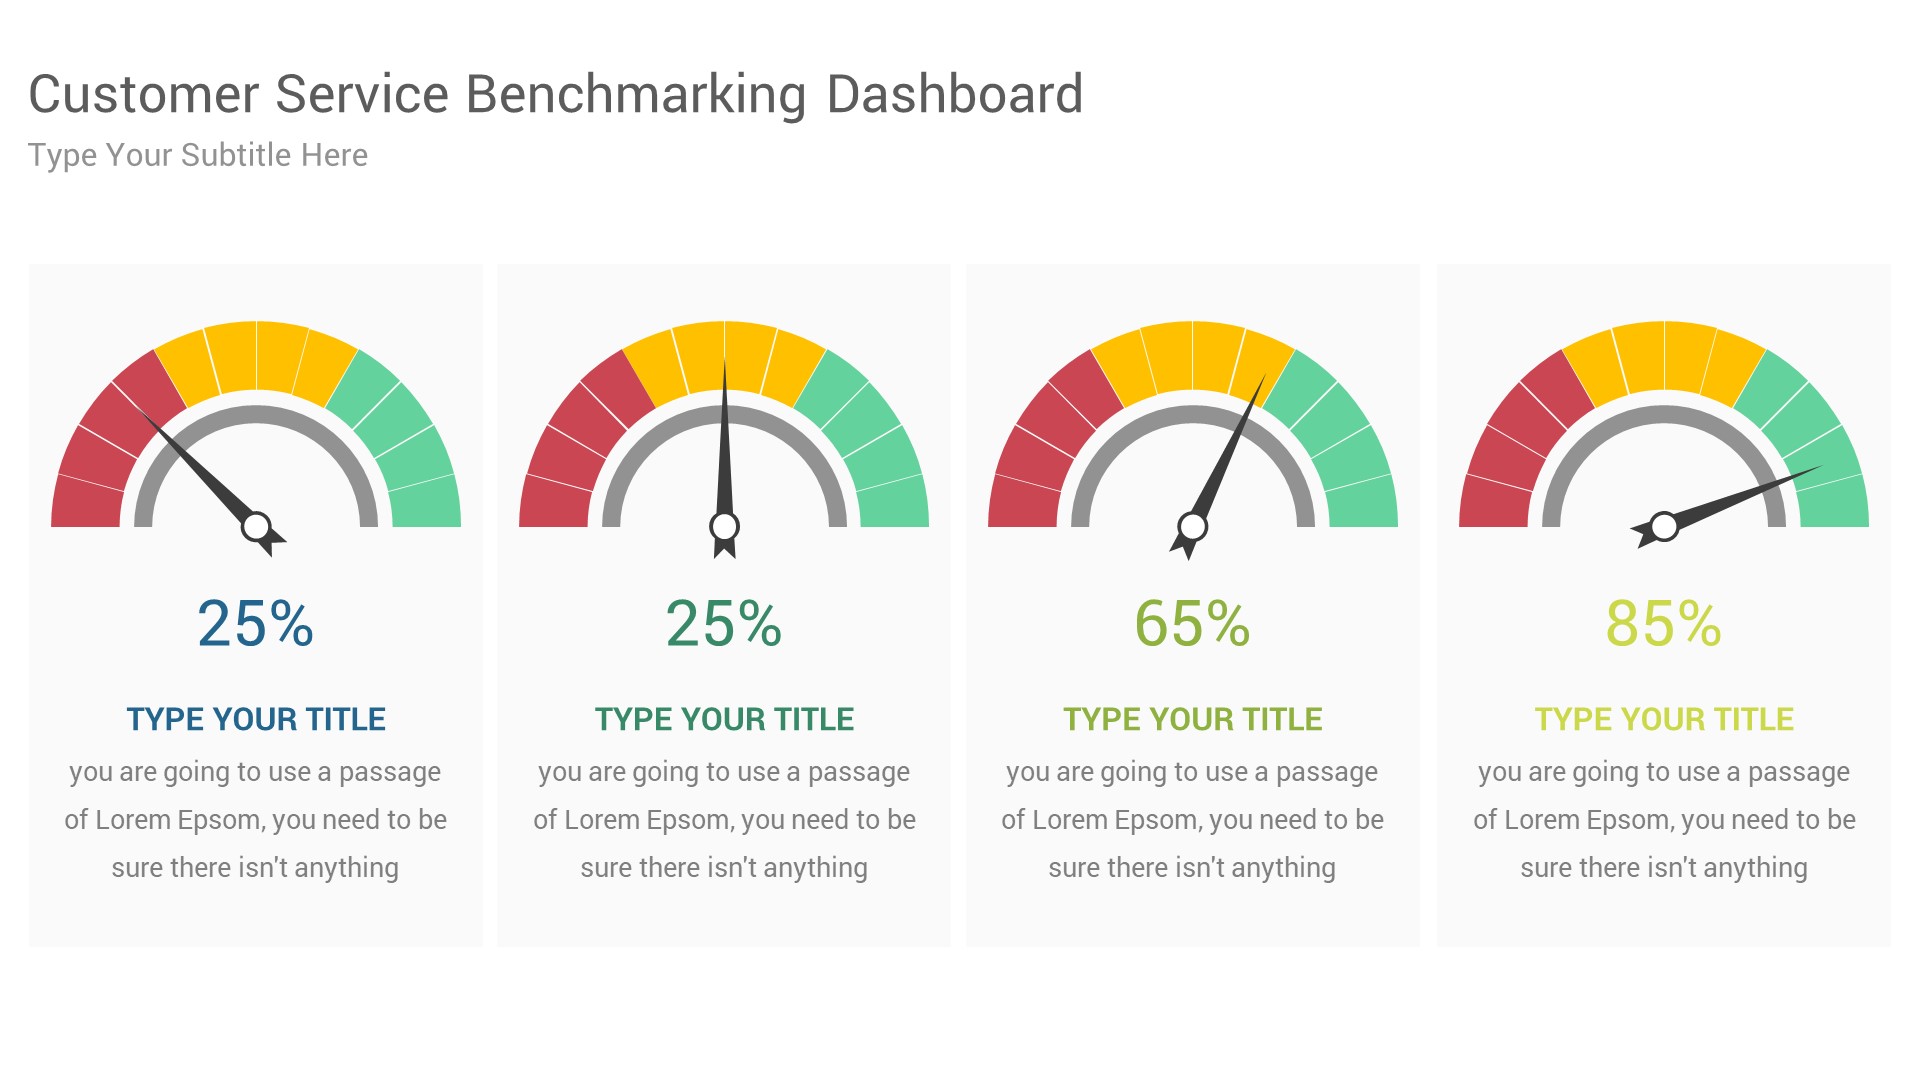
- Customer Service Benchmarking Dashboard
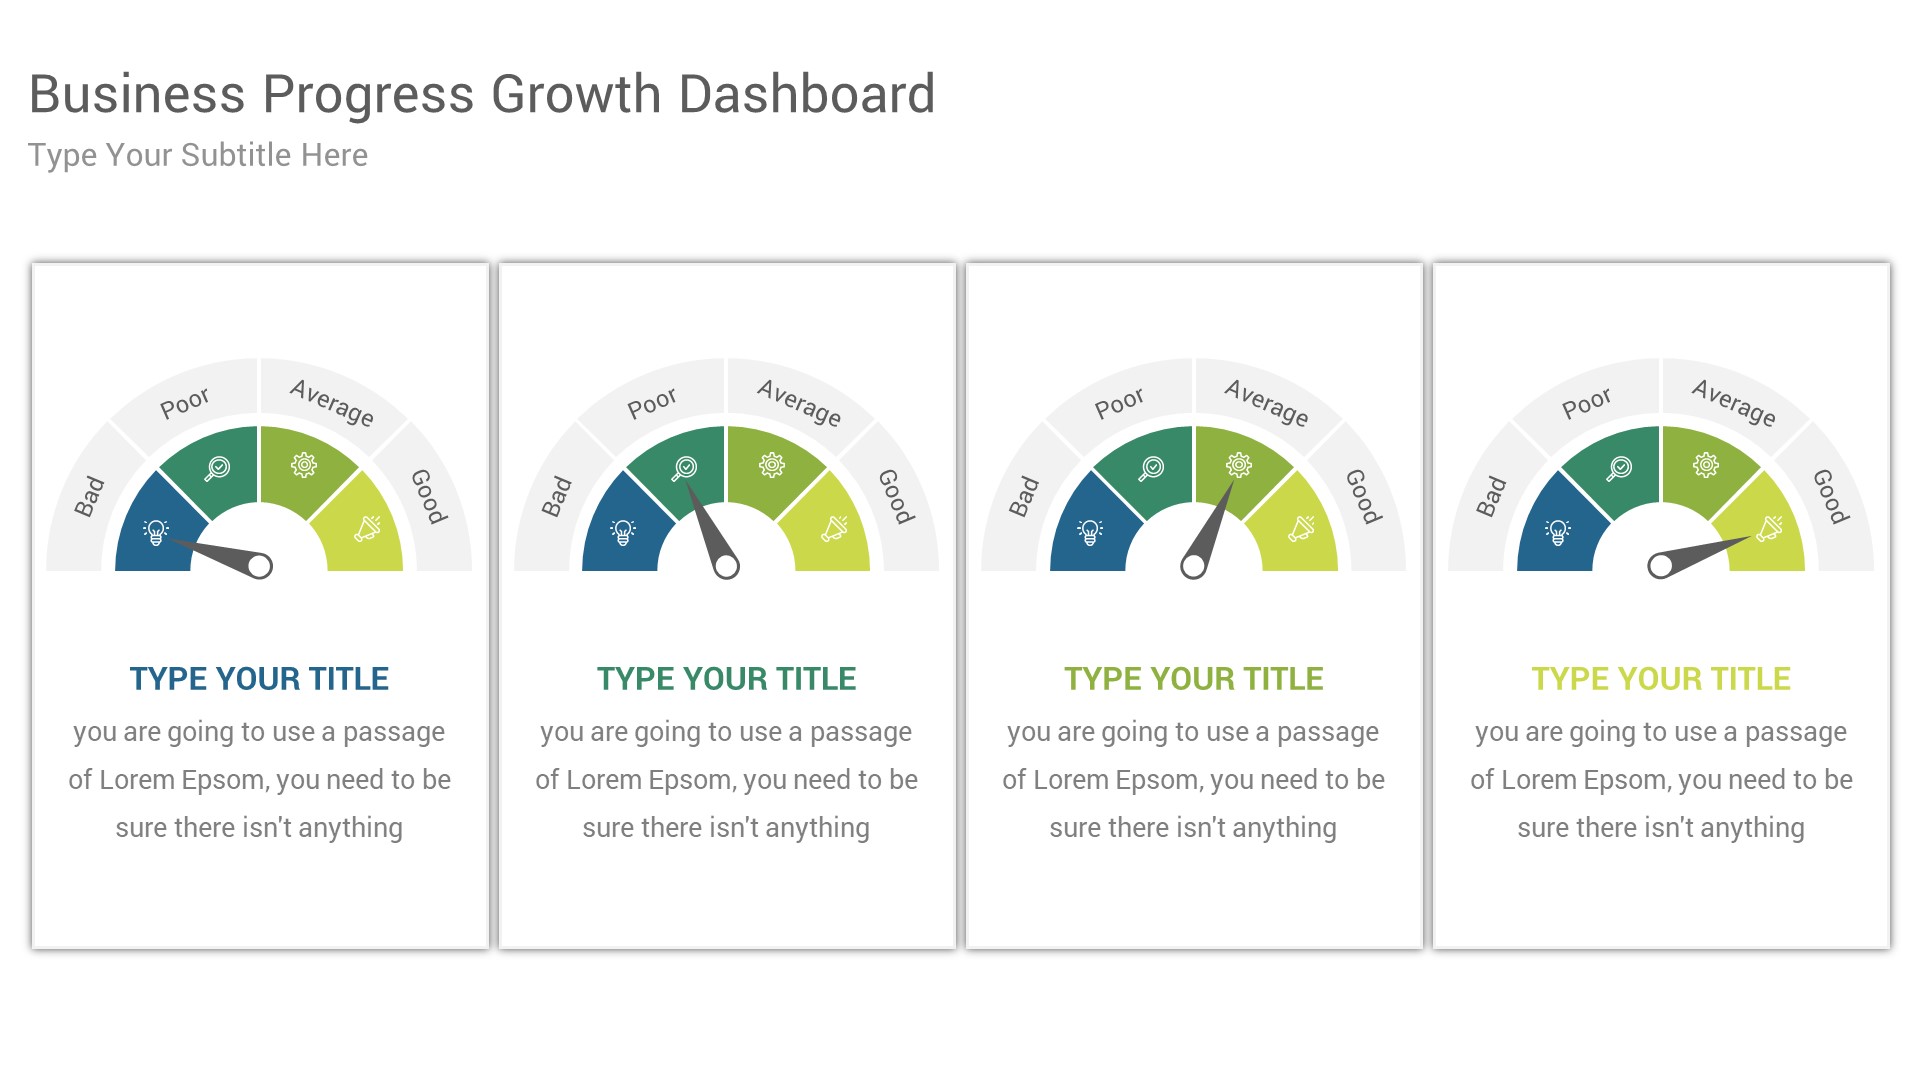
- Business Progress Growth Dashboard
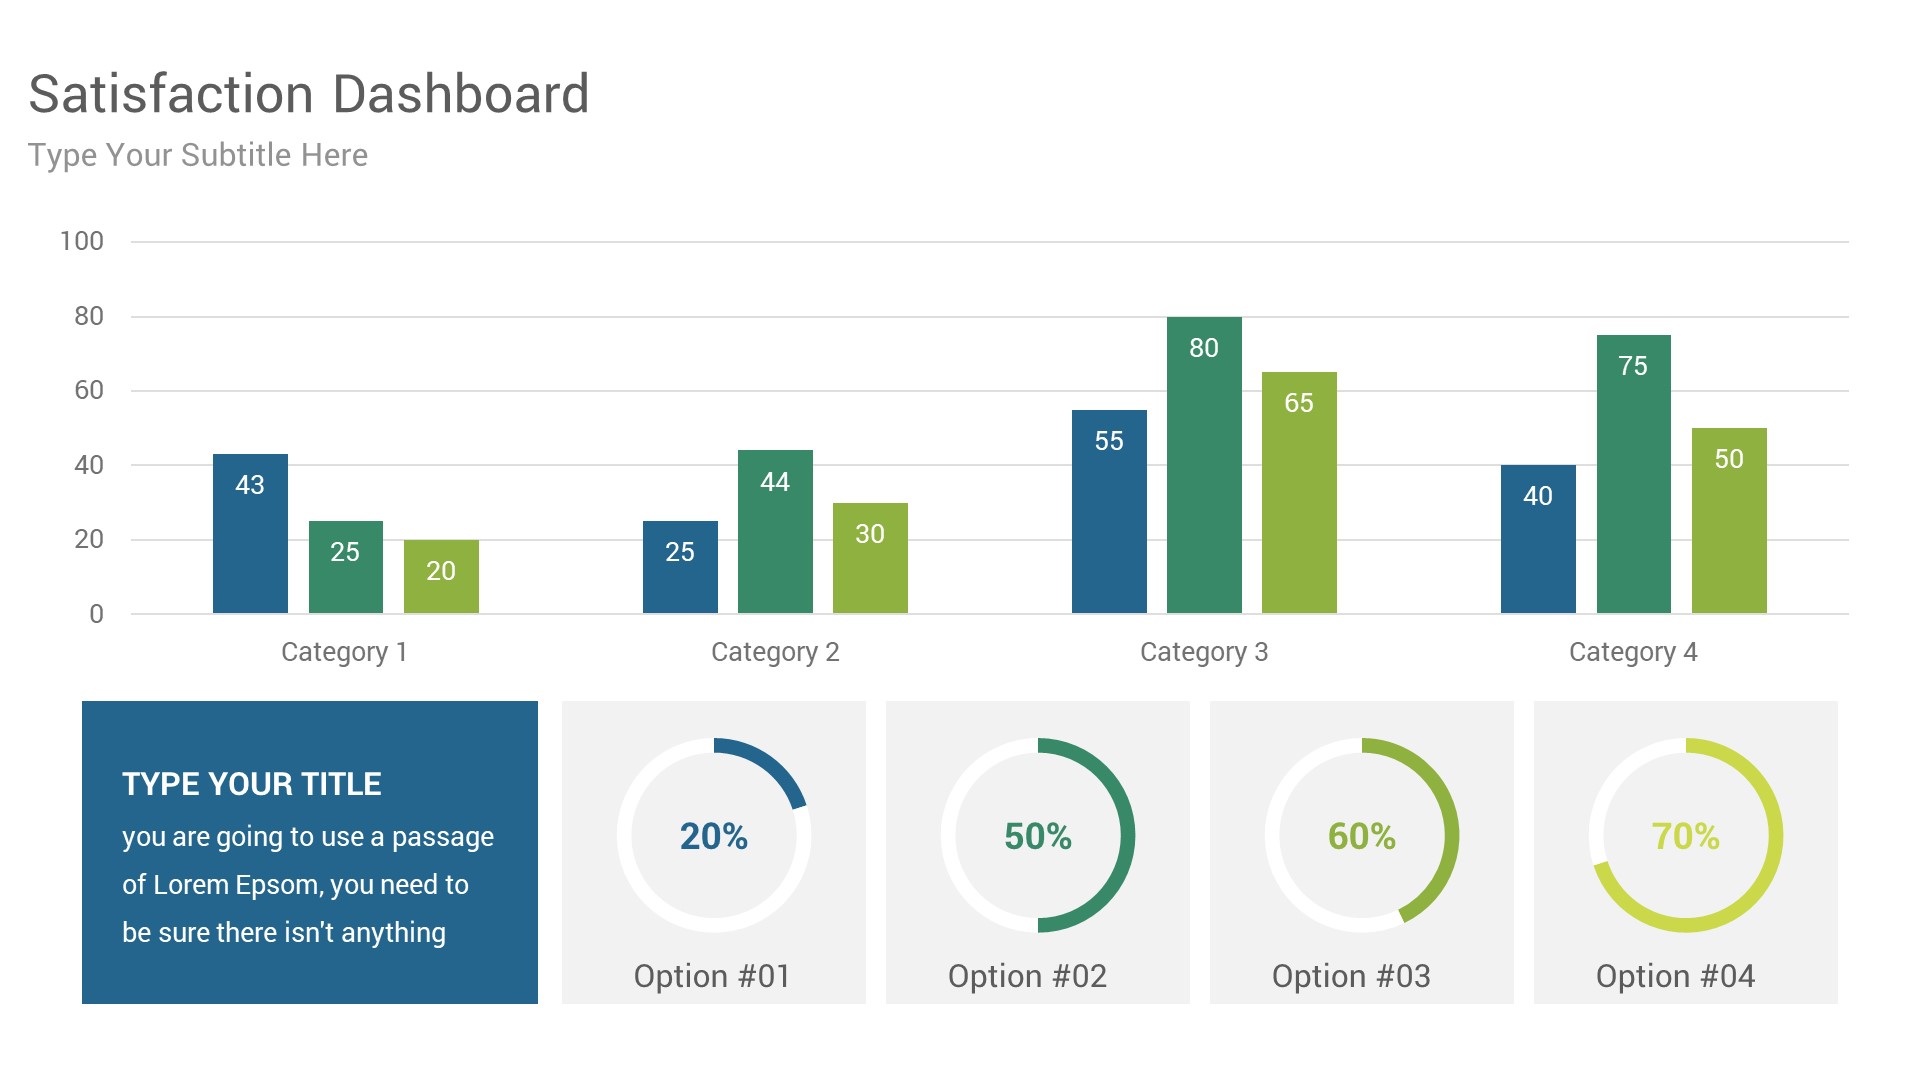
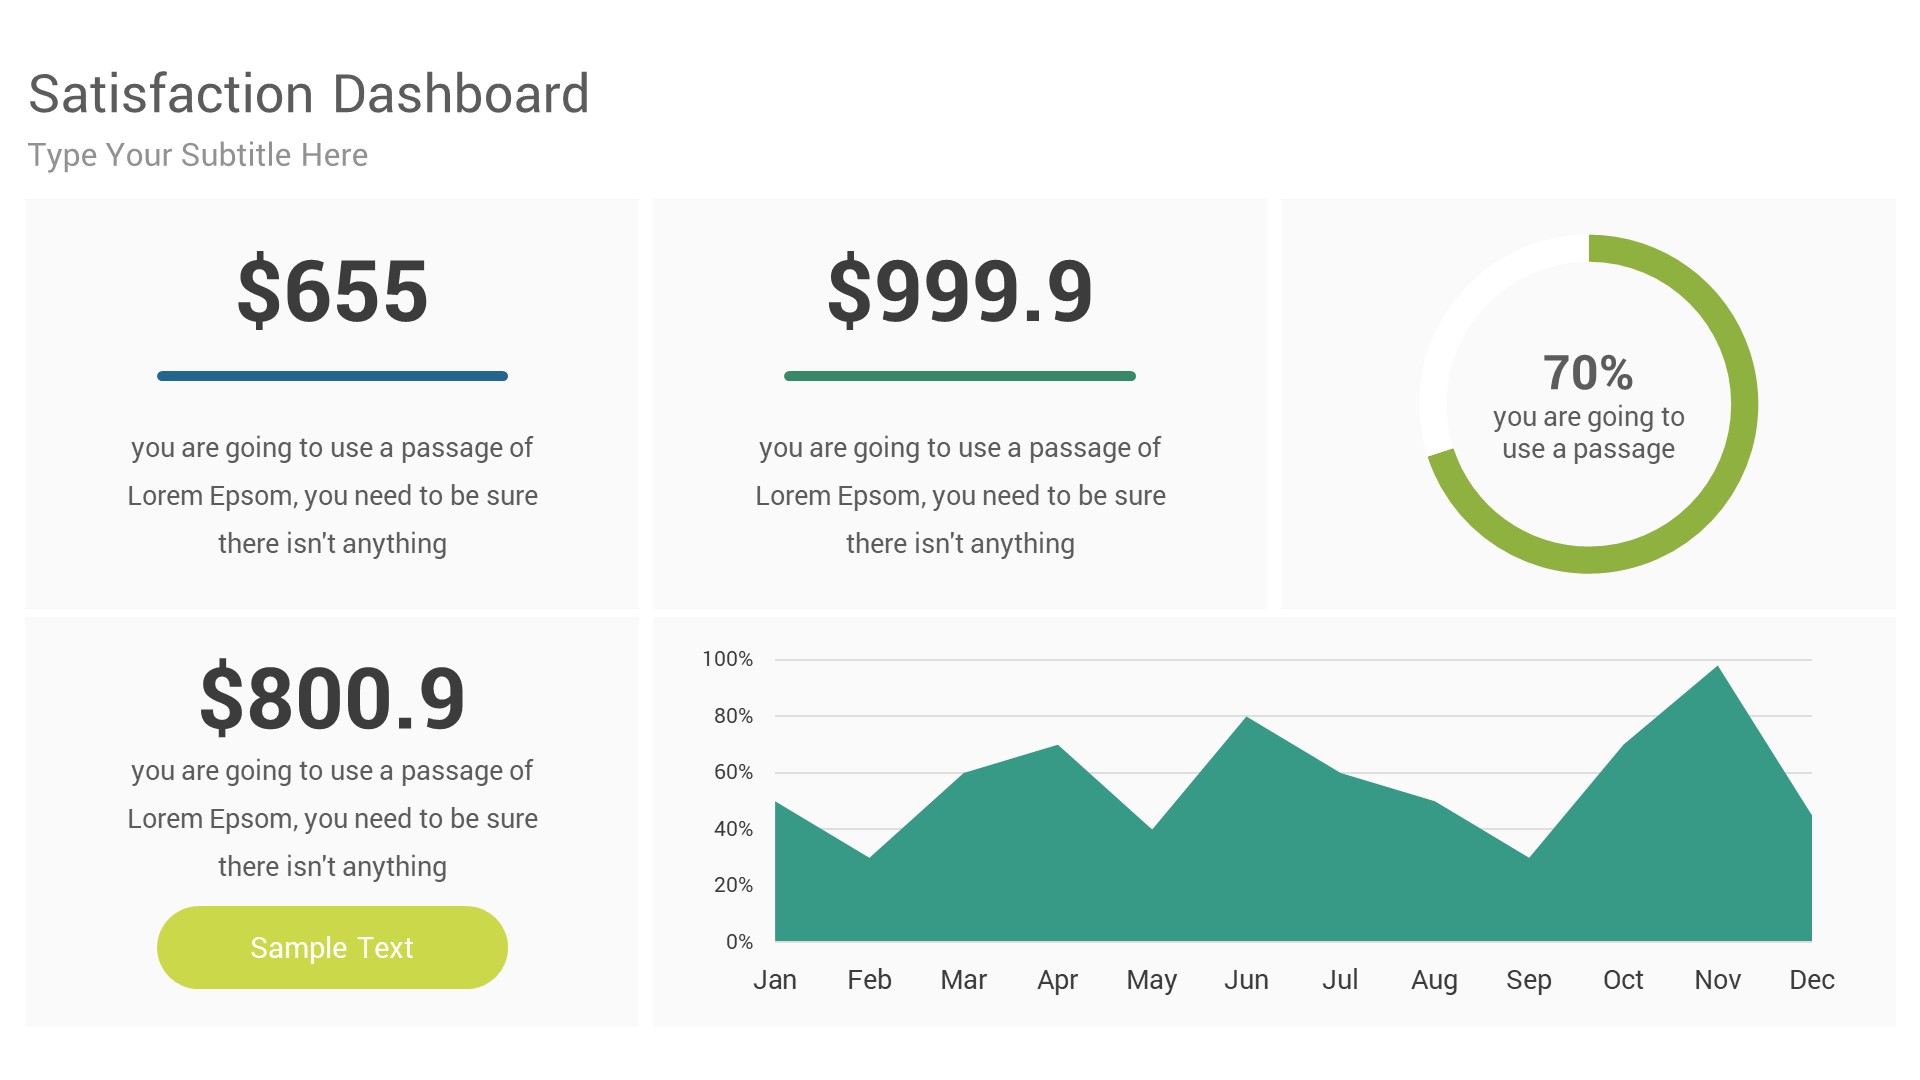
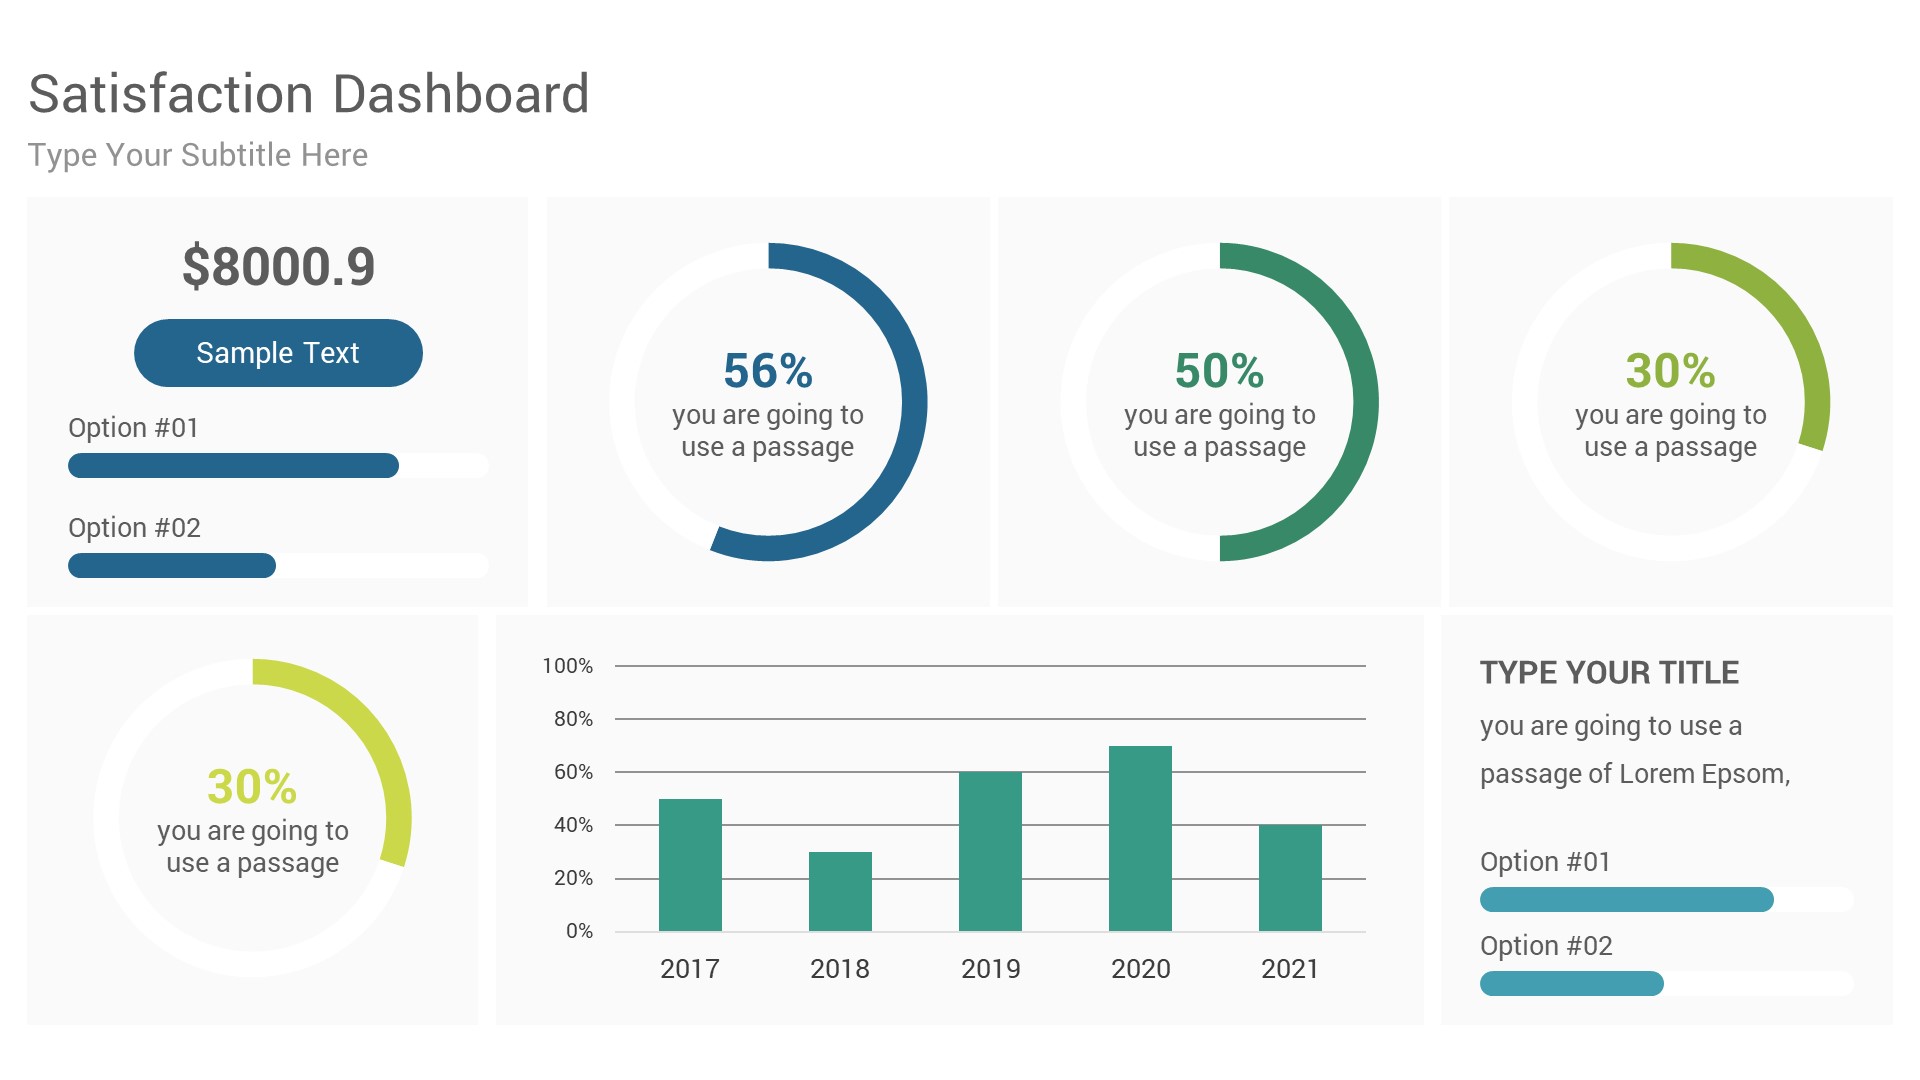
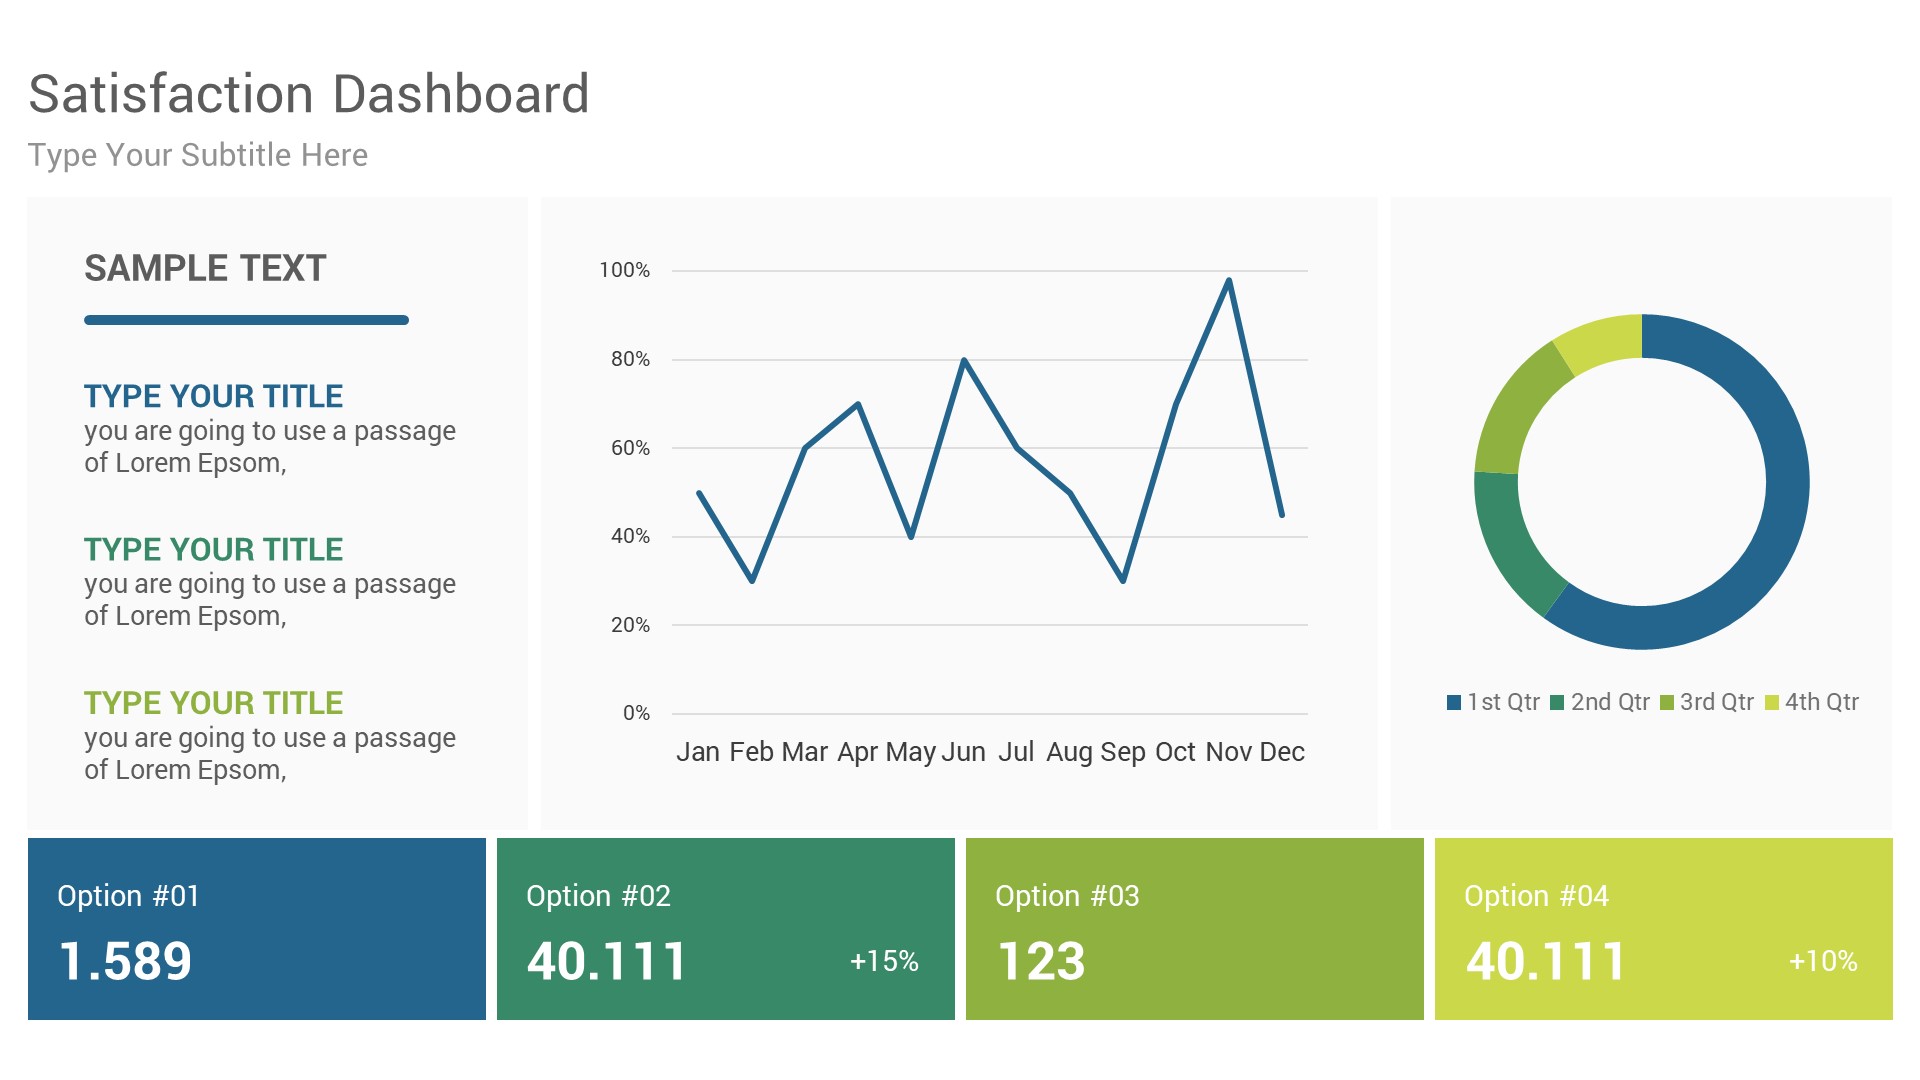
- Satisfaction Dashboard
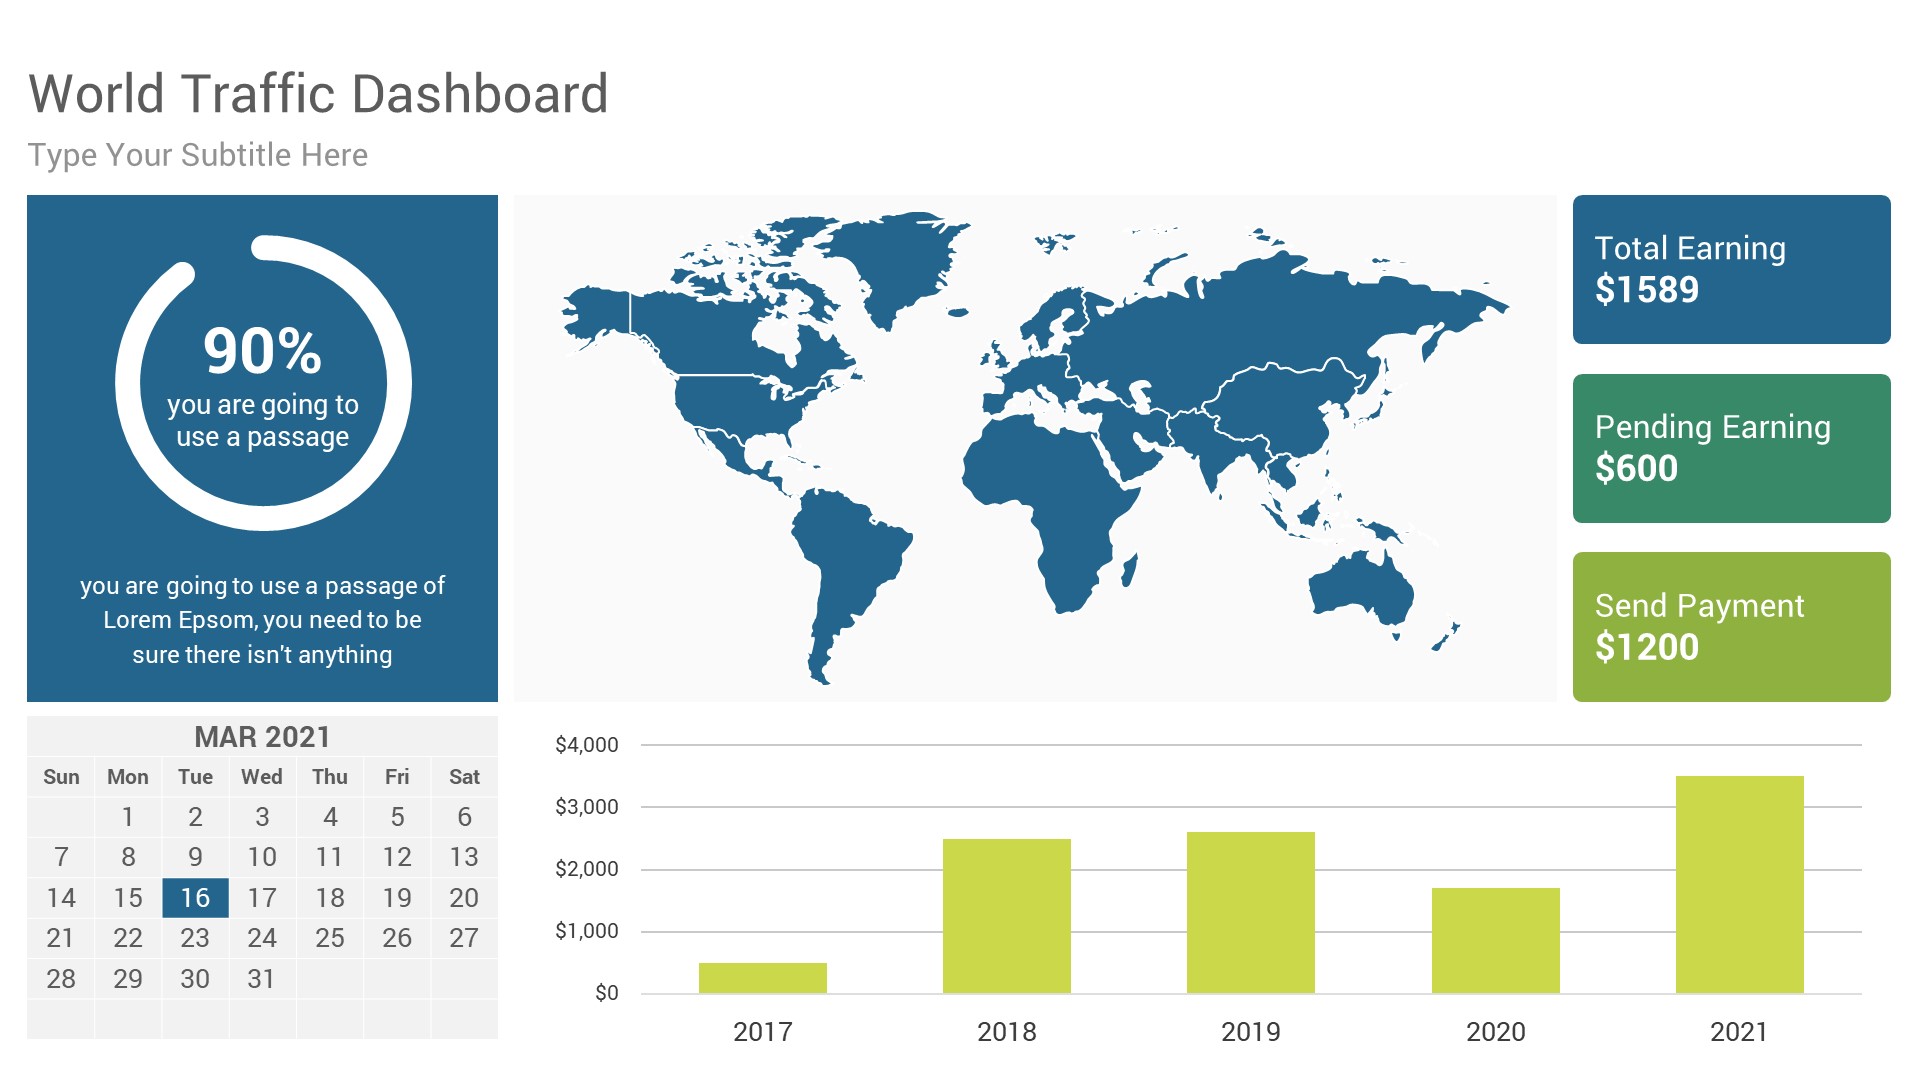
- World Traffic Dashboard
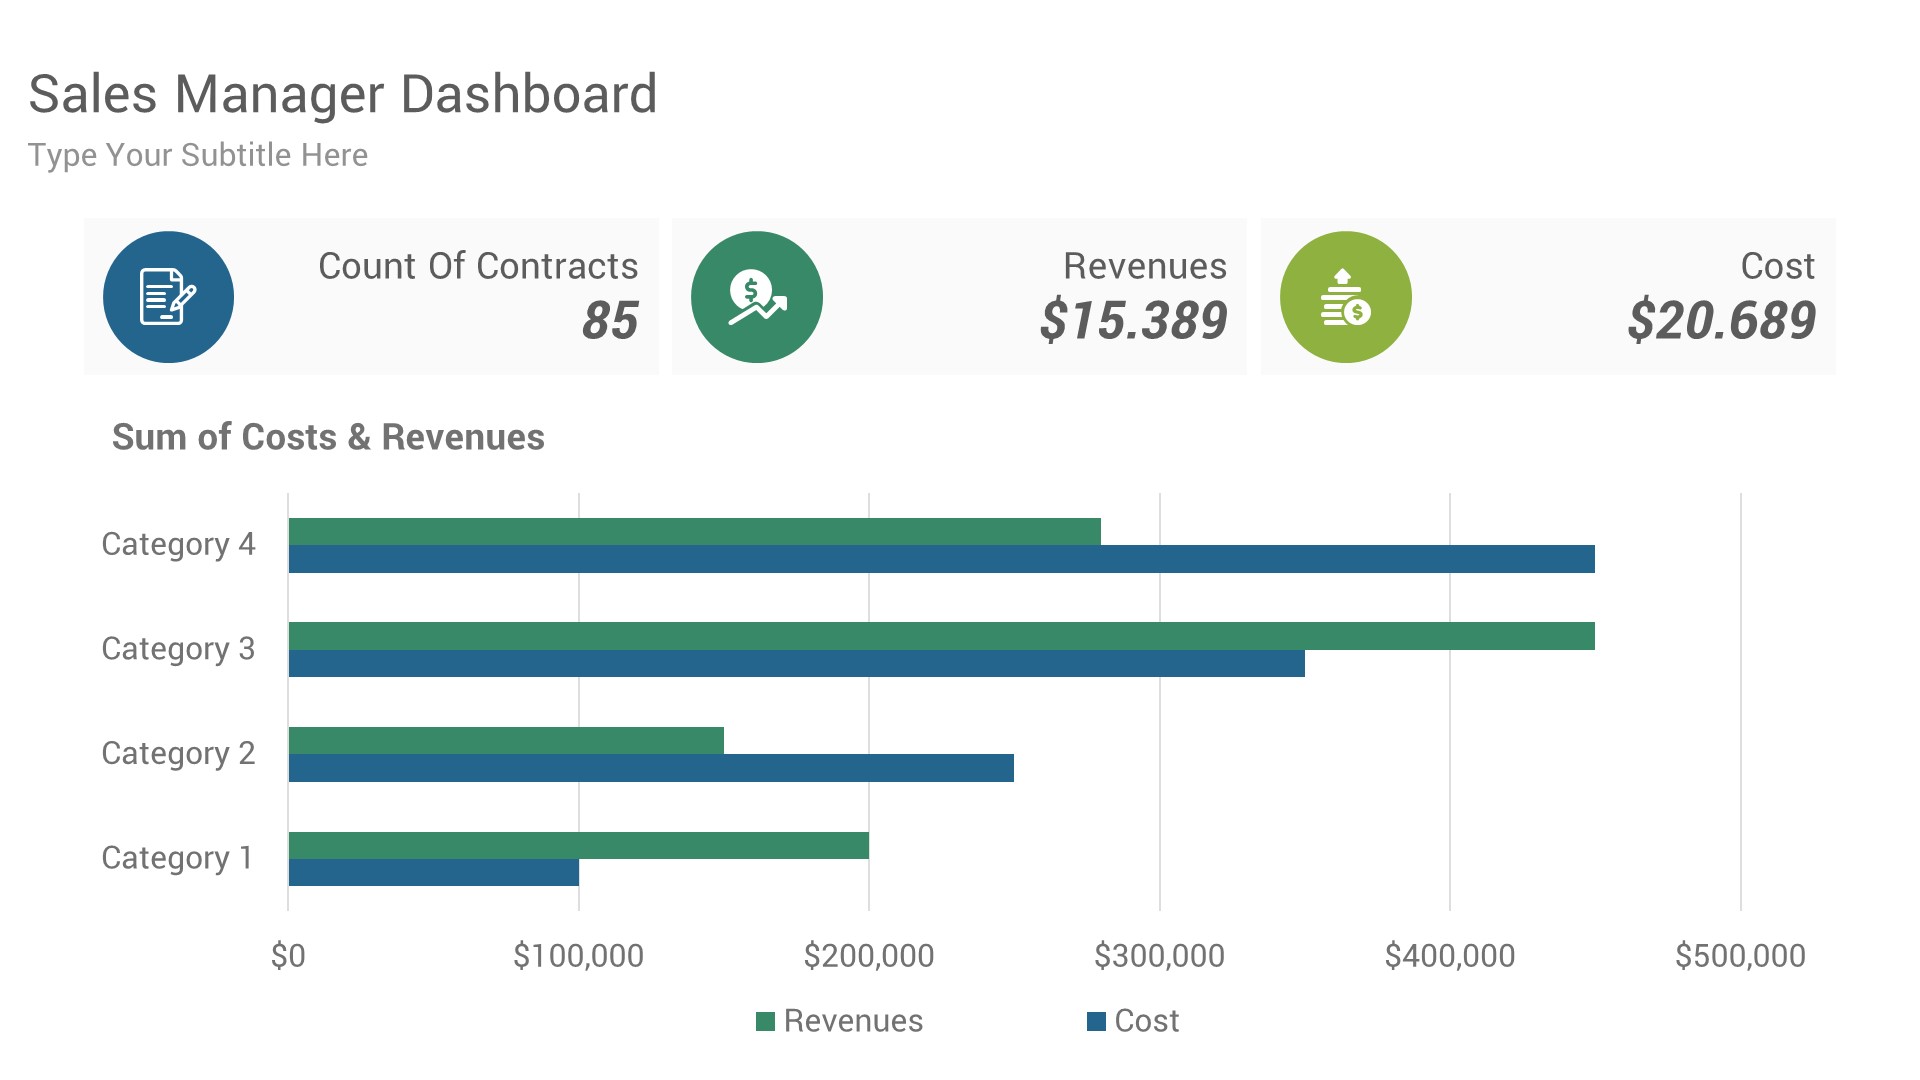
- Sales Manager Dashboard
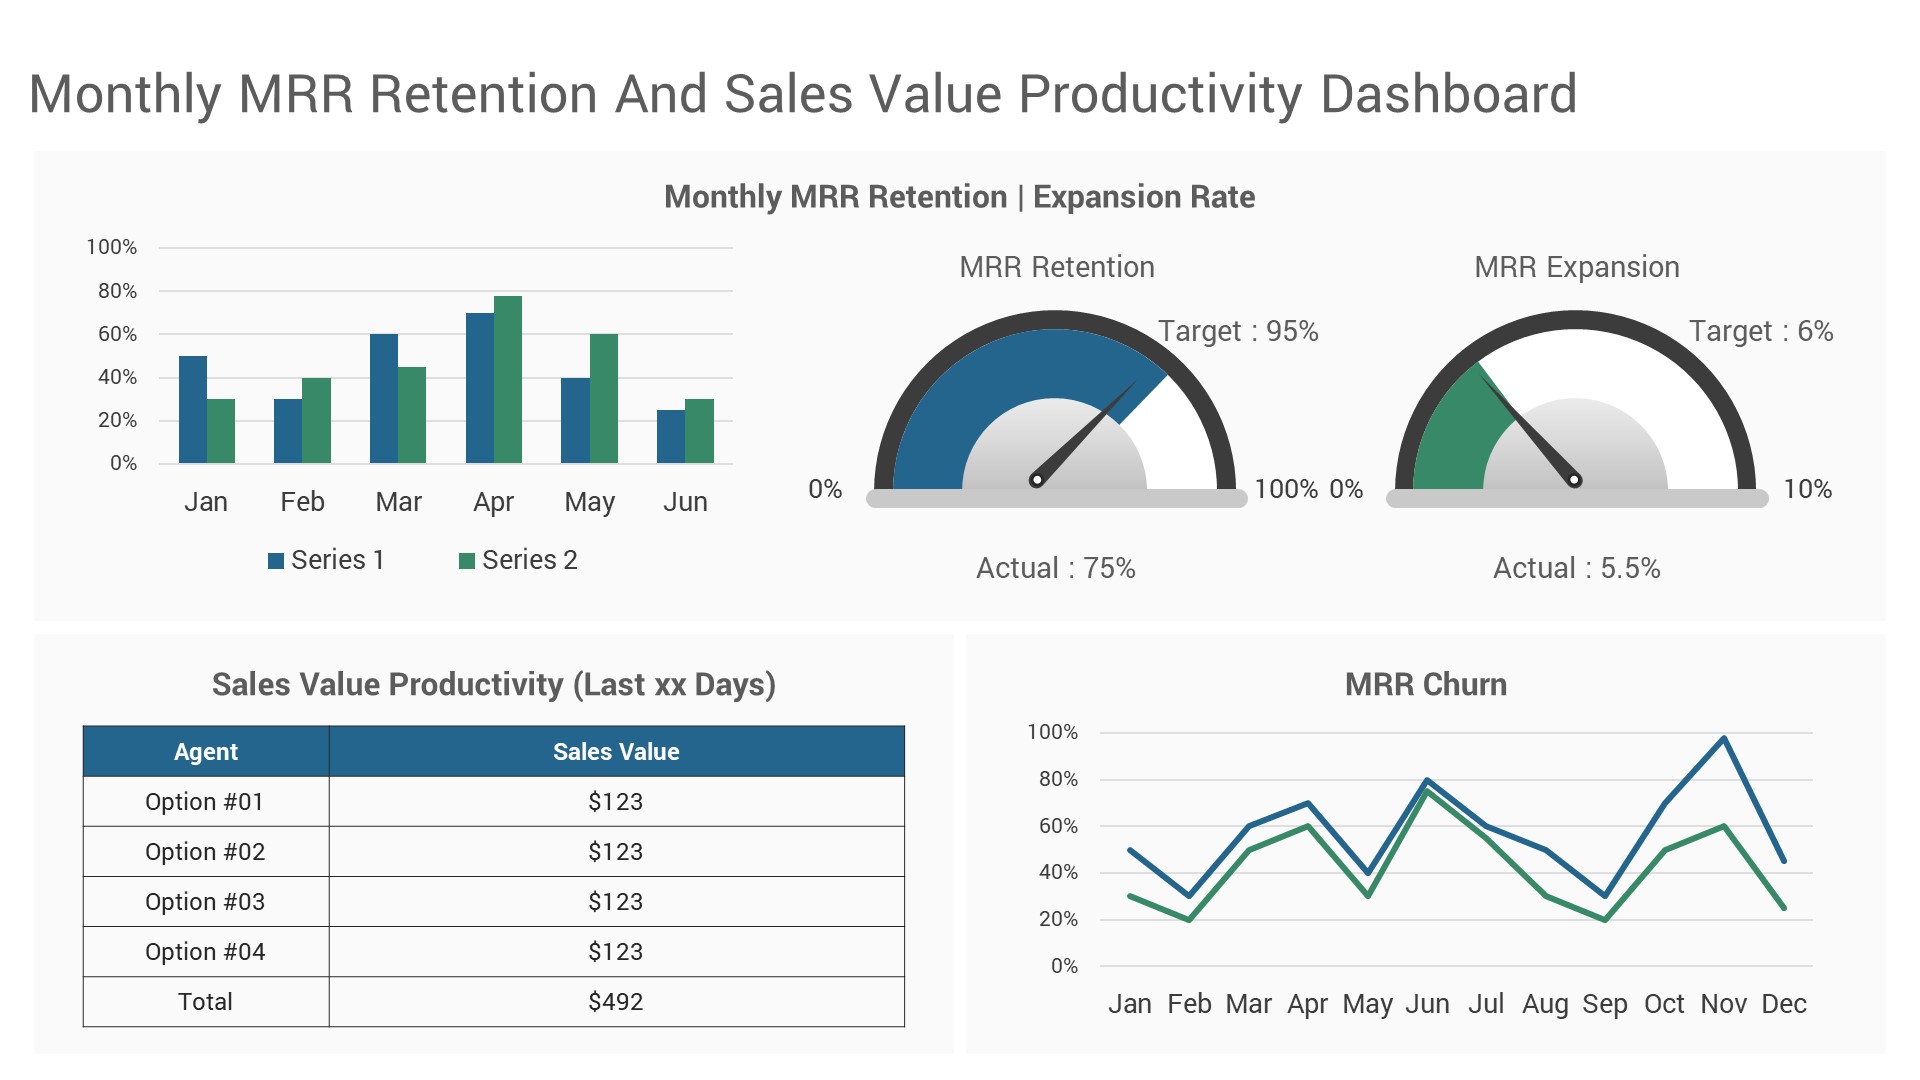
- Monthly MRR Retention and Sales Value Productivity Dashboard
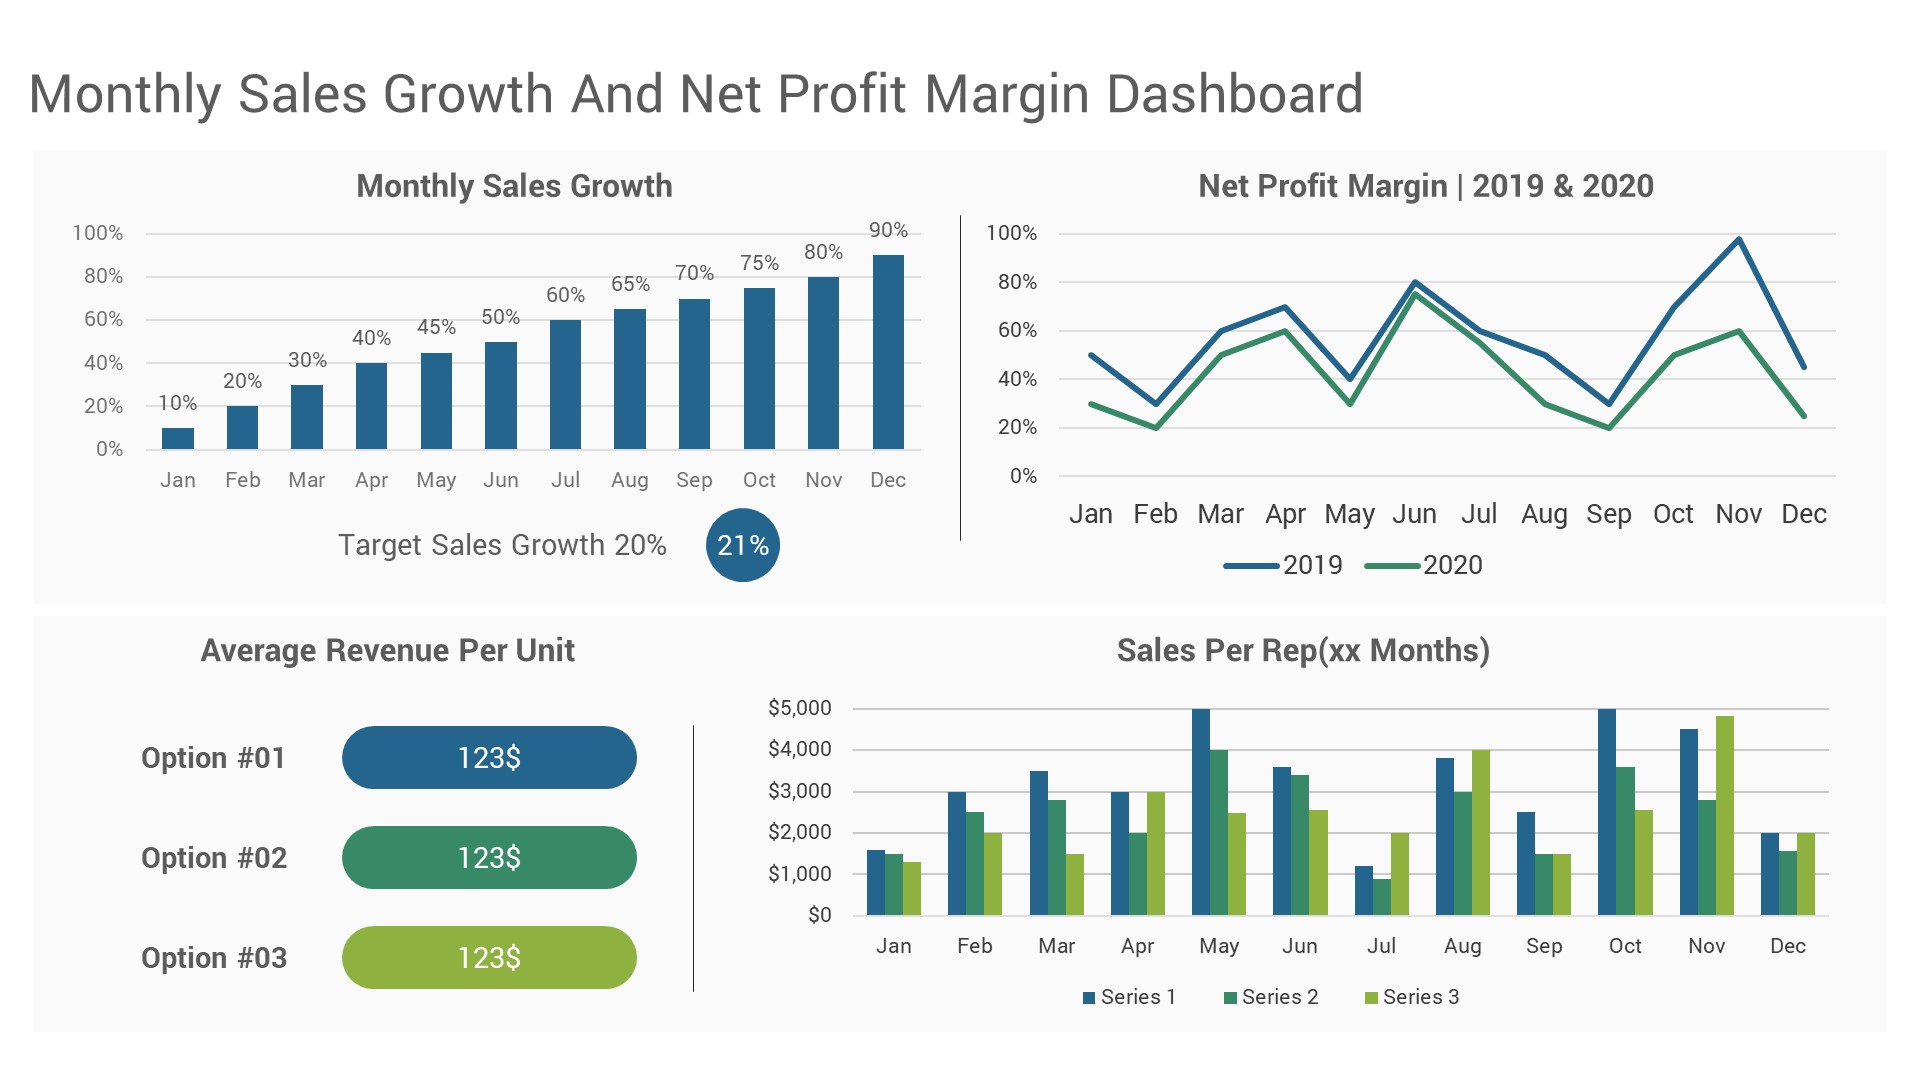
- Monthly Sales Growth and Net Profit Margin Dashboard
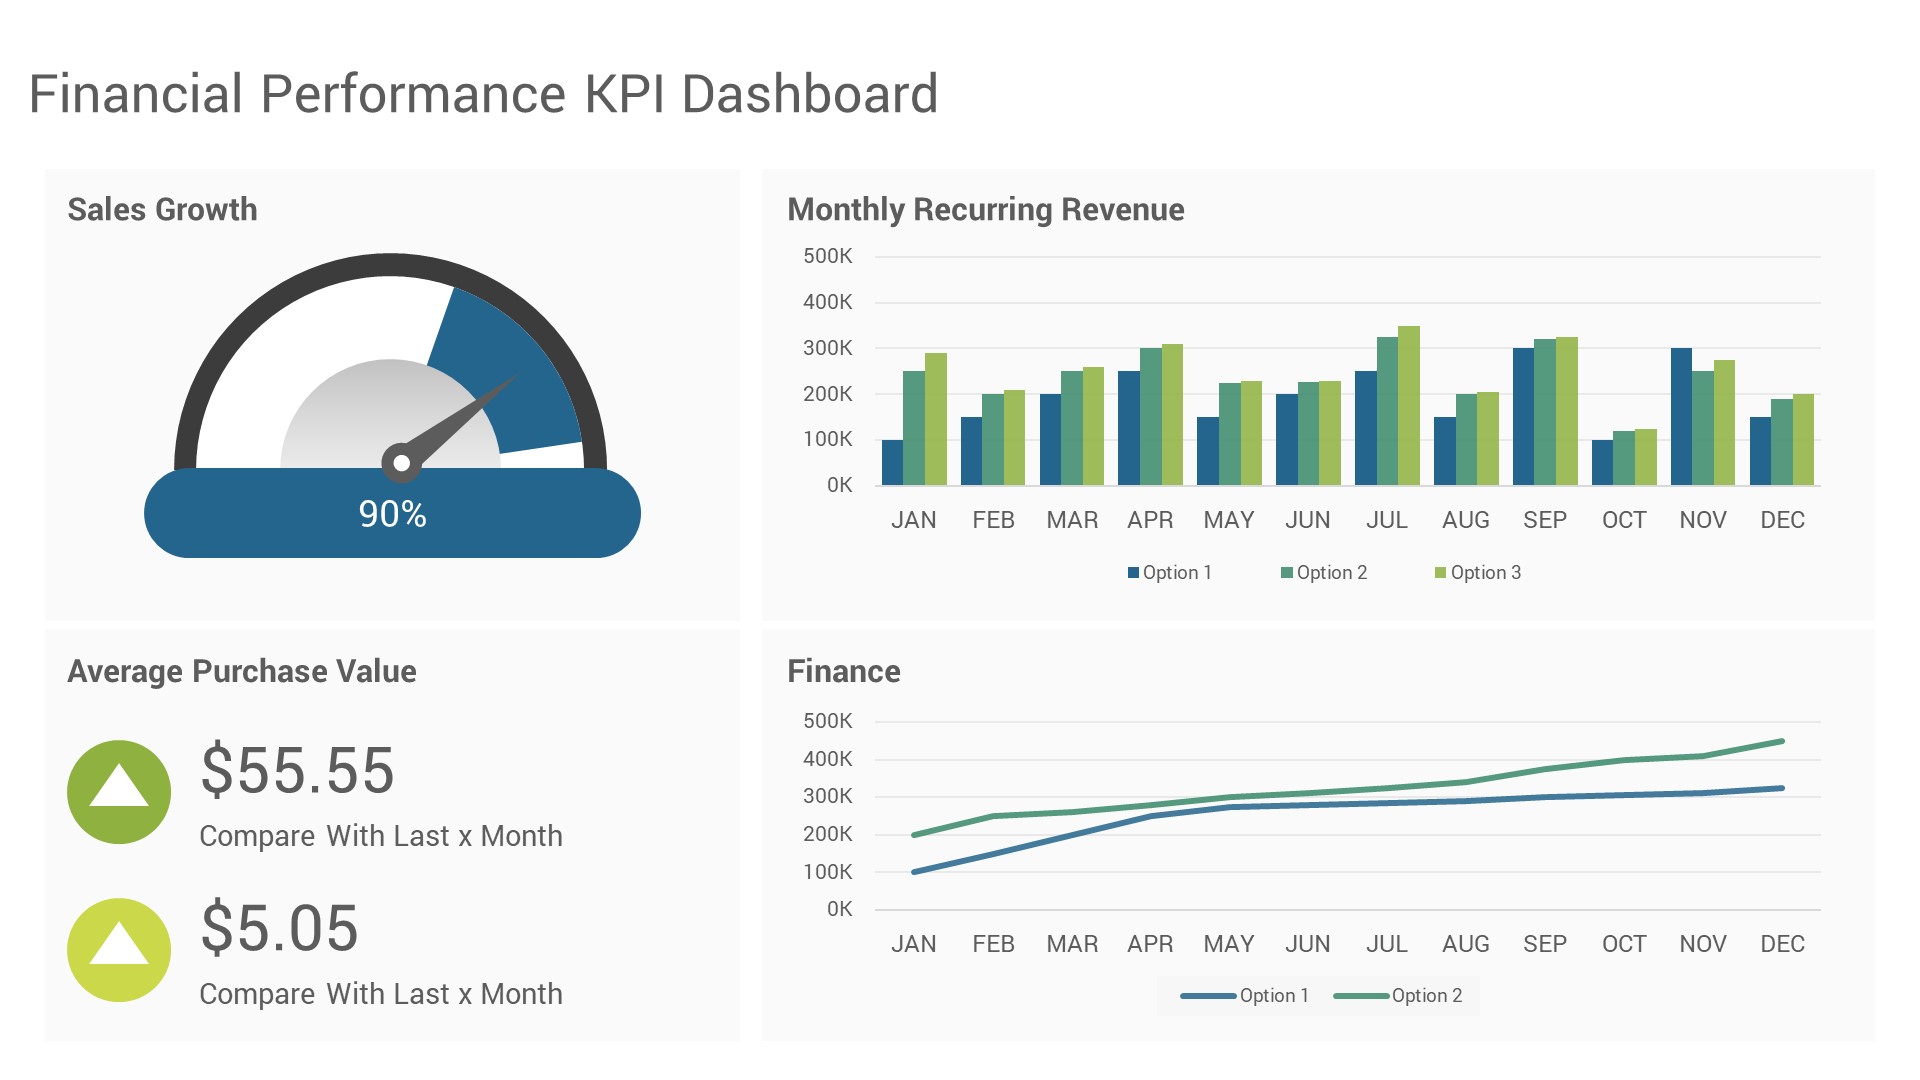
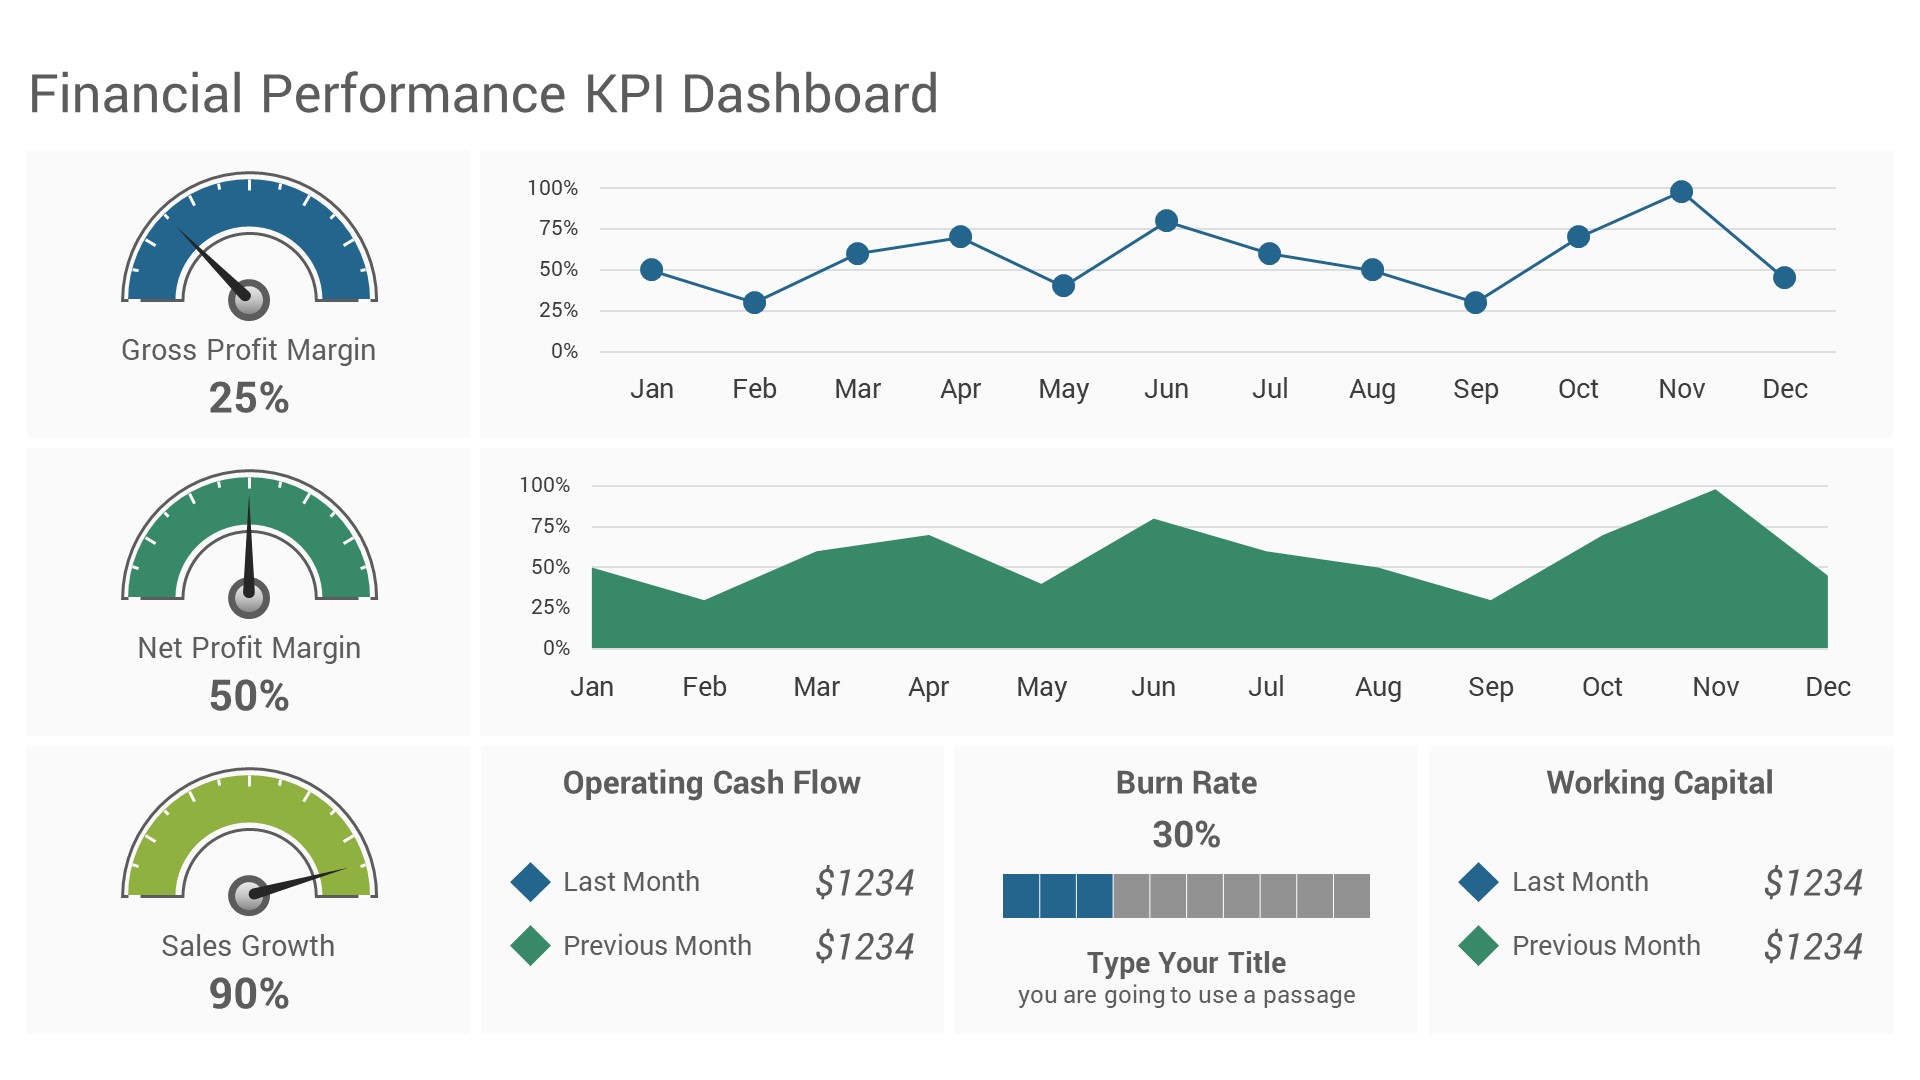
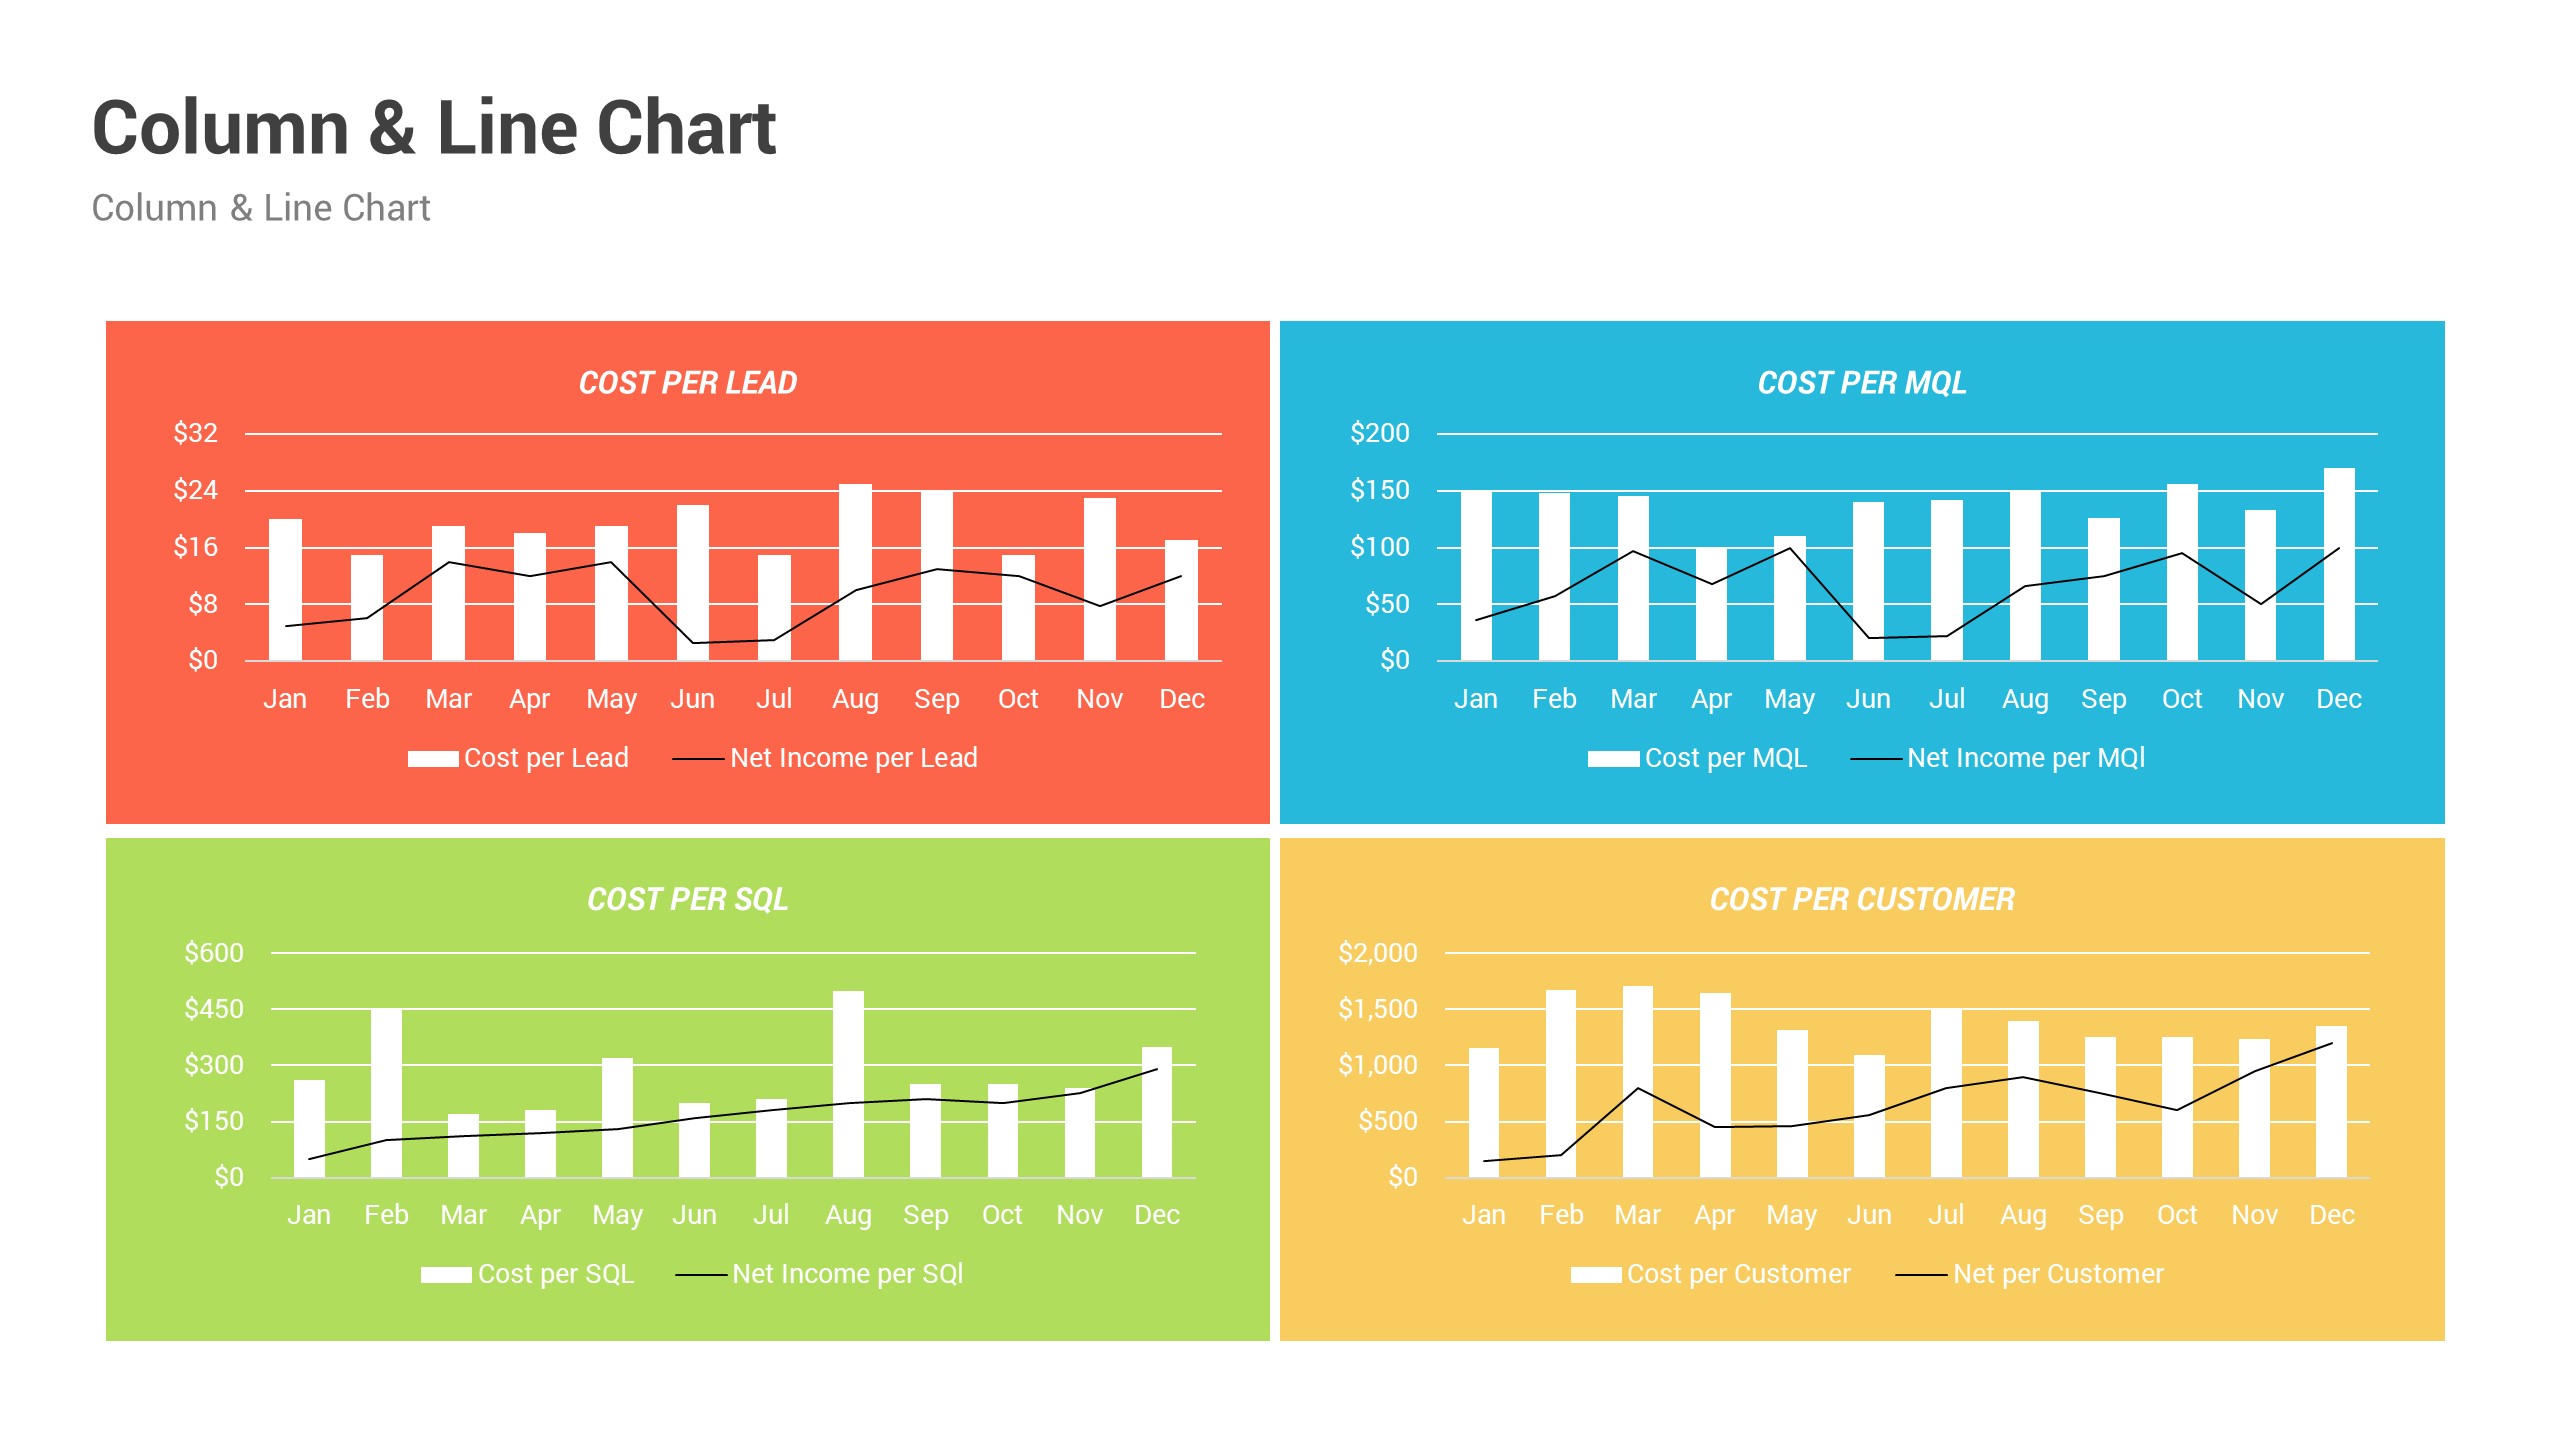
- Financial Performance KPI Dashboard
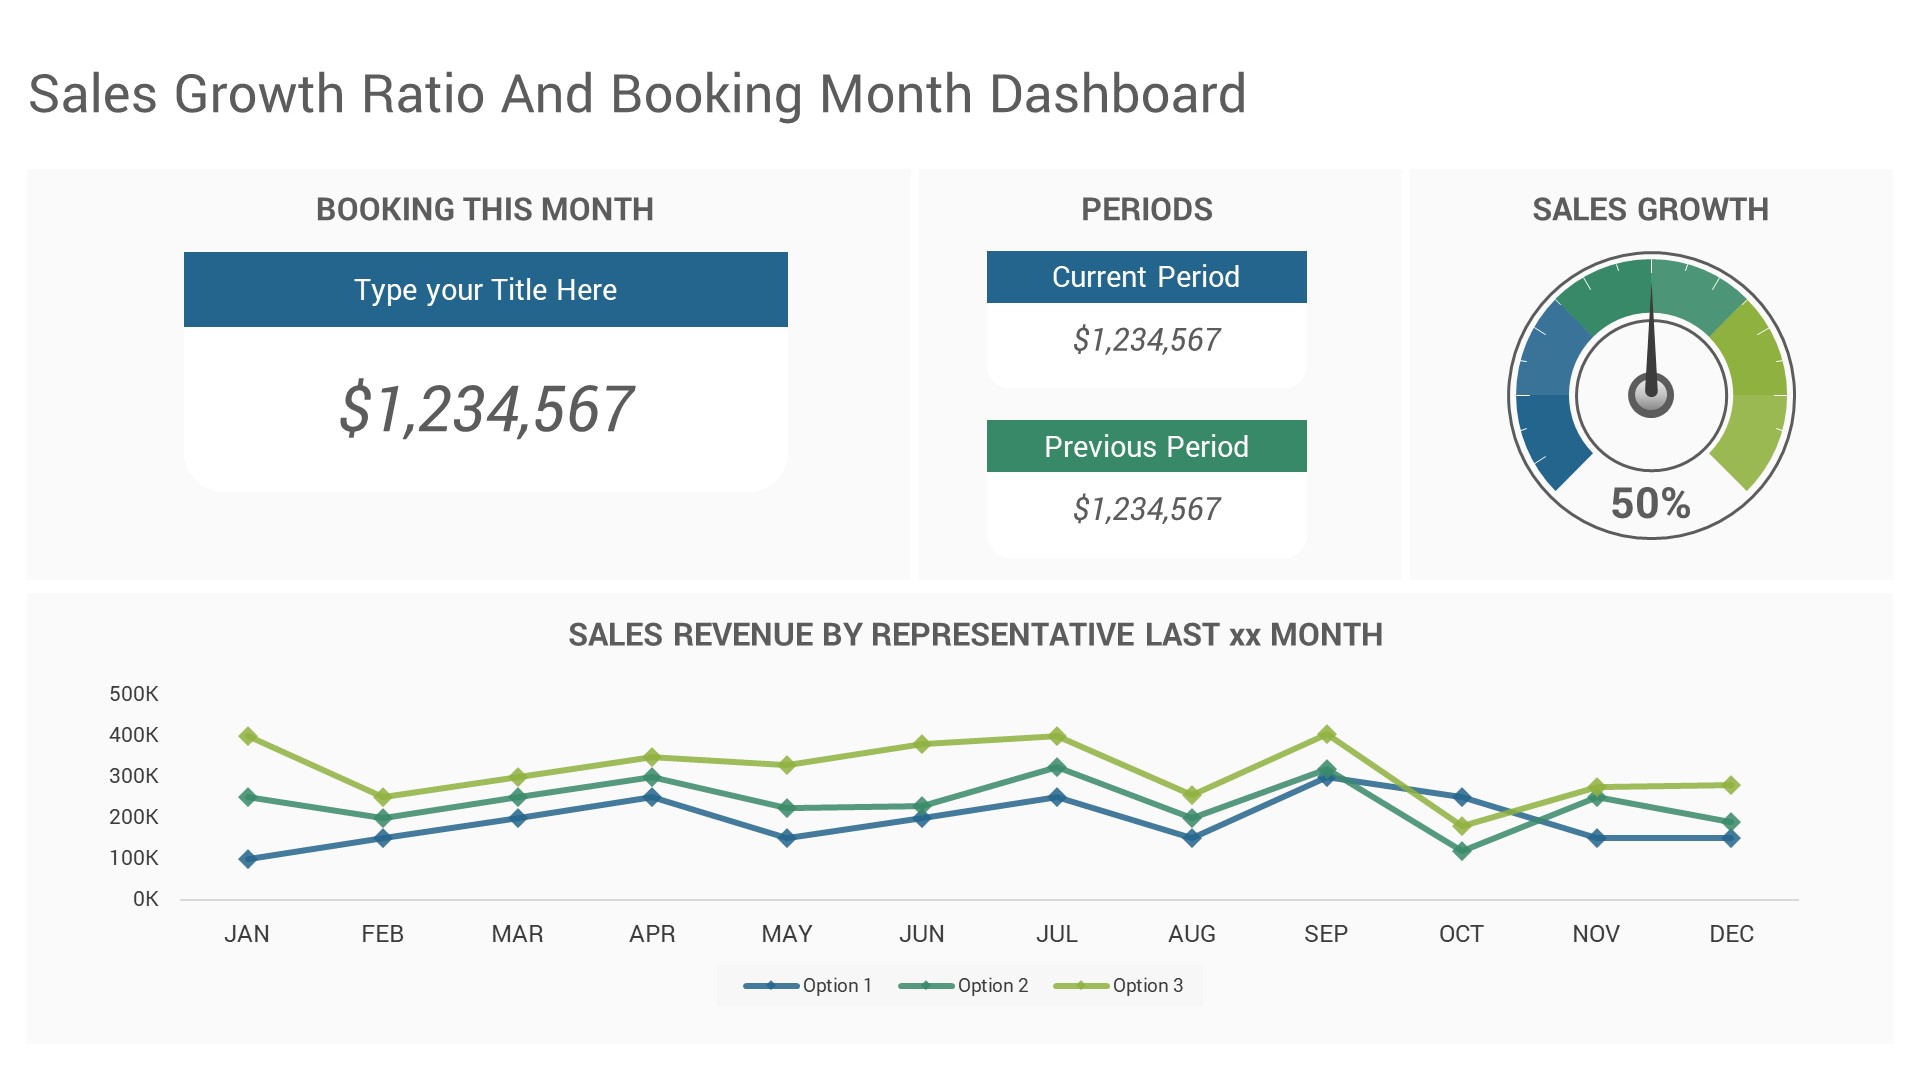
- Sales Growth Ratio and Booking Month Dashboard
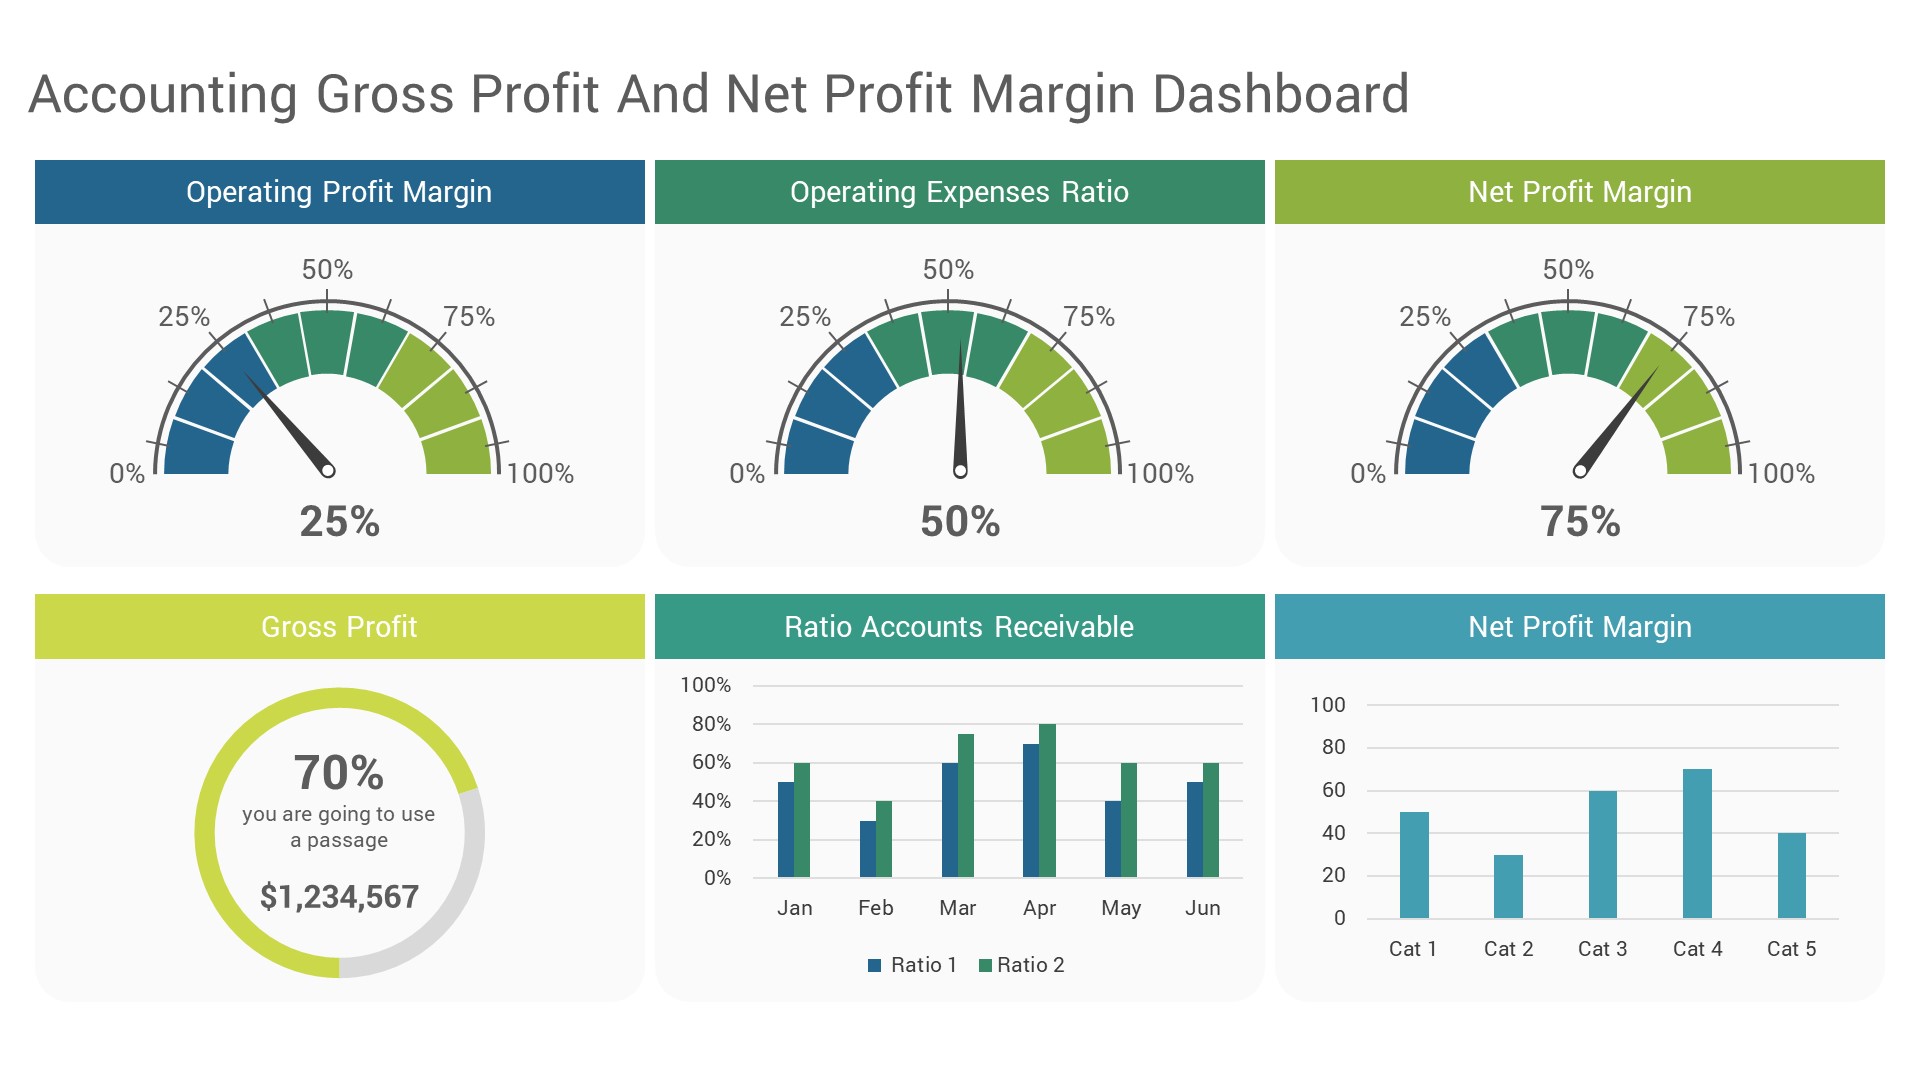
- Accounting Gross Profit and Net Profit Margin Dashboard
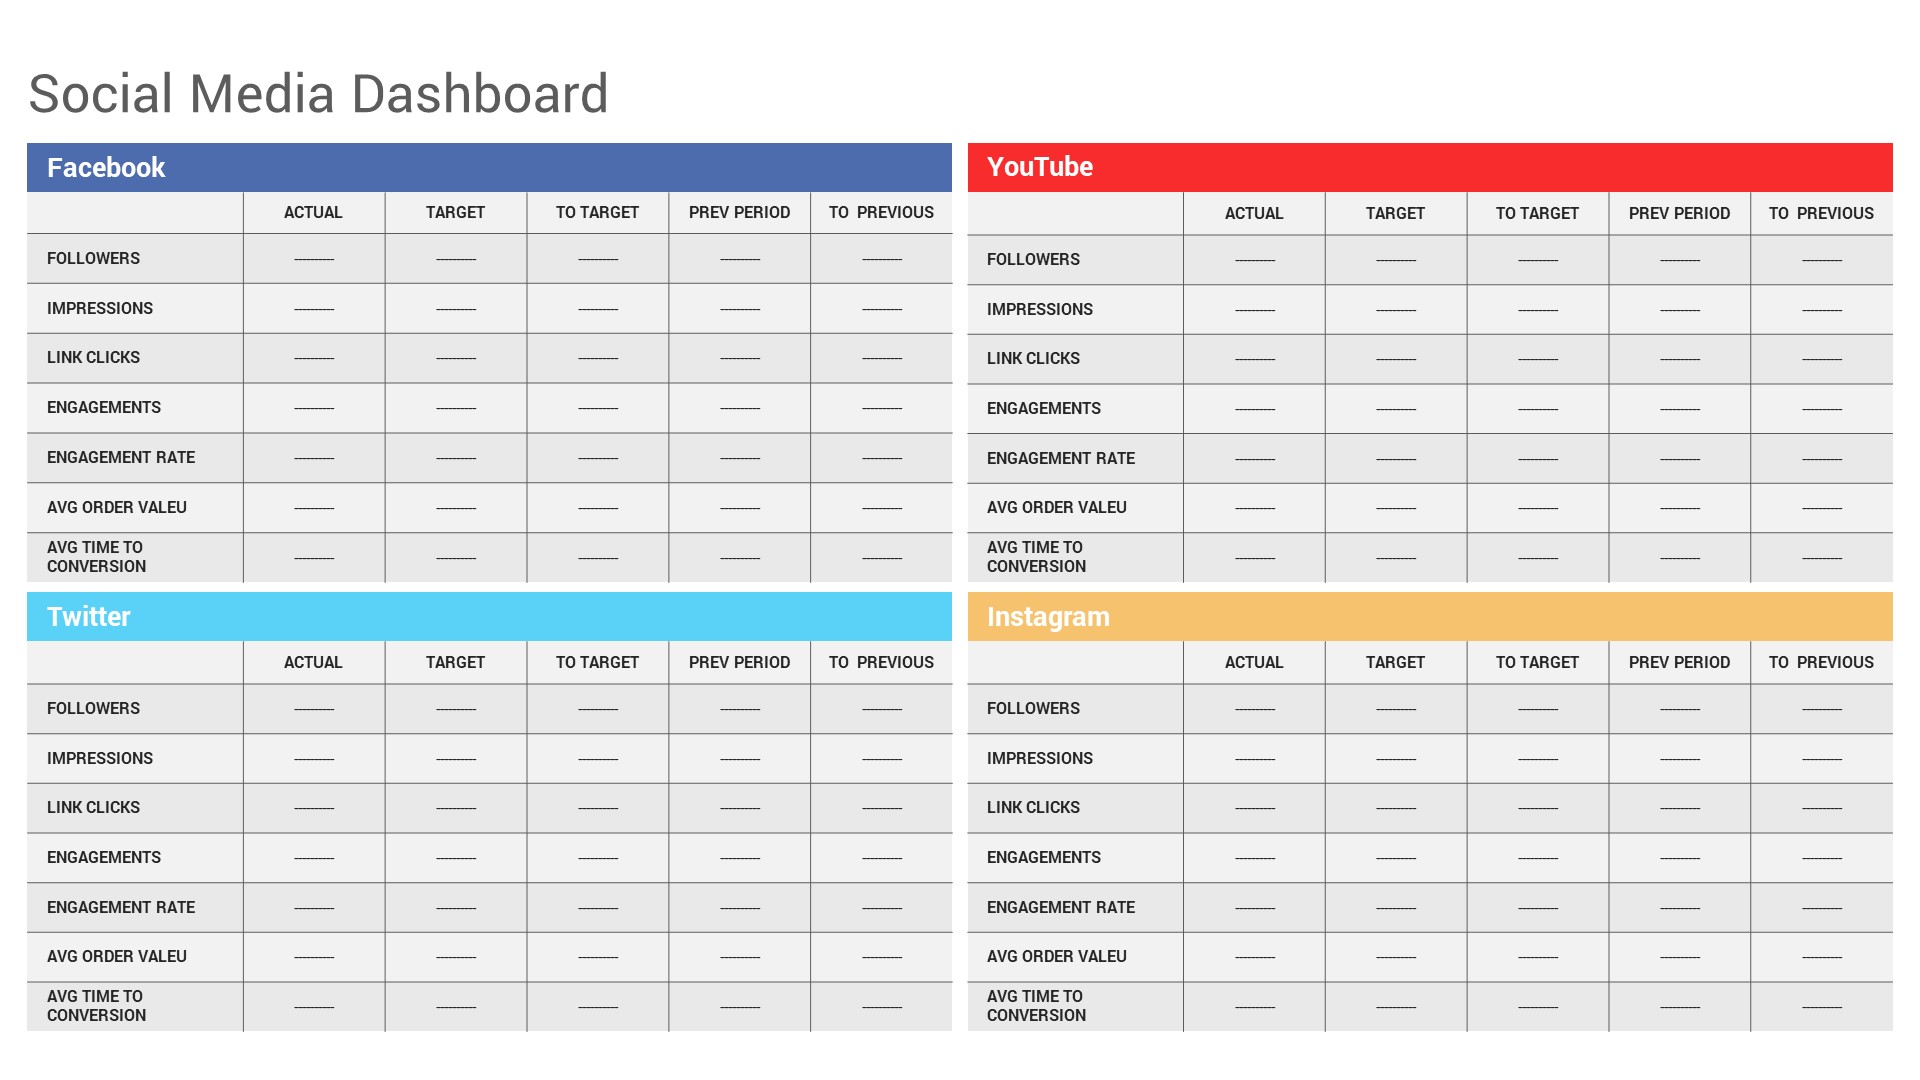
- Social Media Dashboard
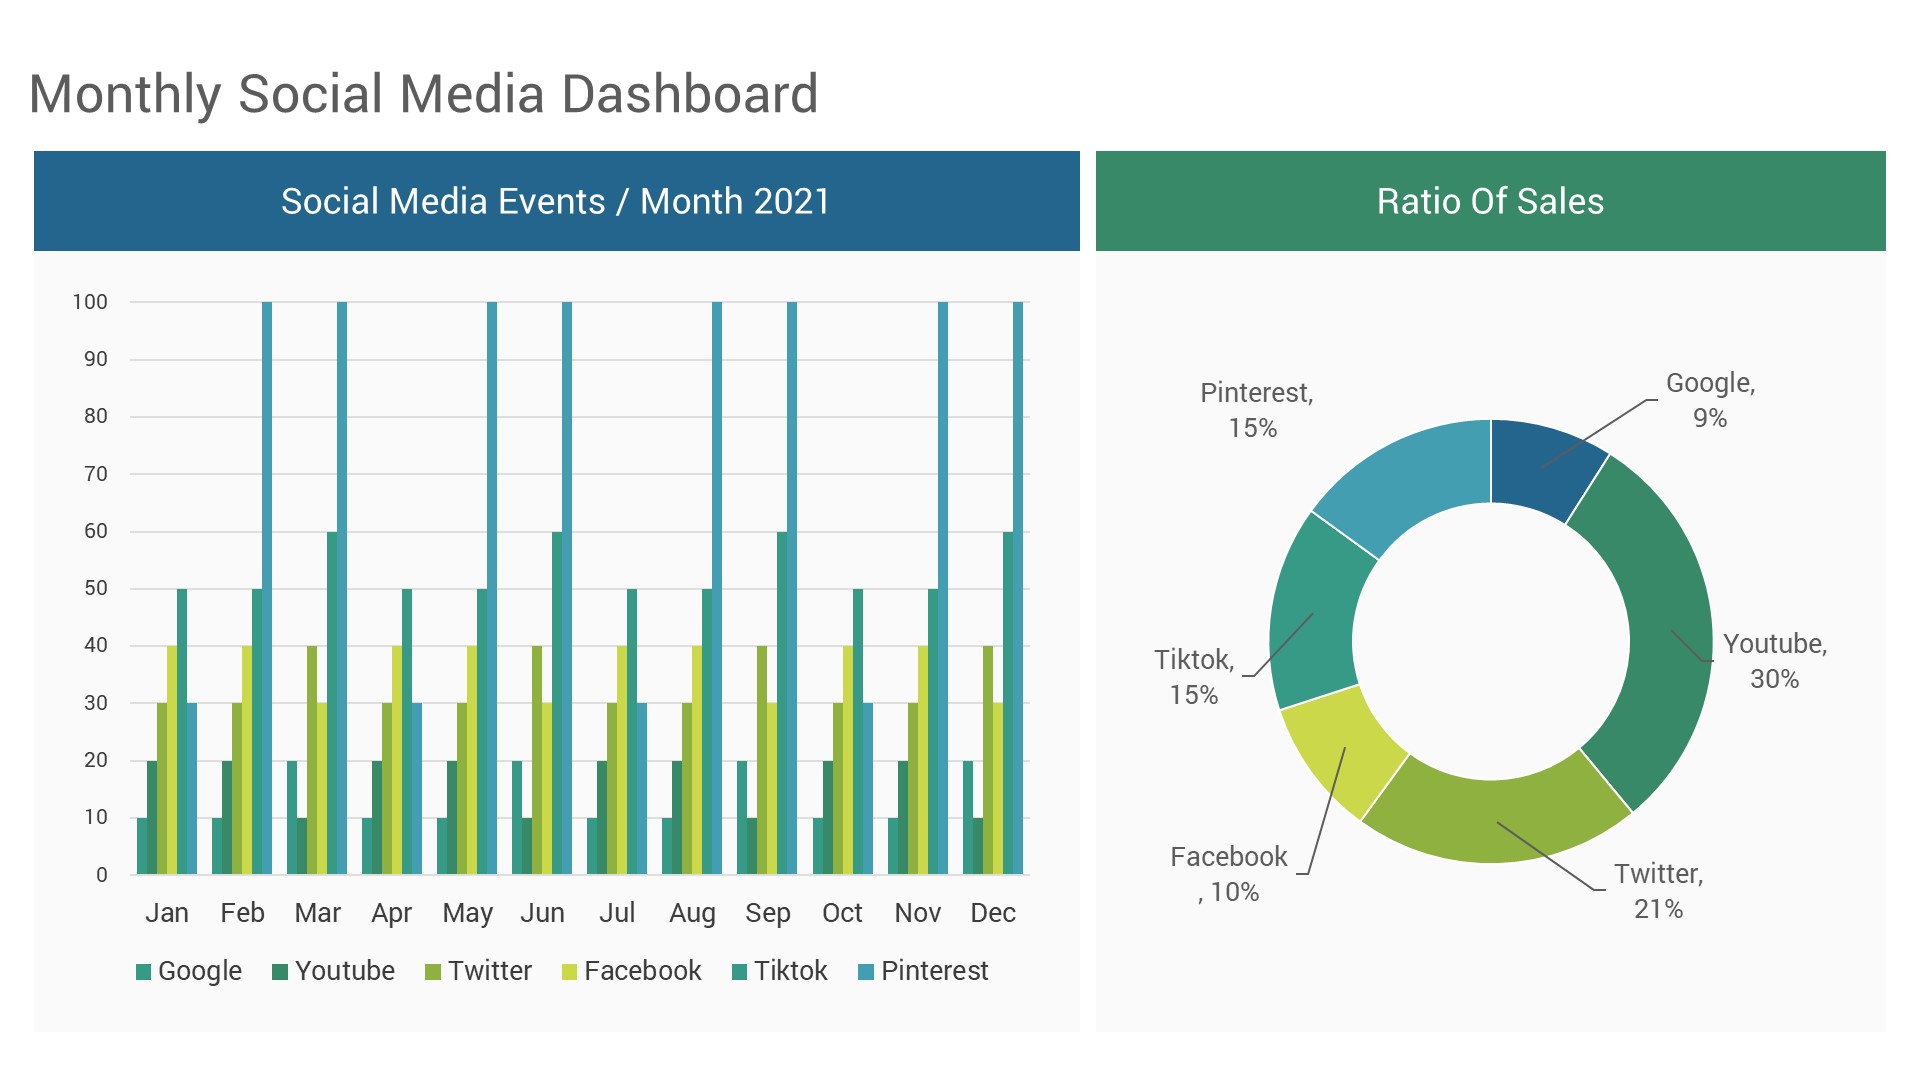
- Monthly Social Media Dashboard
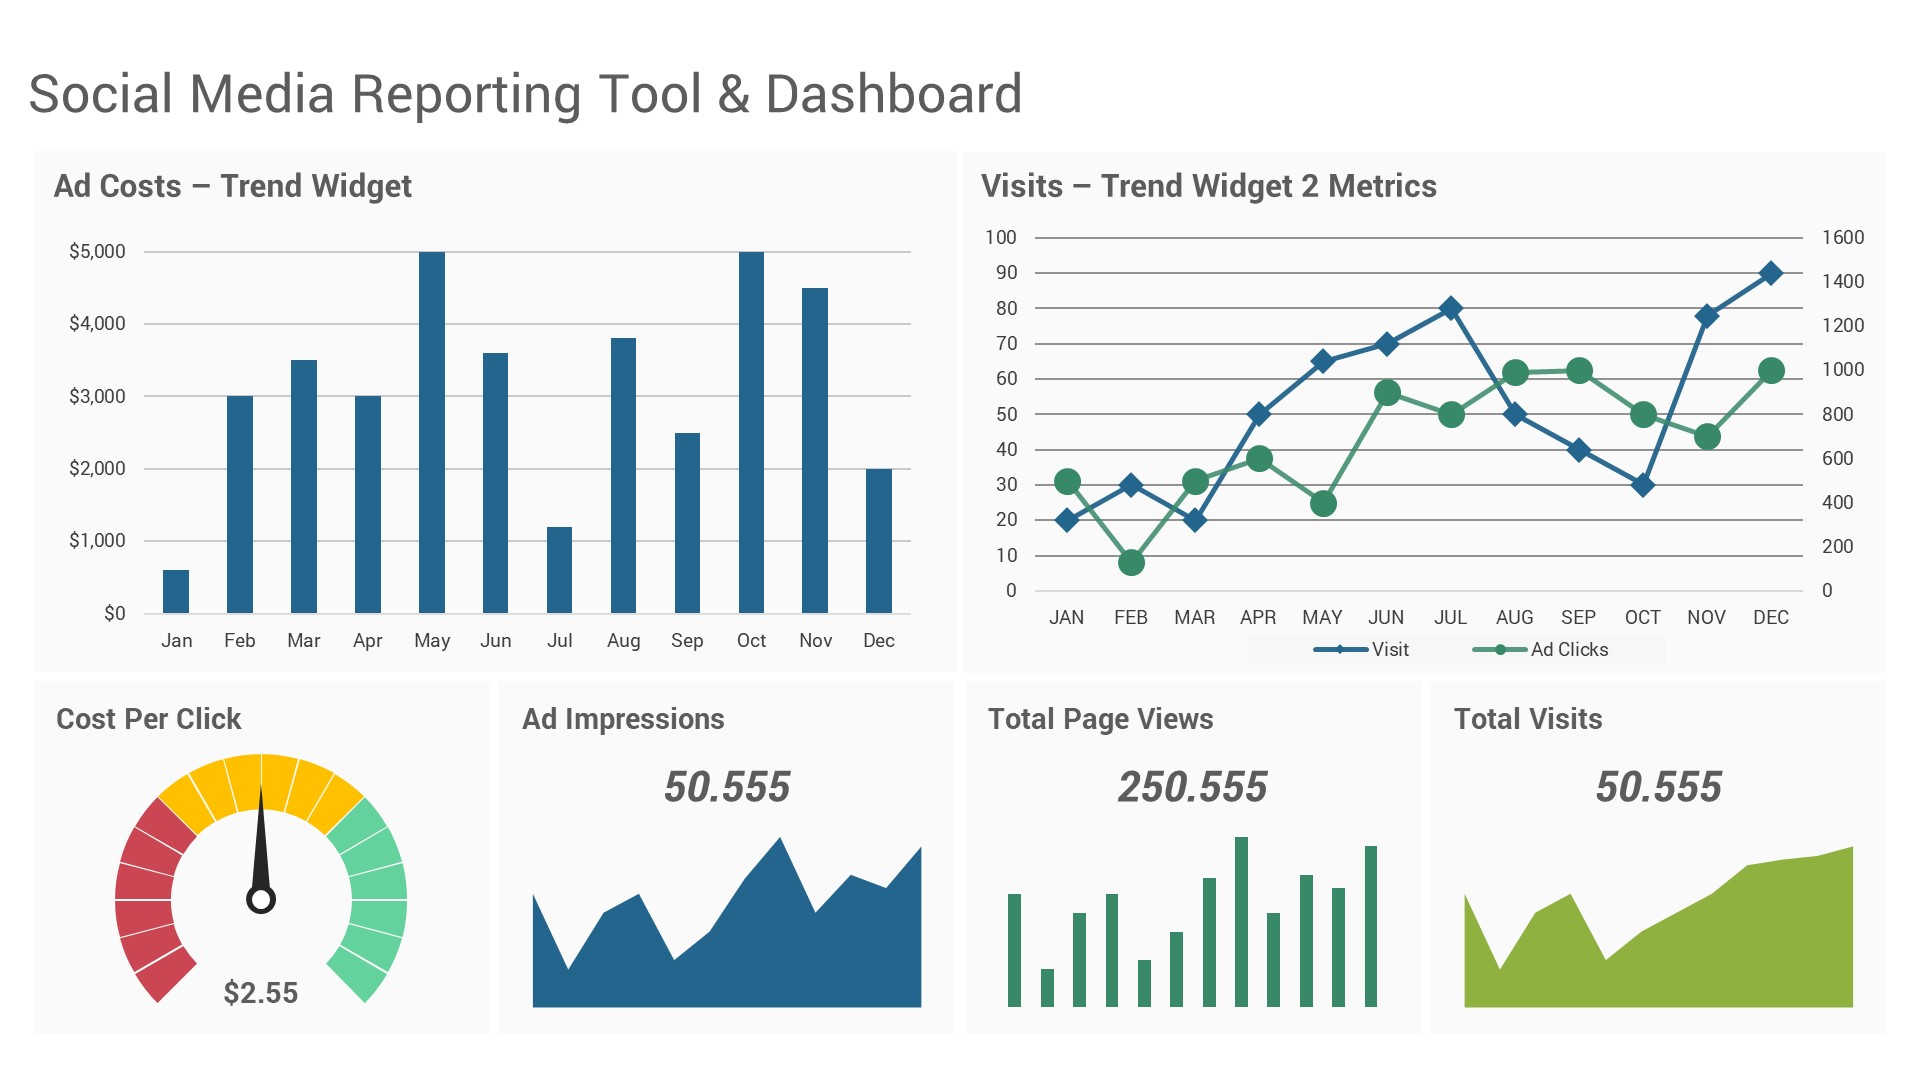
- Social Media Reporting Tool and Dashboard
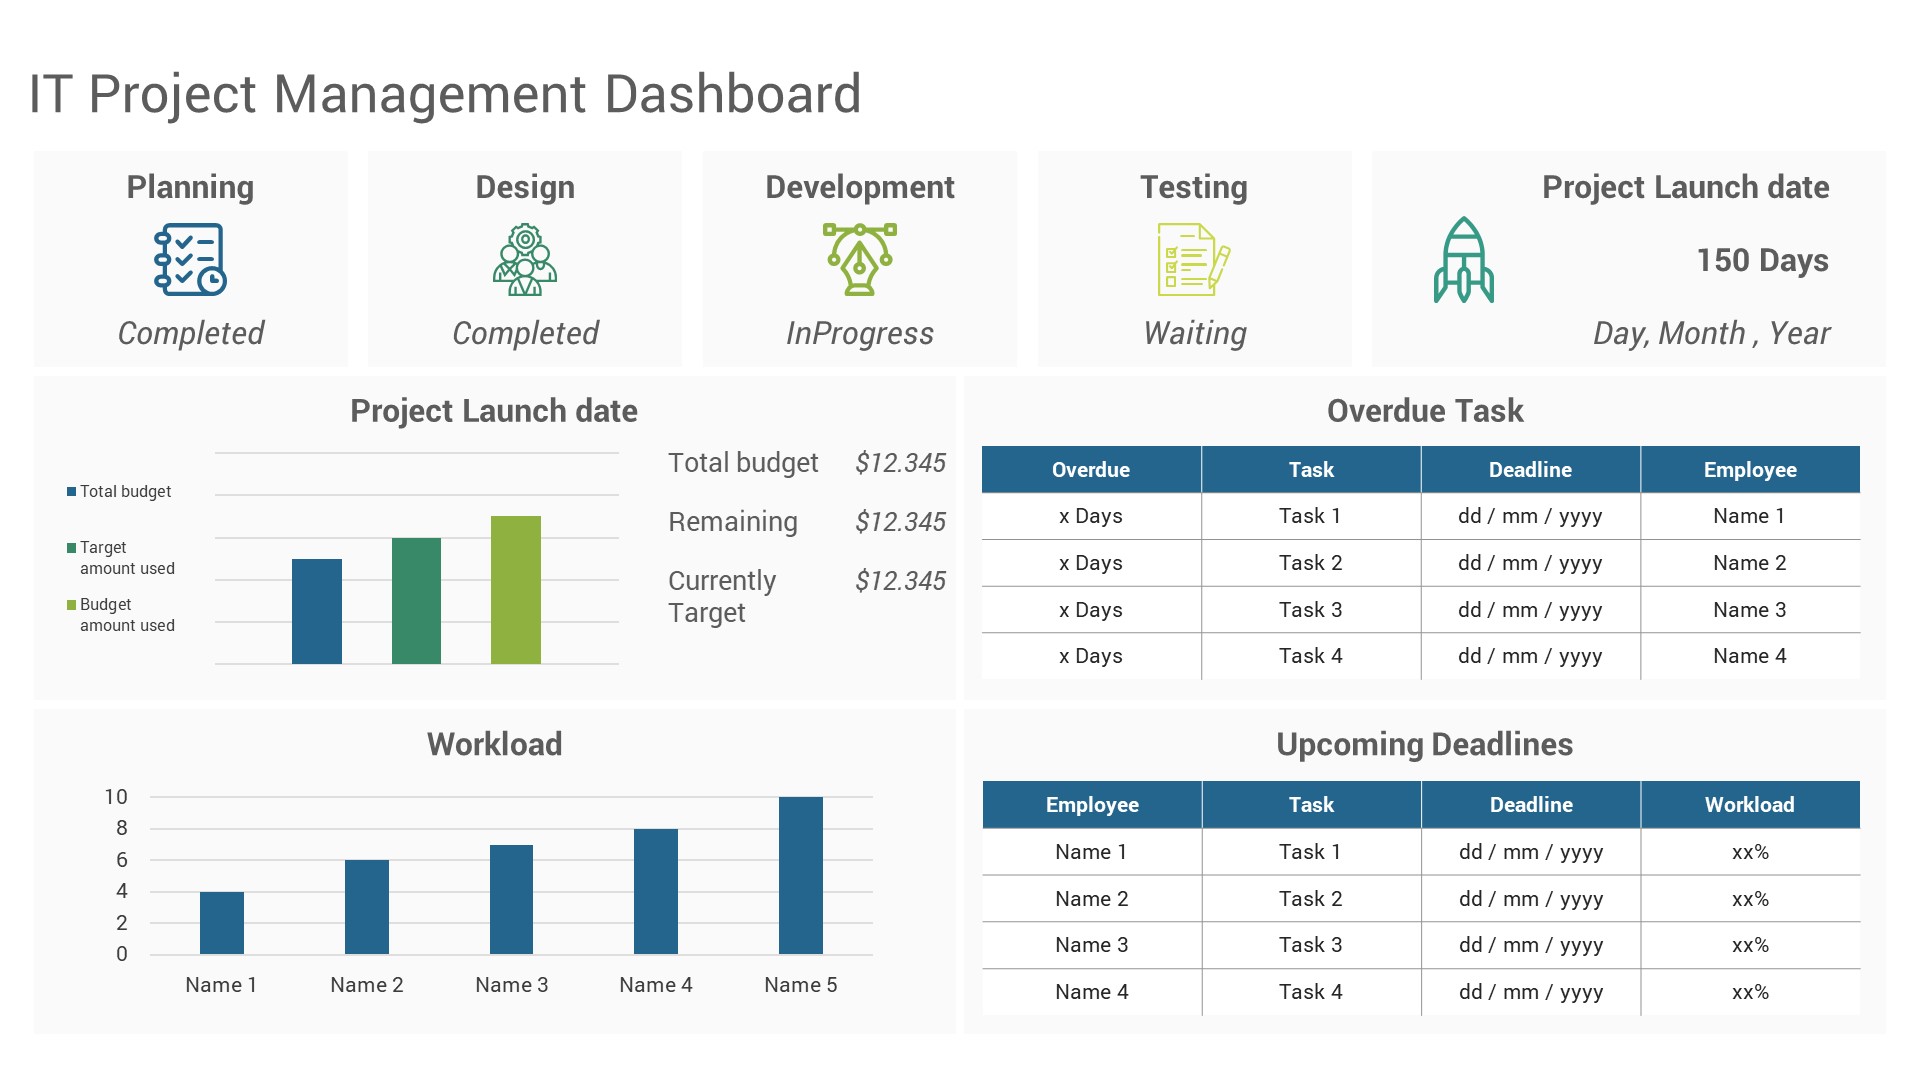
- IT Project Management Dashboard
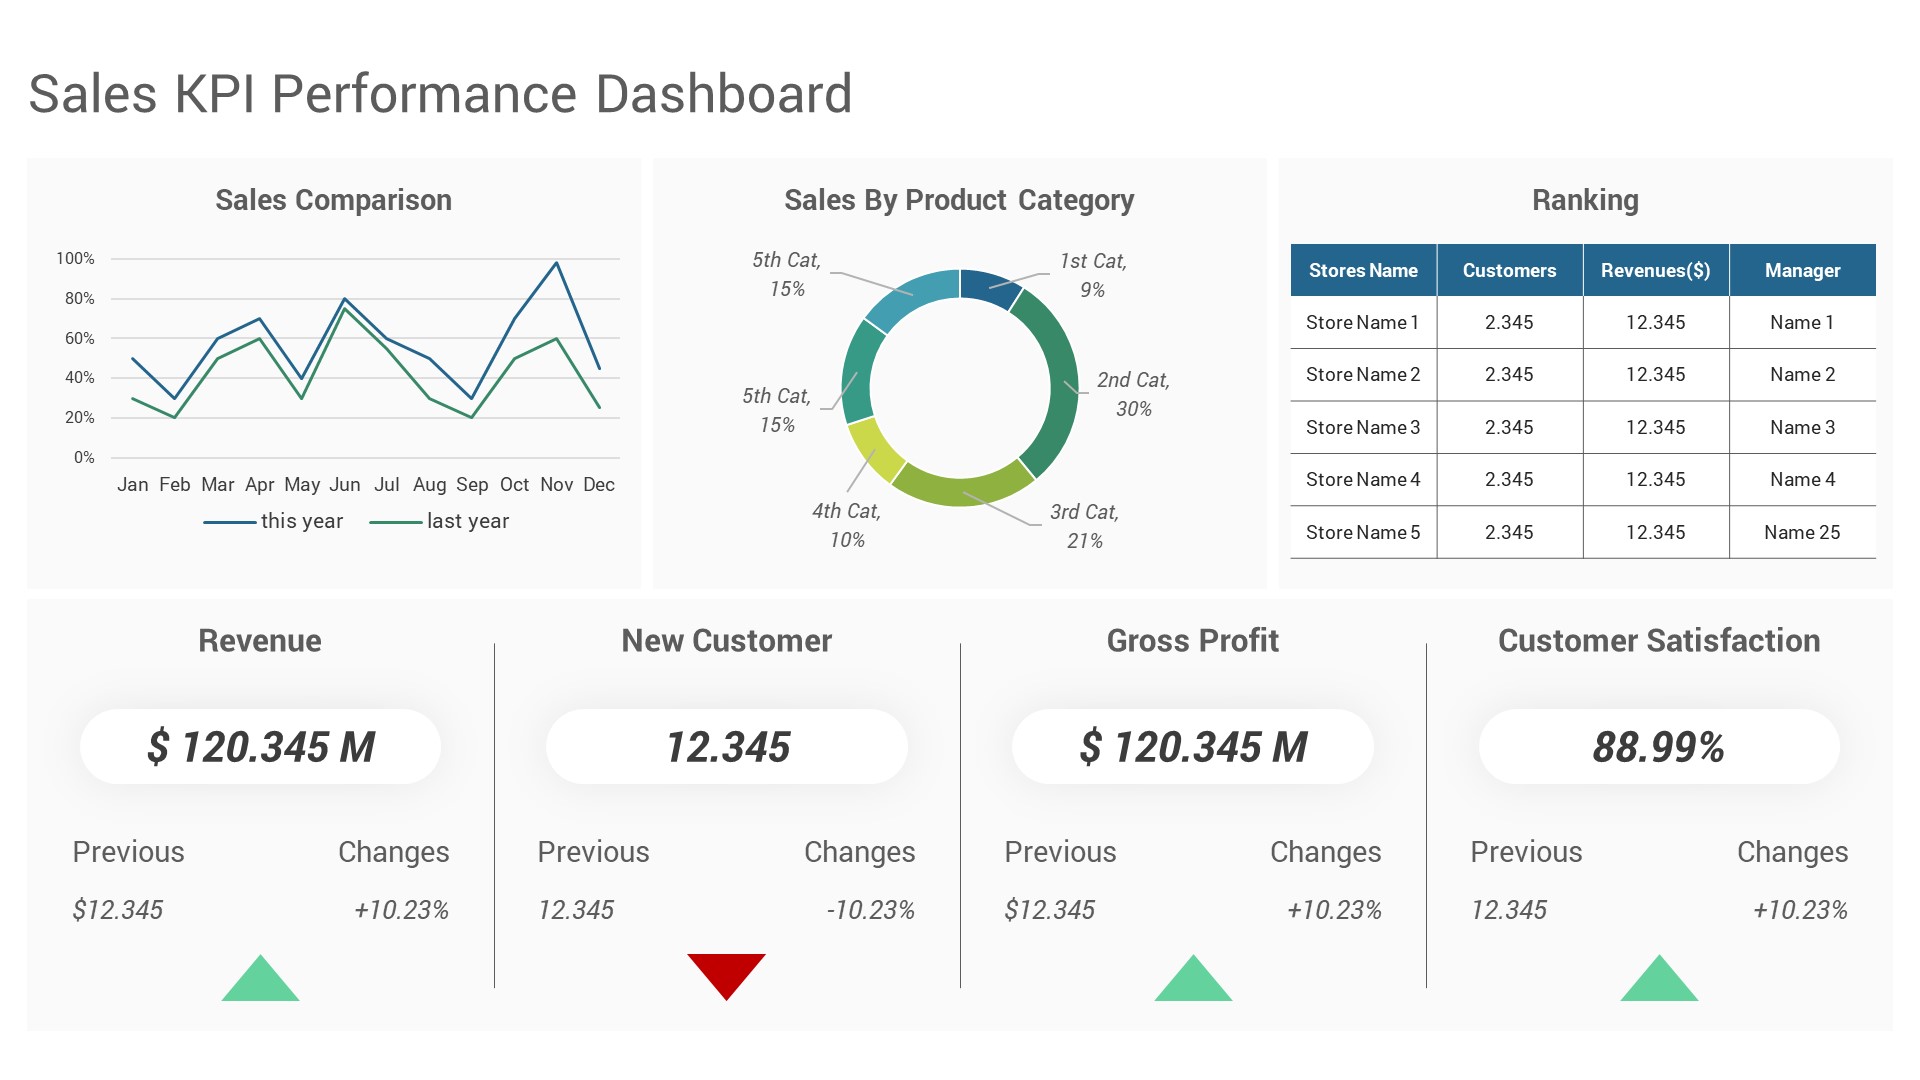
- Sales KPI Performance Dashboard
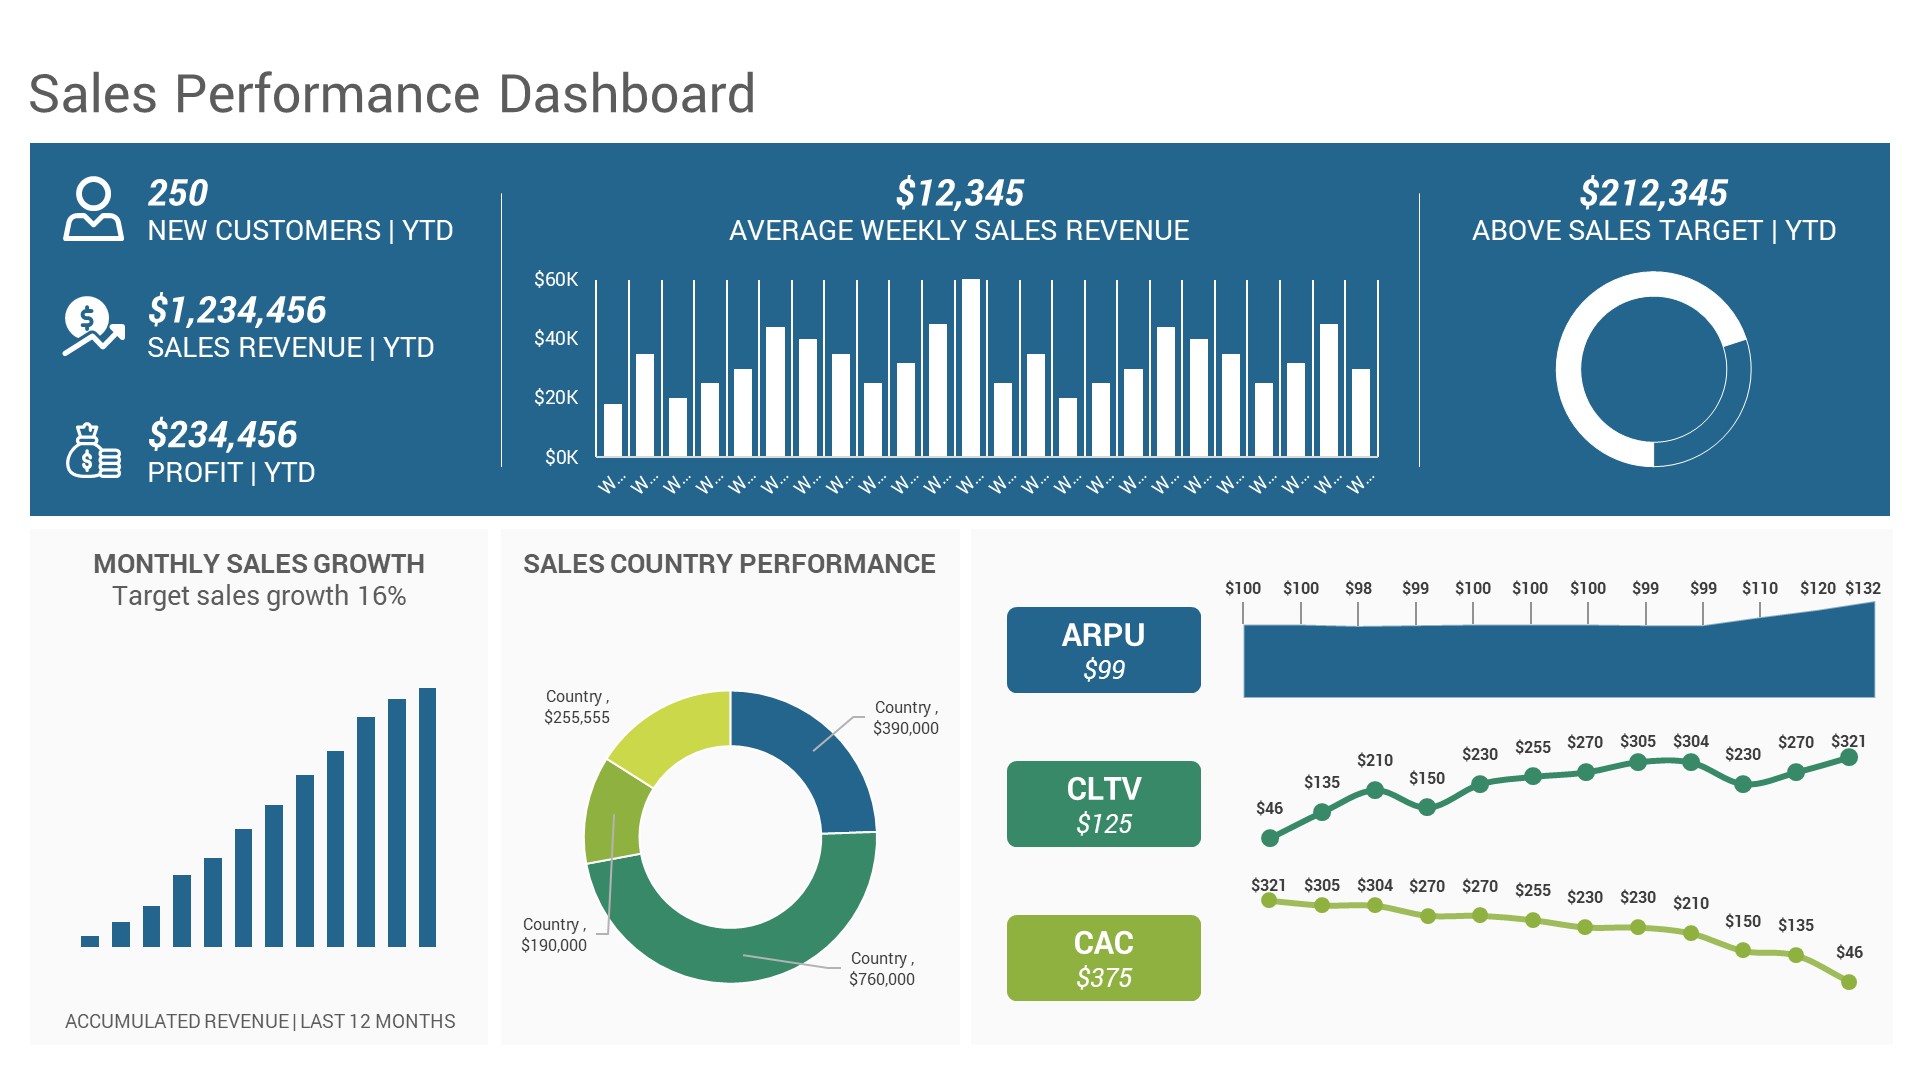
- Sales Performance Dashboard
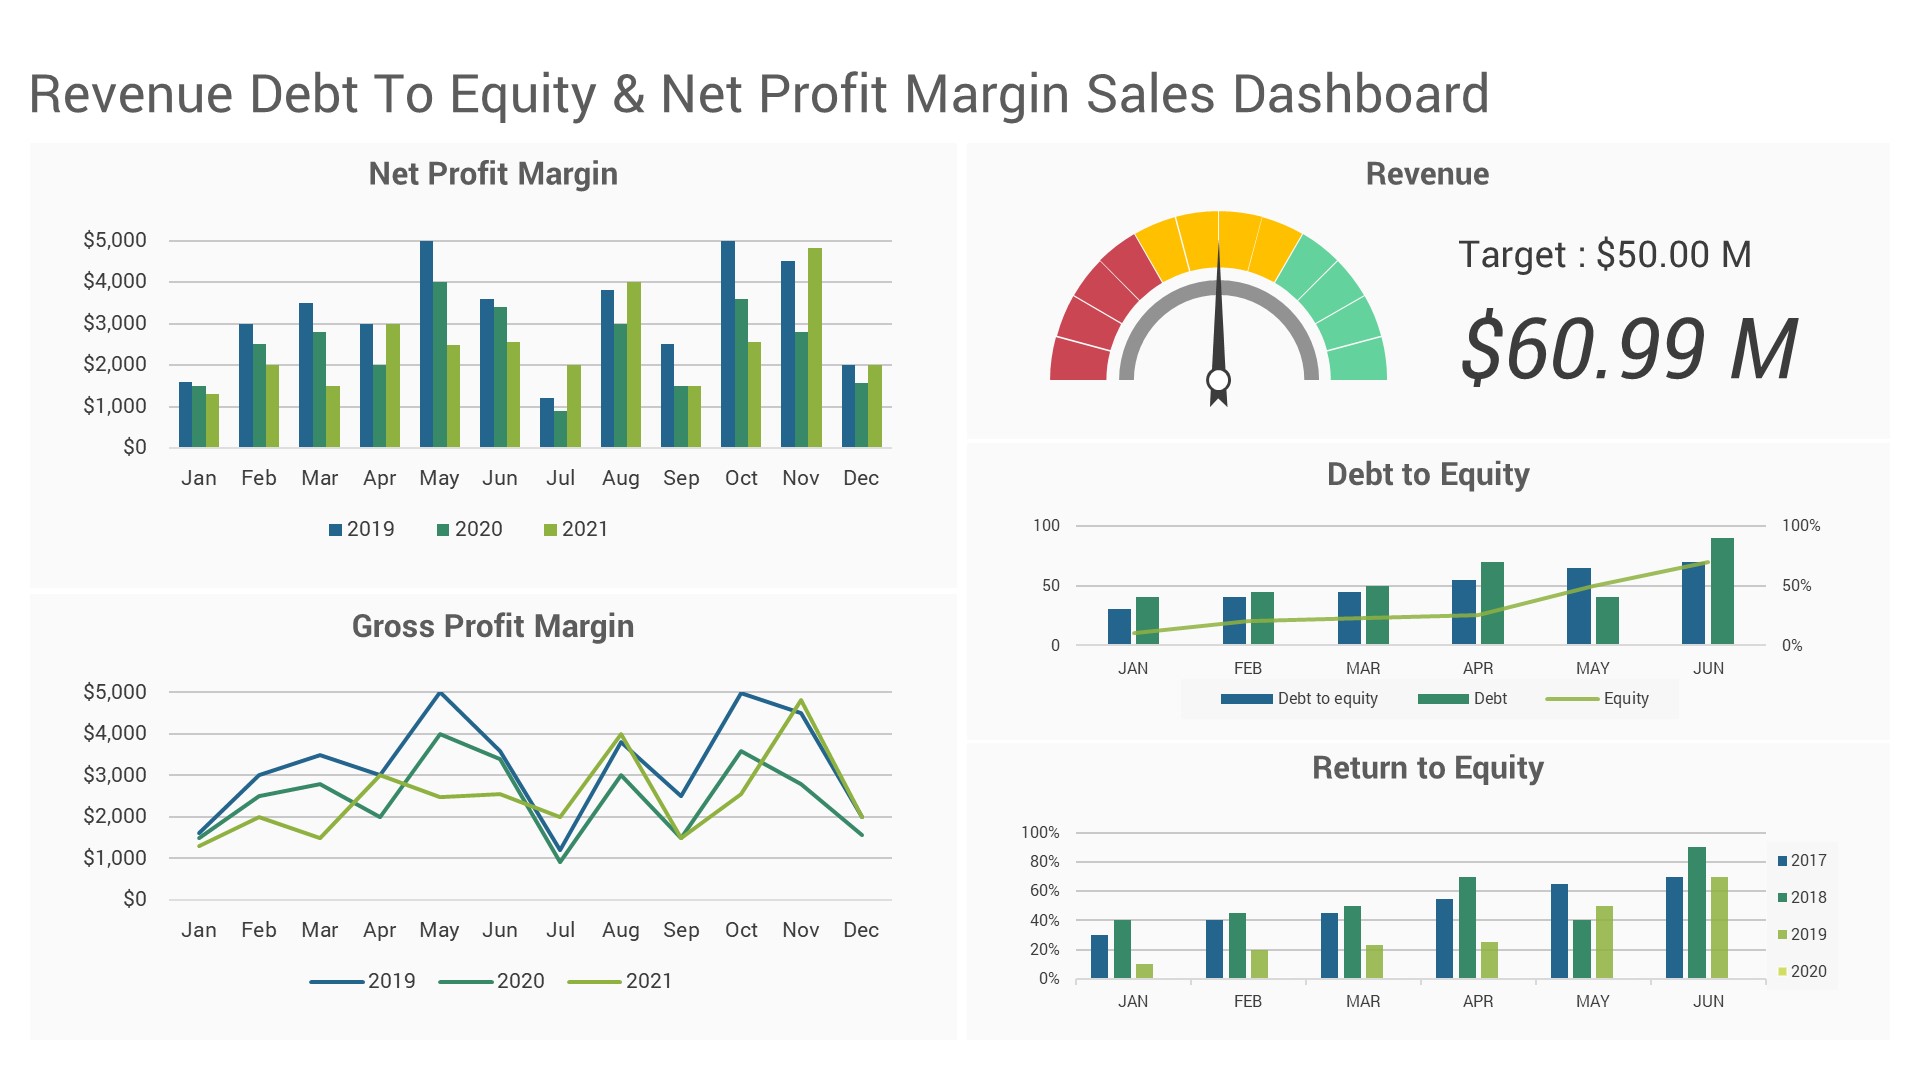
- Revenue Debt to Equity and Net Profit Margin Sales Dashboard
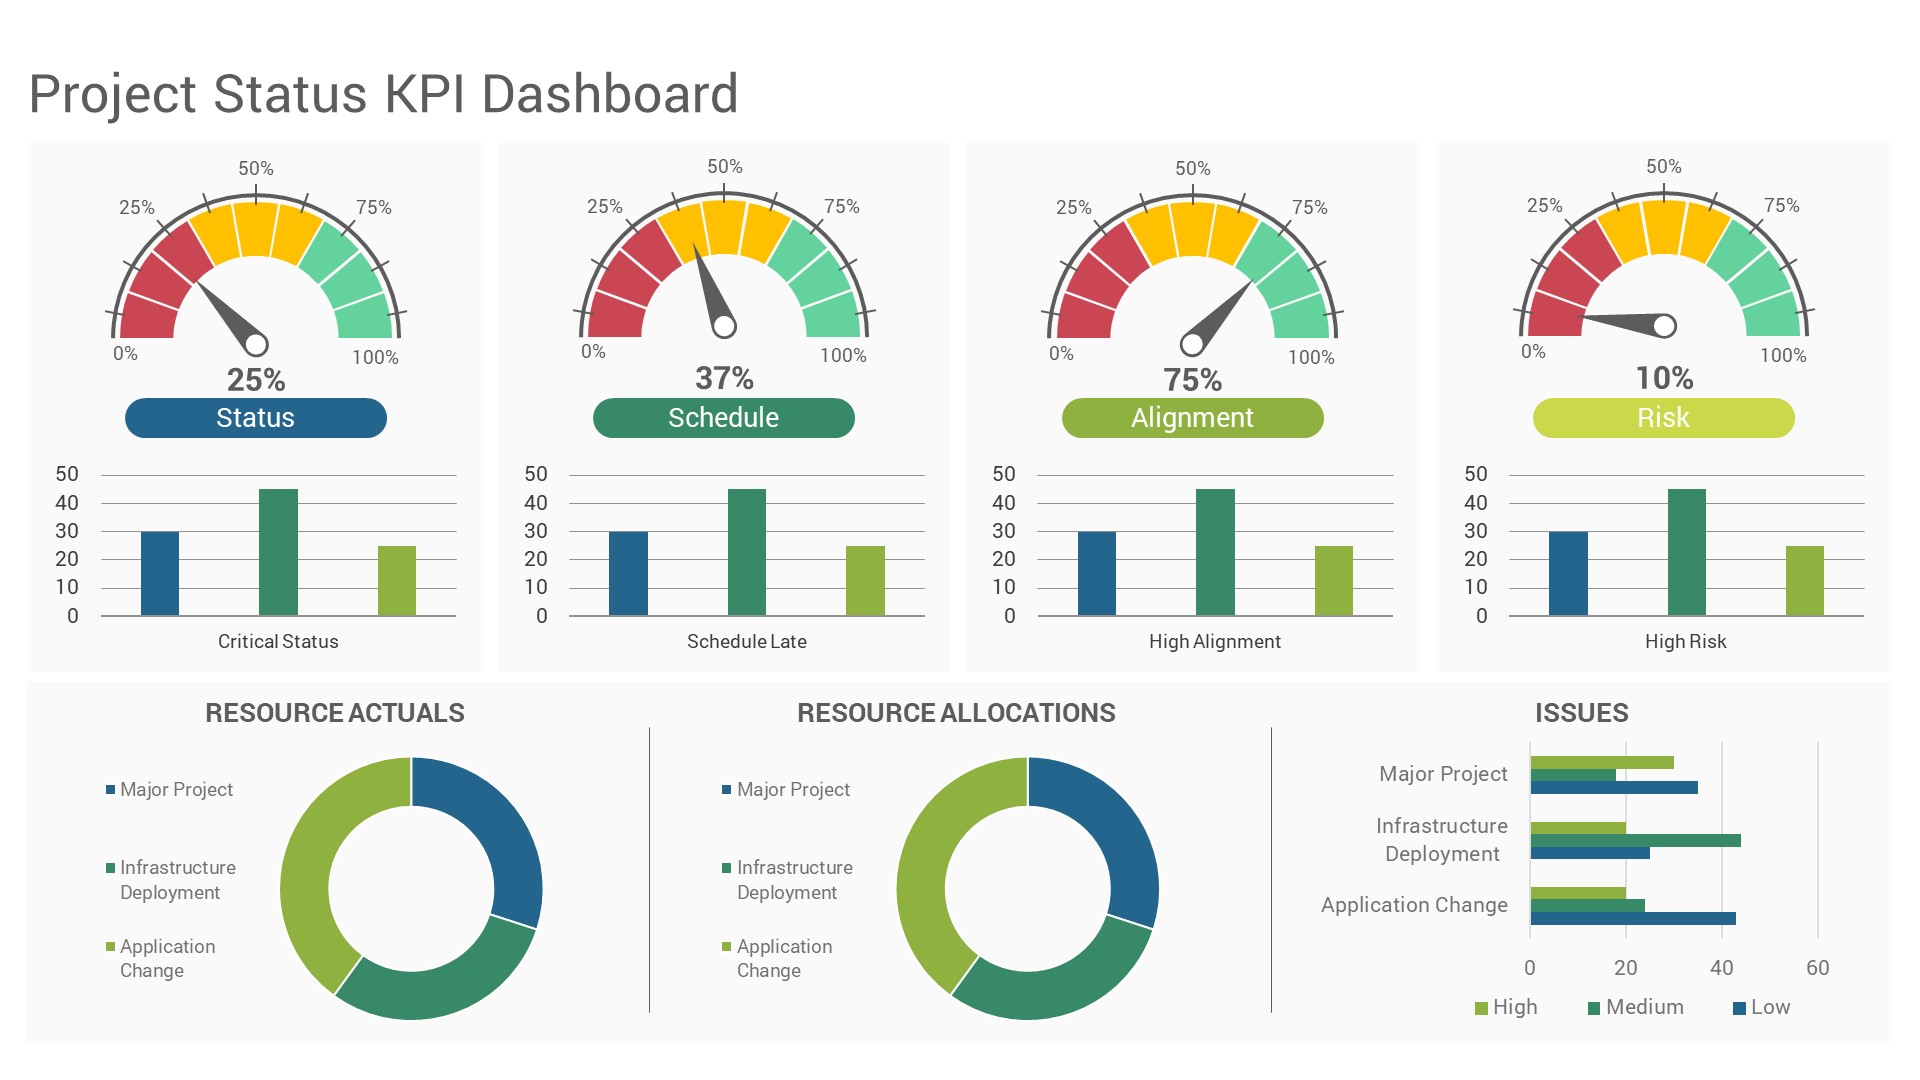
- Project Status KPI Dashboard
- Chief Marketing Officer (CMO) Dashboard
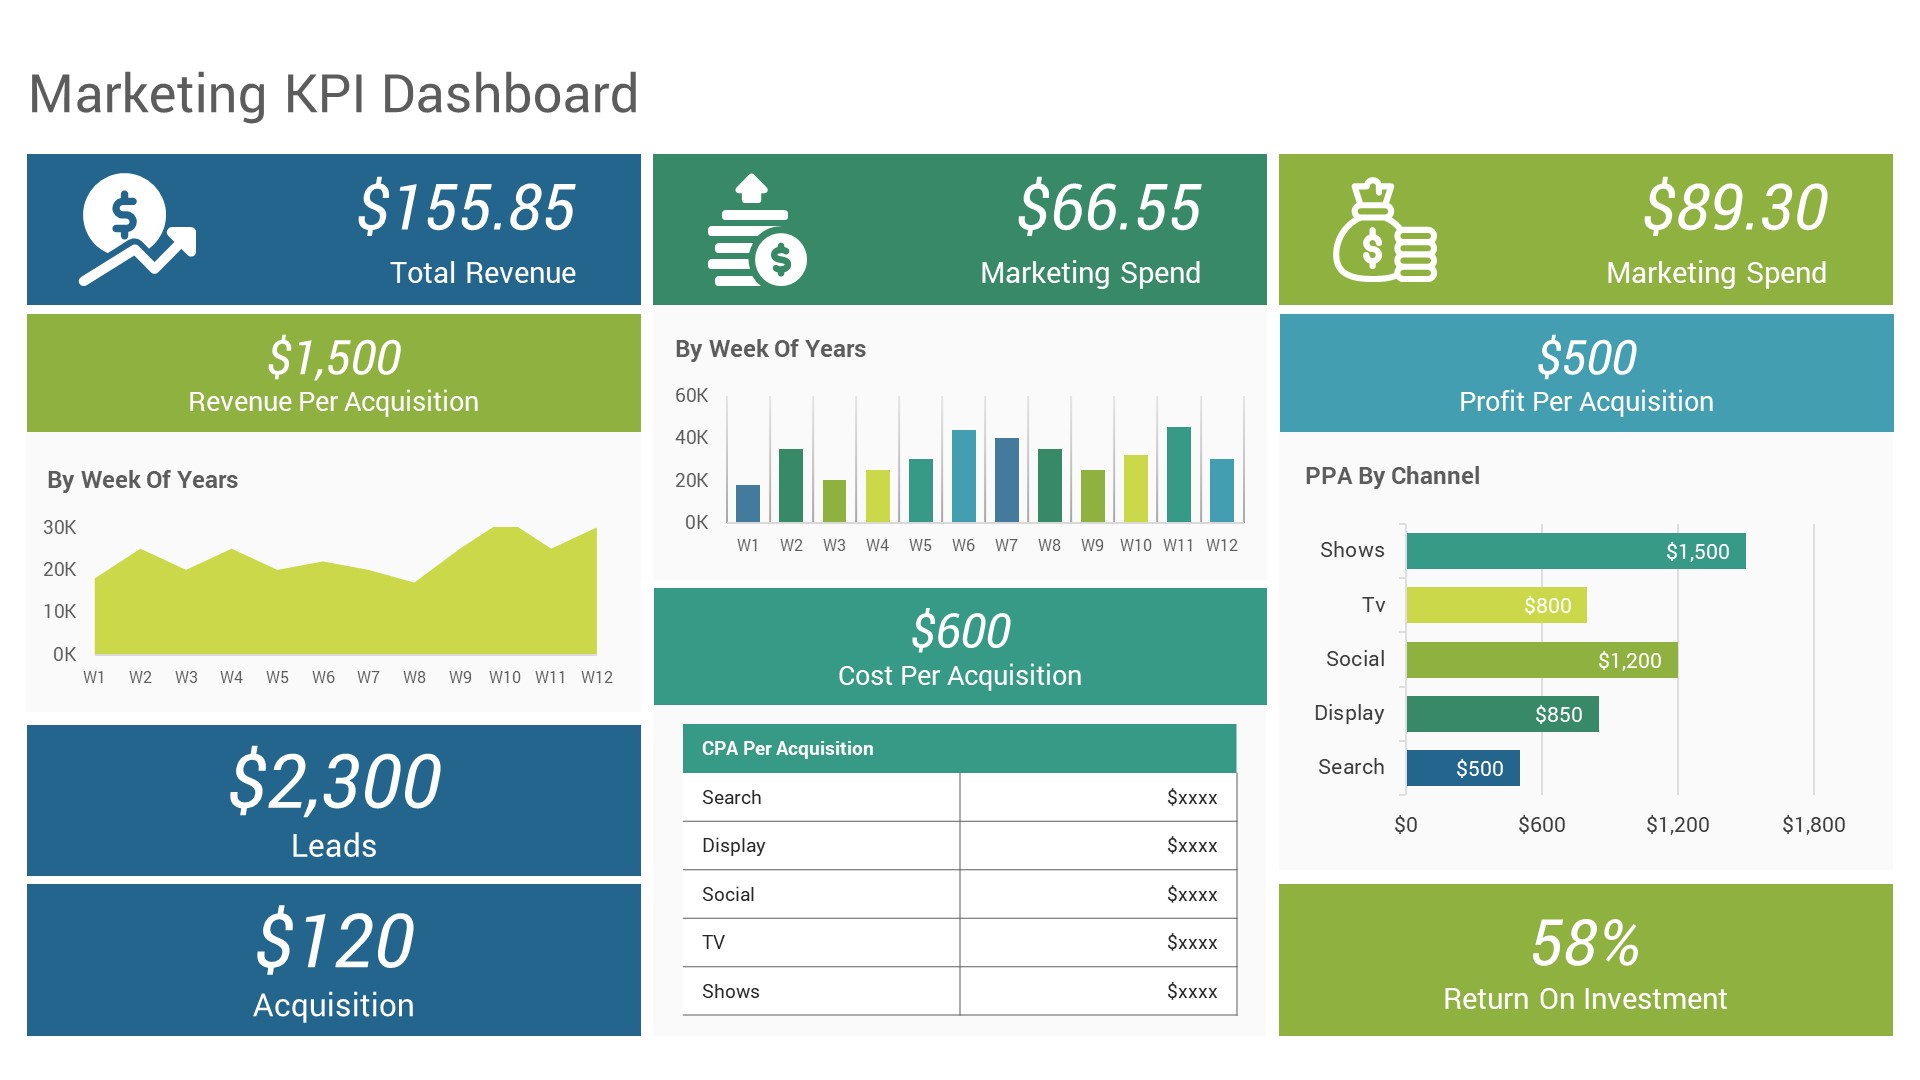
- Marketing KPI Dashboard
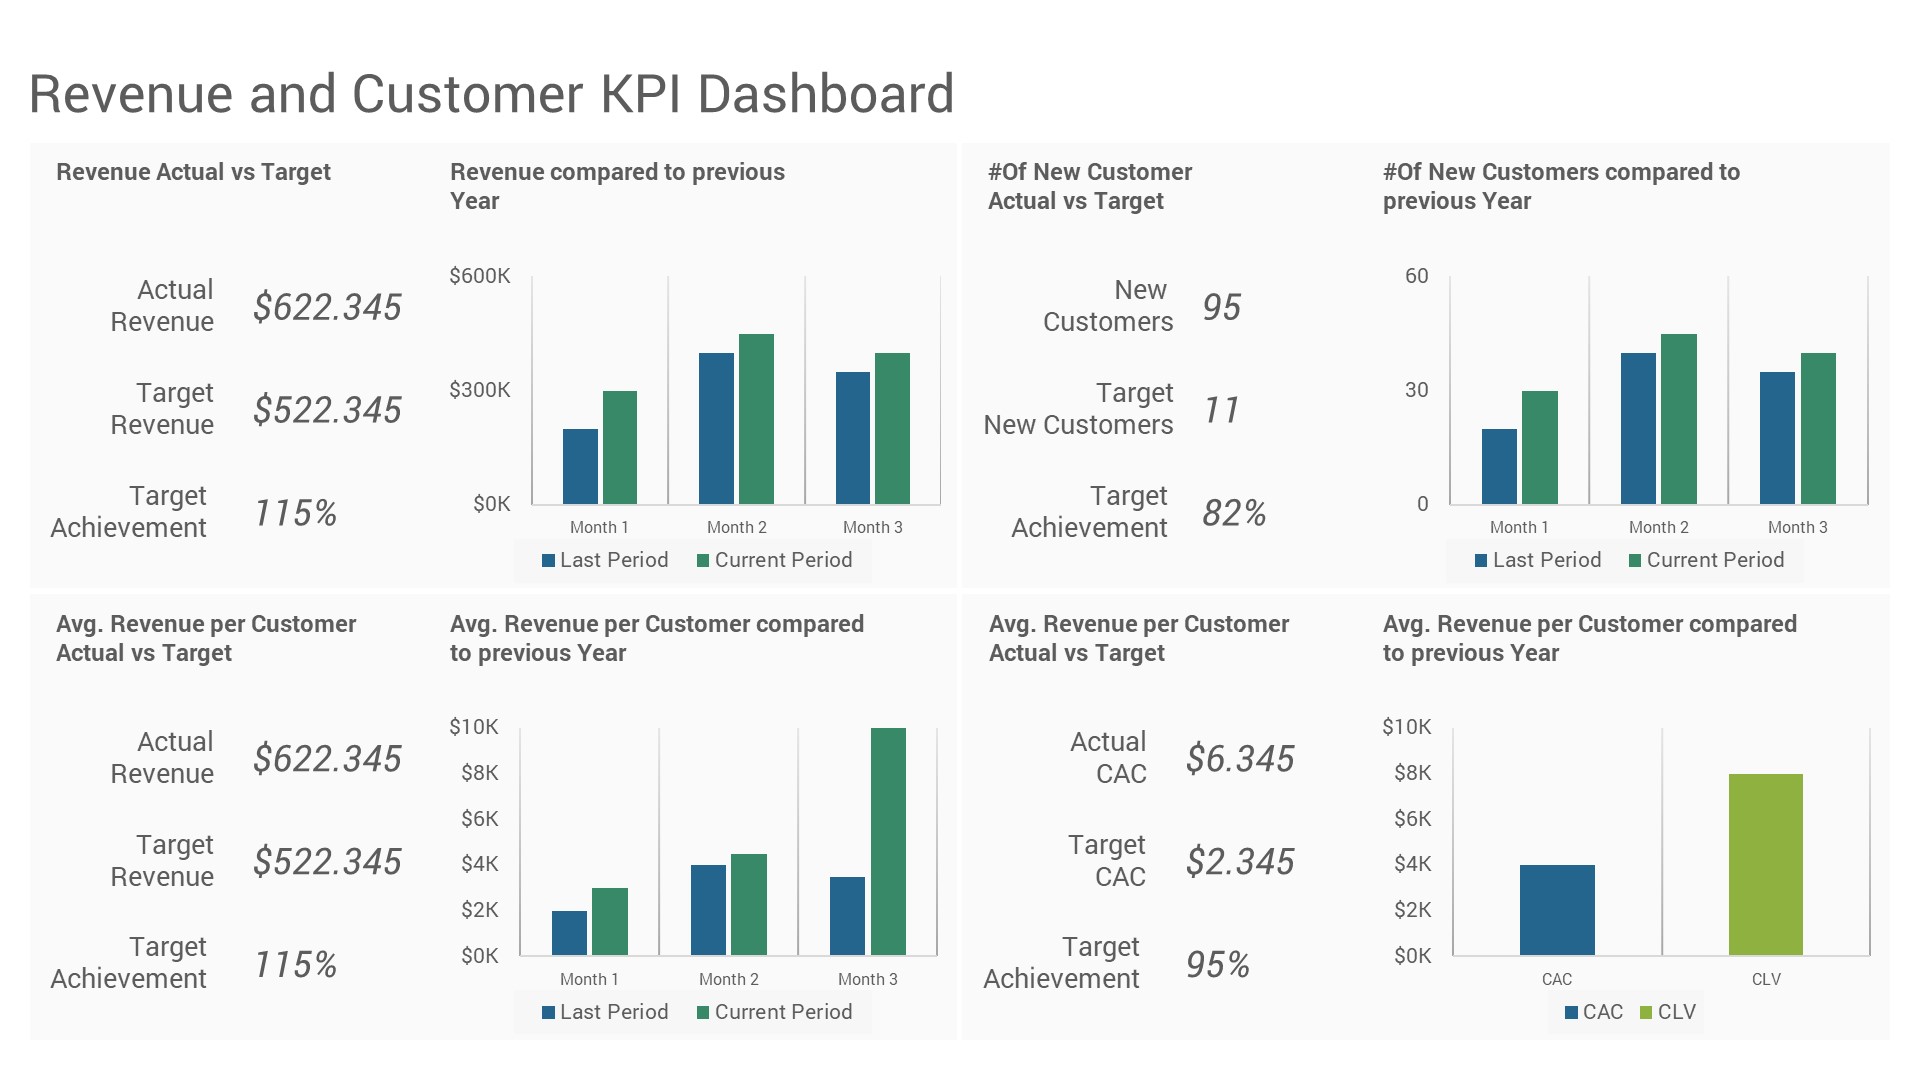
- Revenue and Customer KPI Dashboard
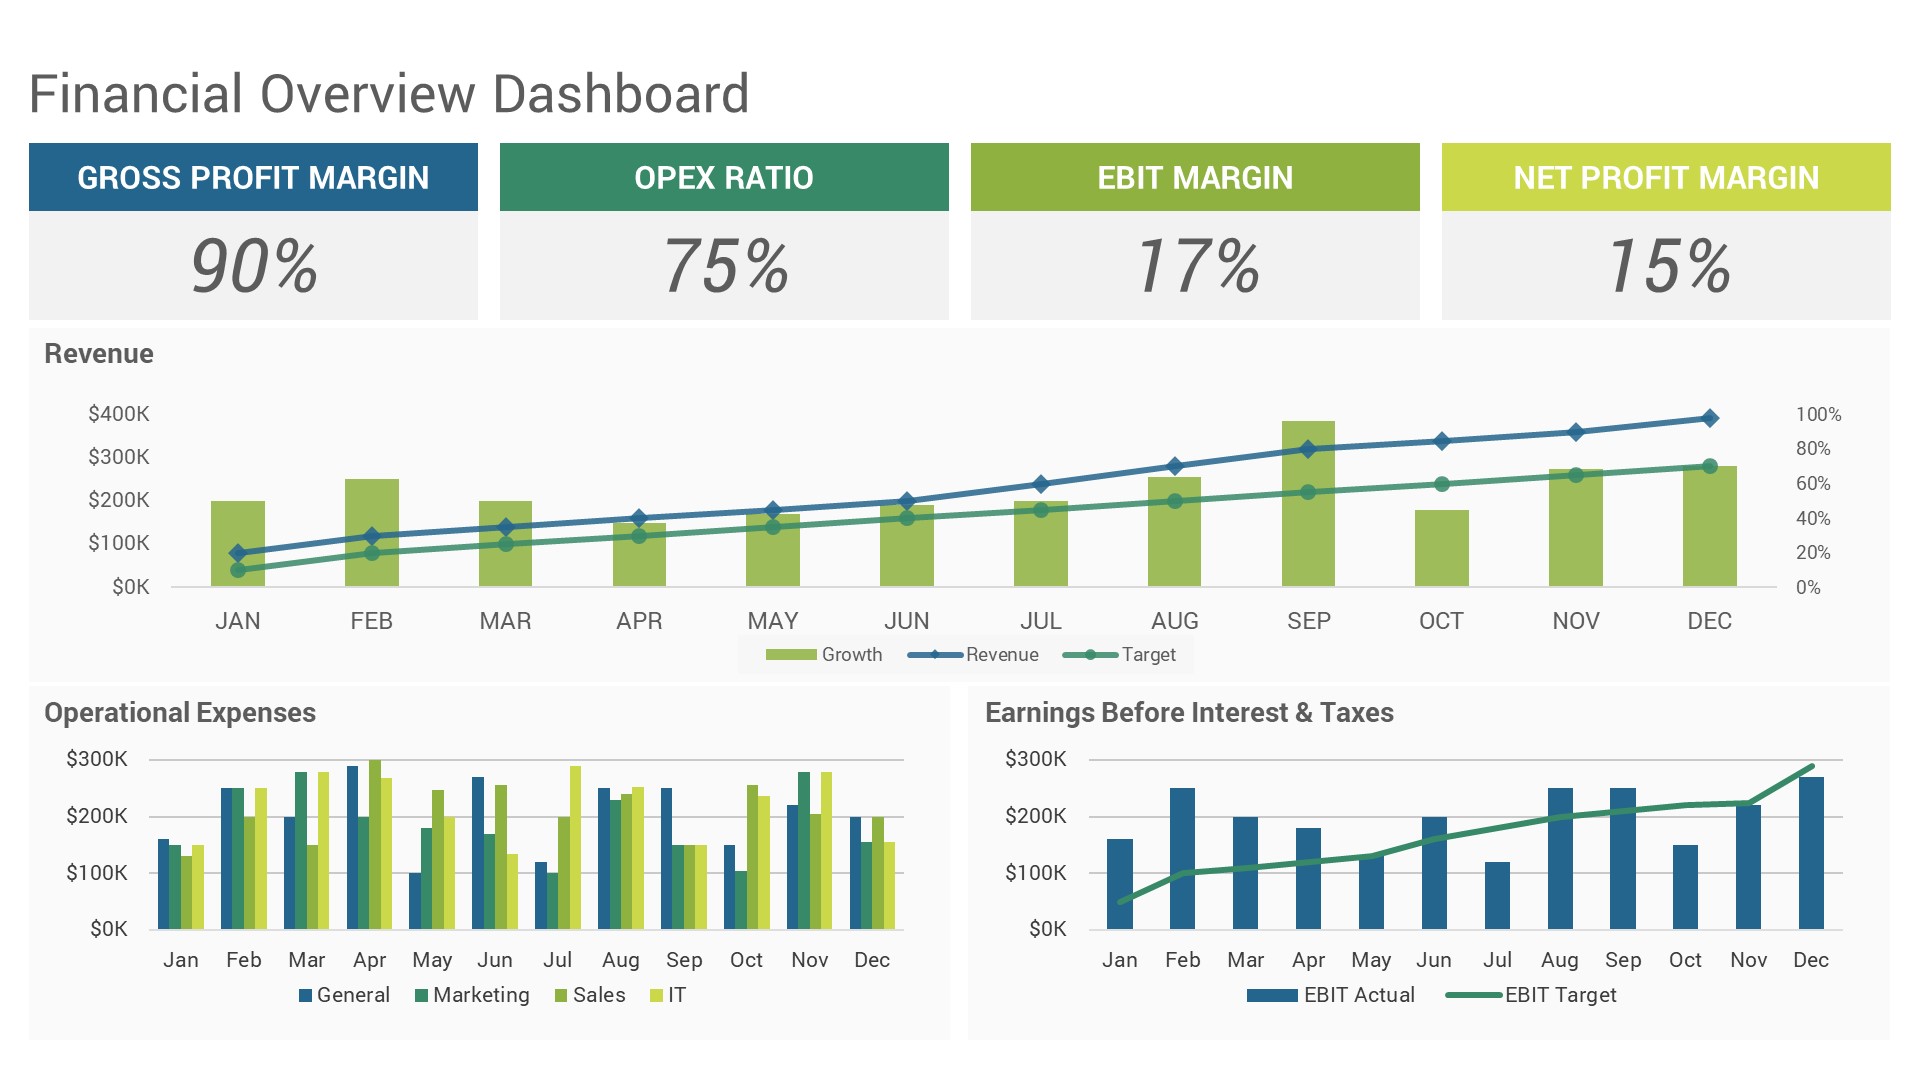
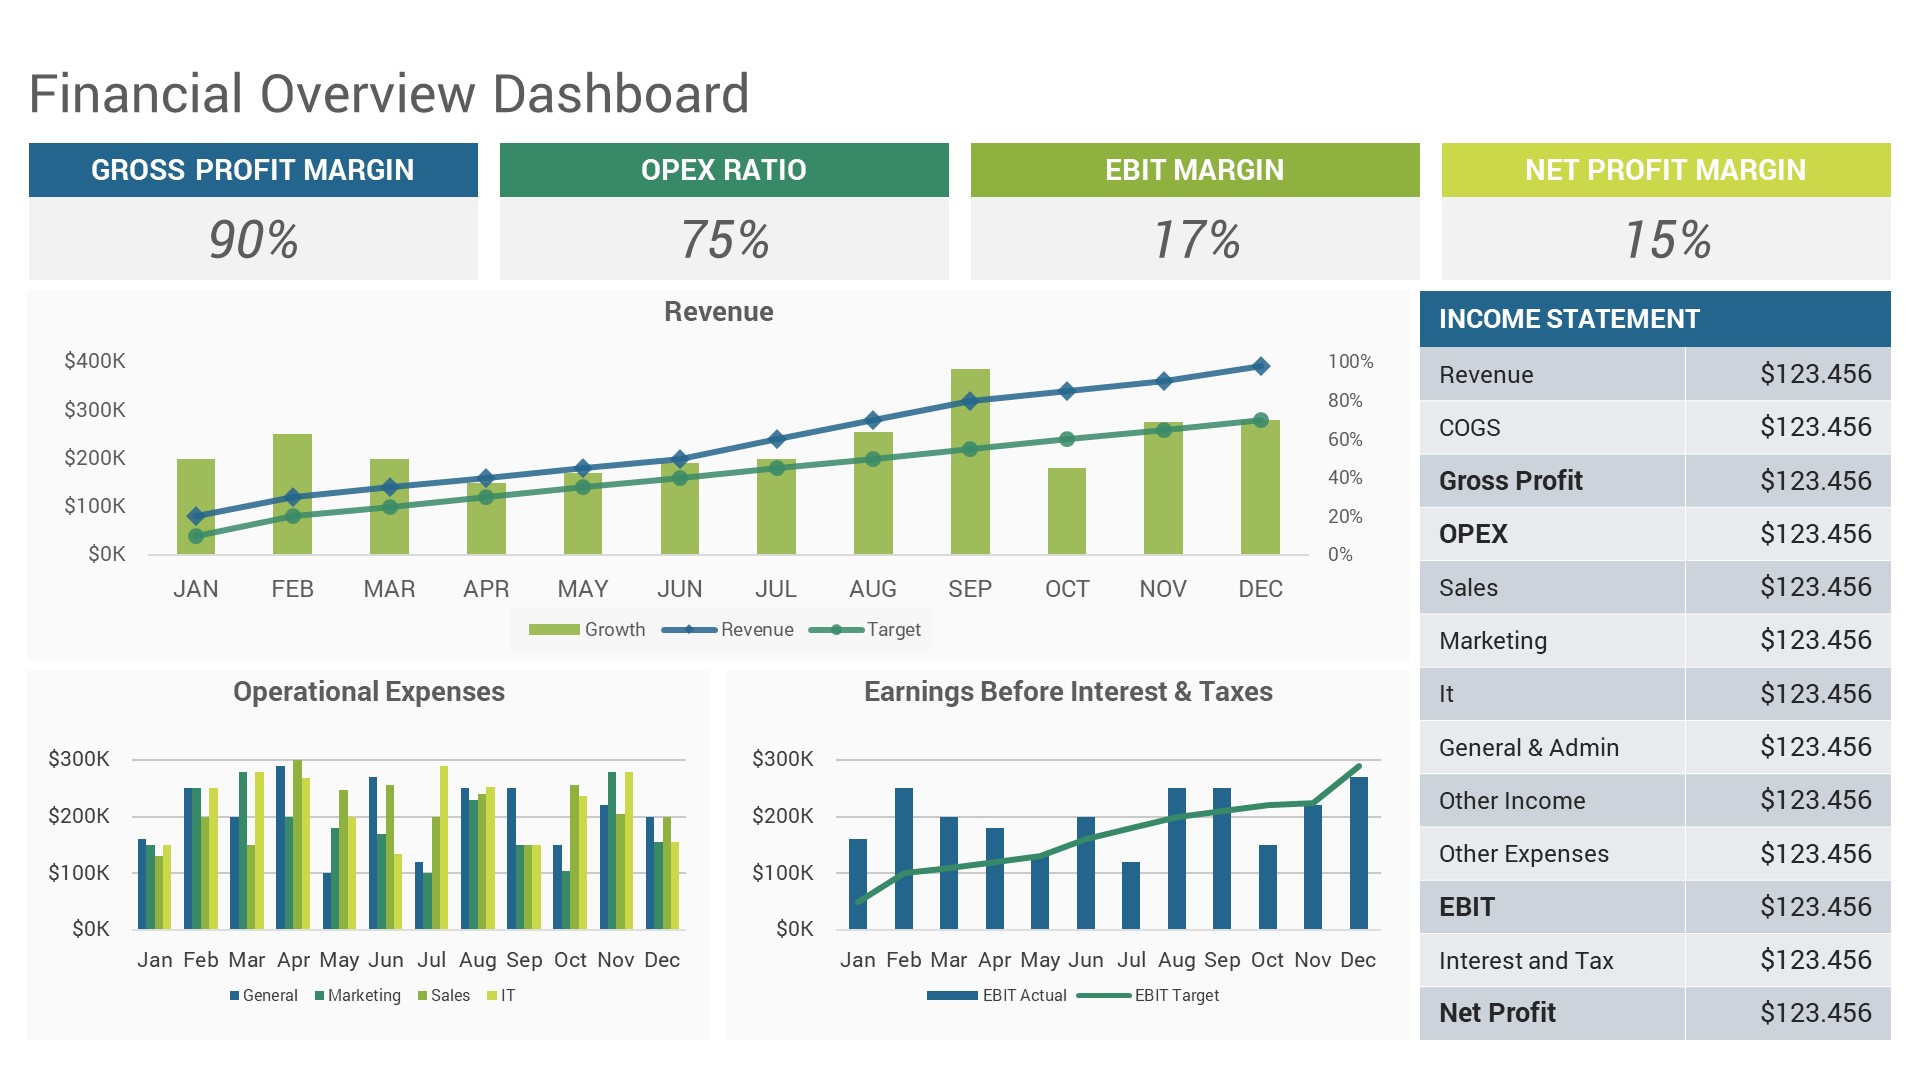
- Financial Overview Dashboard
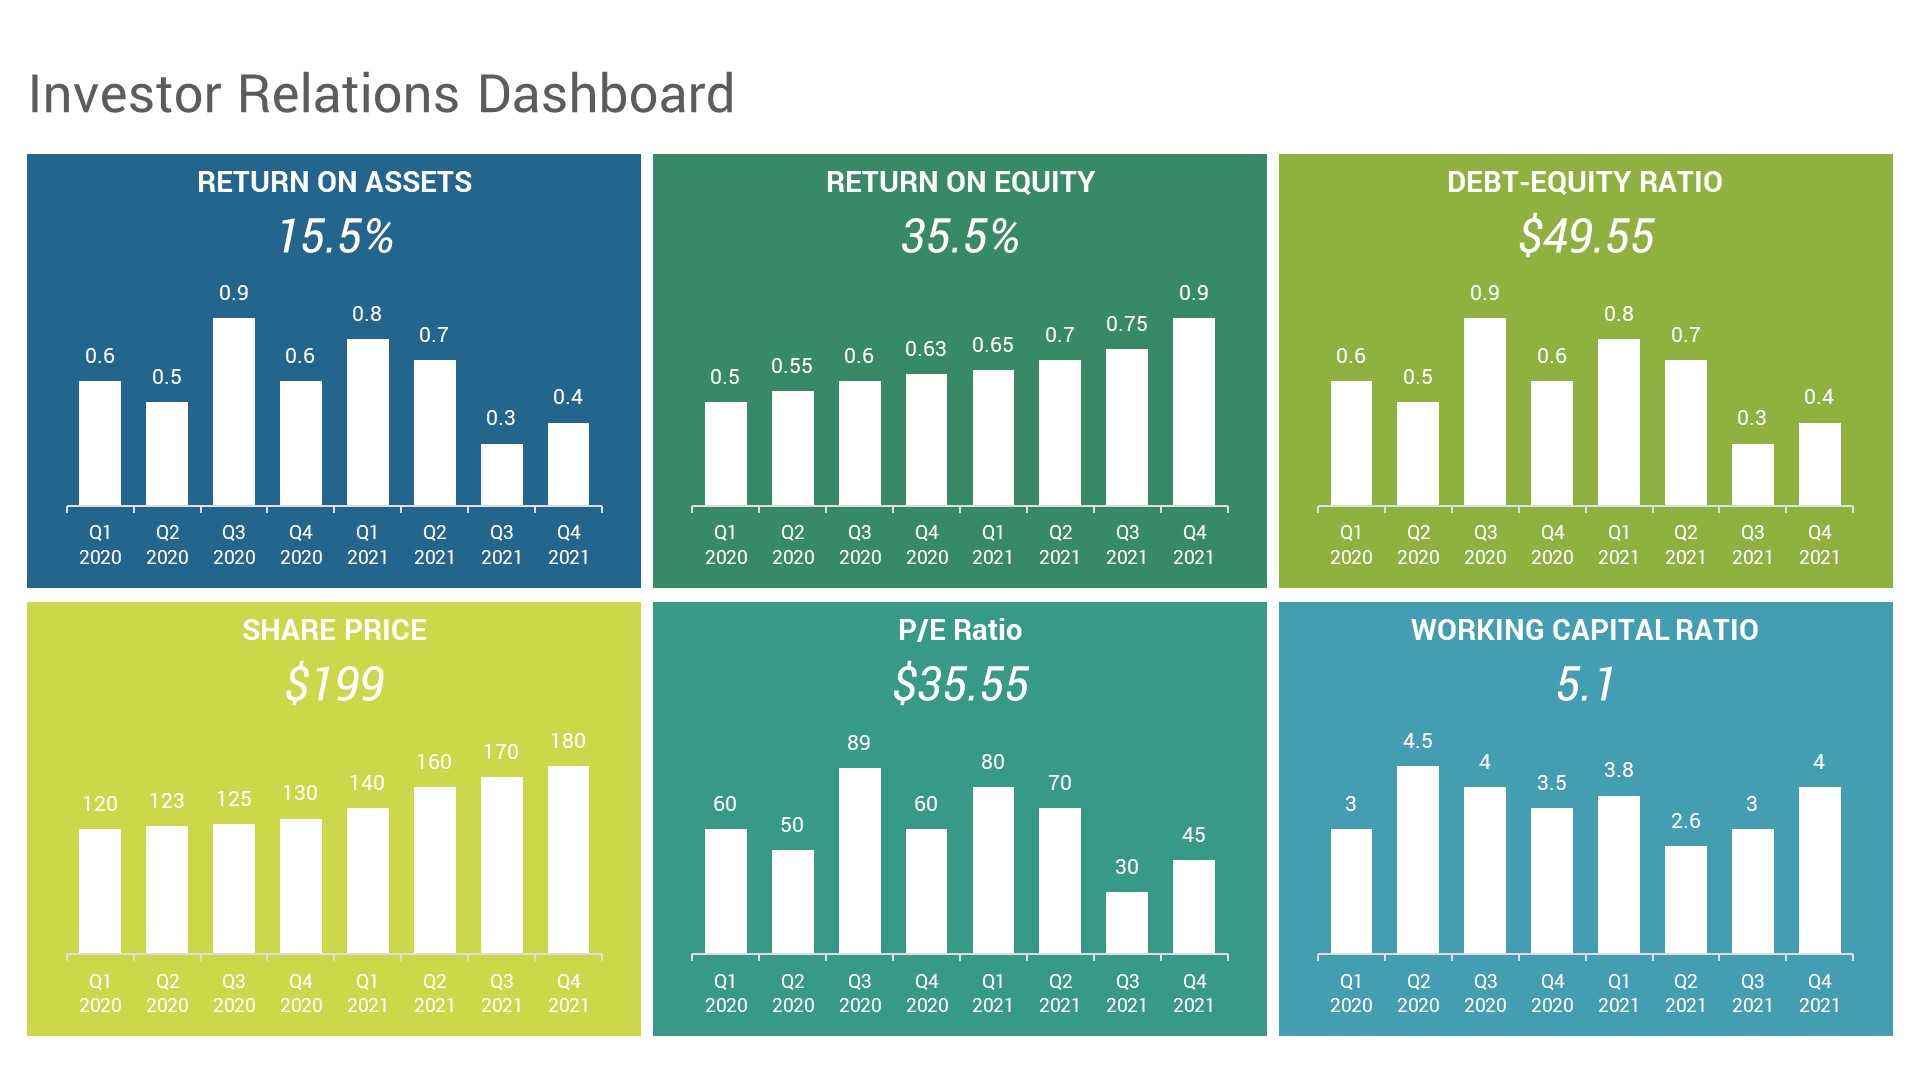
- Investor Relations Dashboard
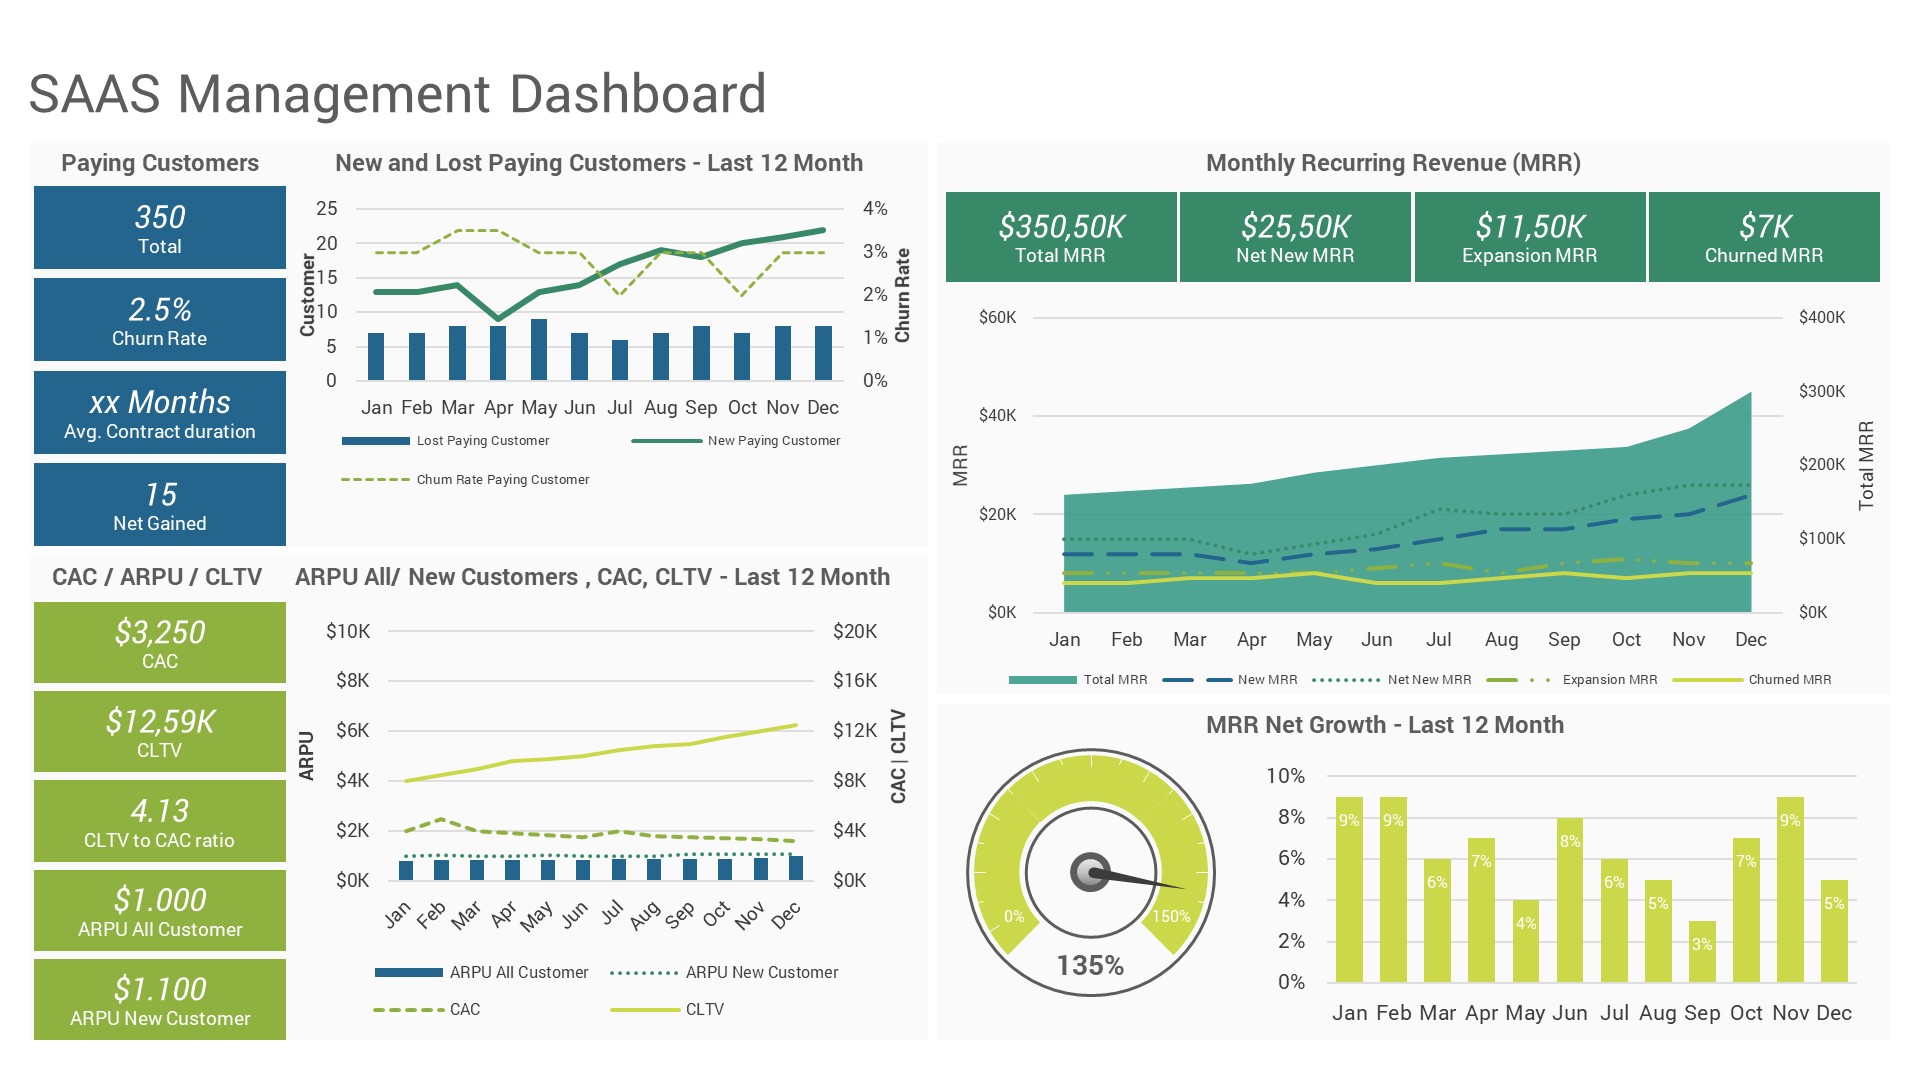
- SAAS Management Dashboard
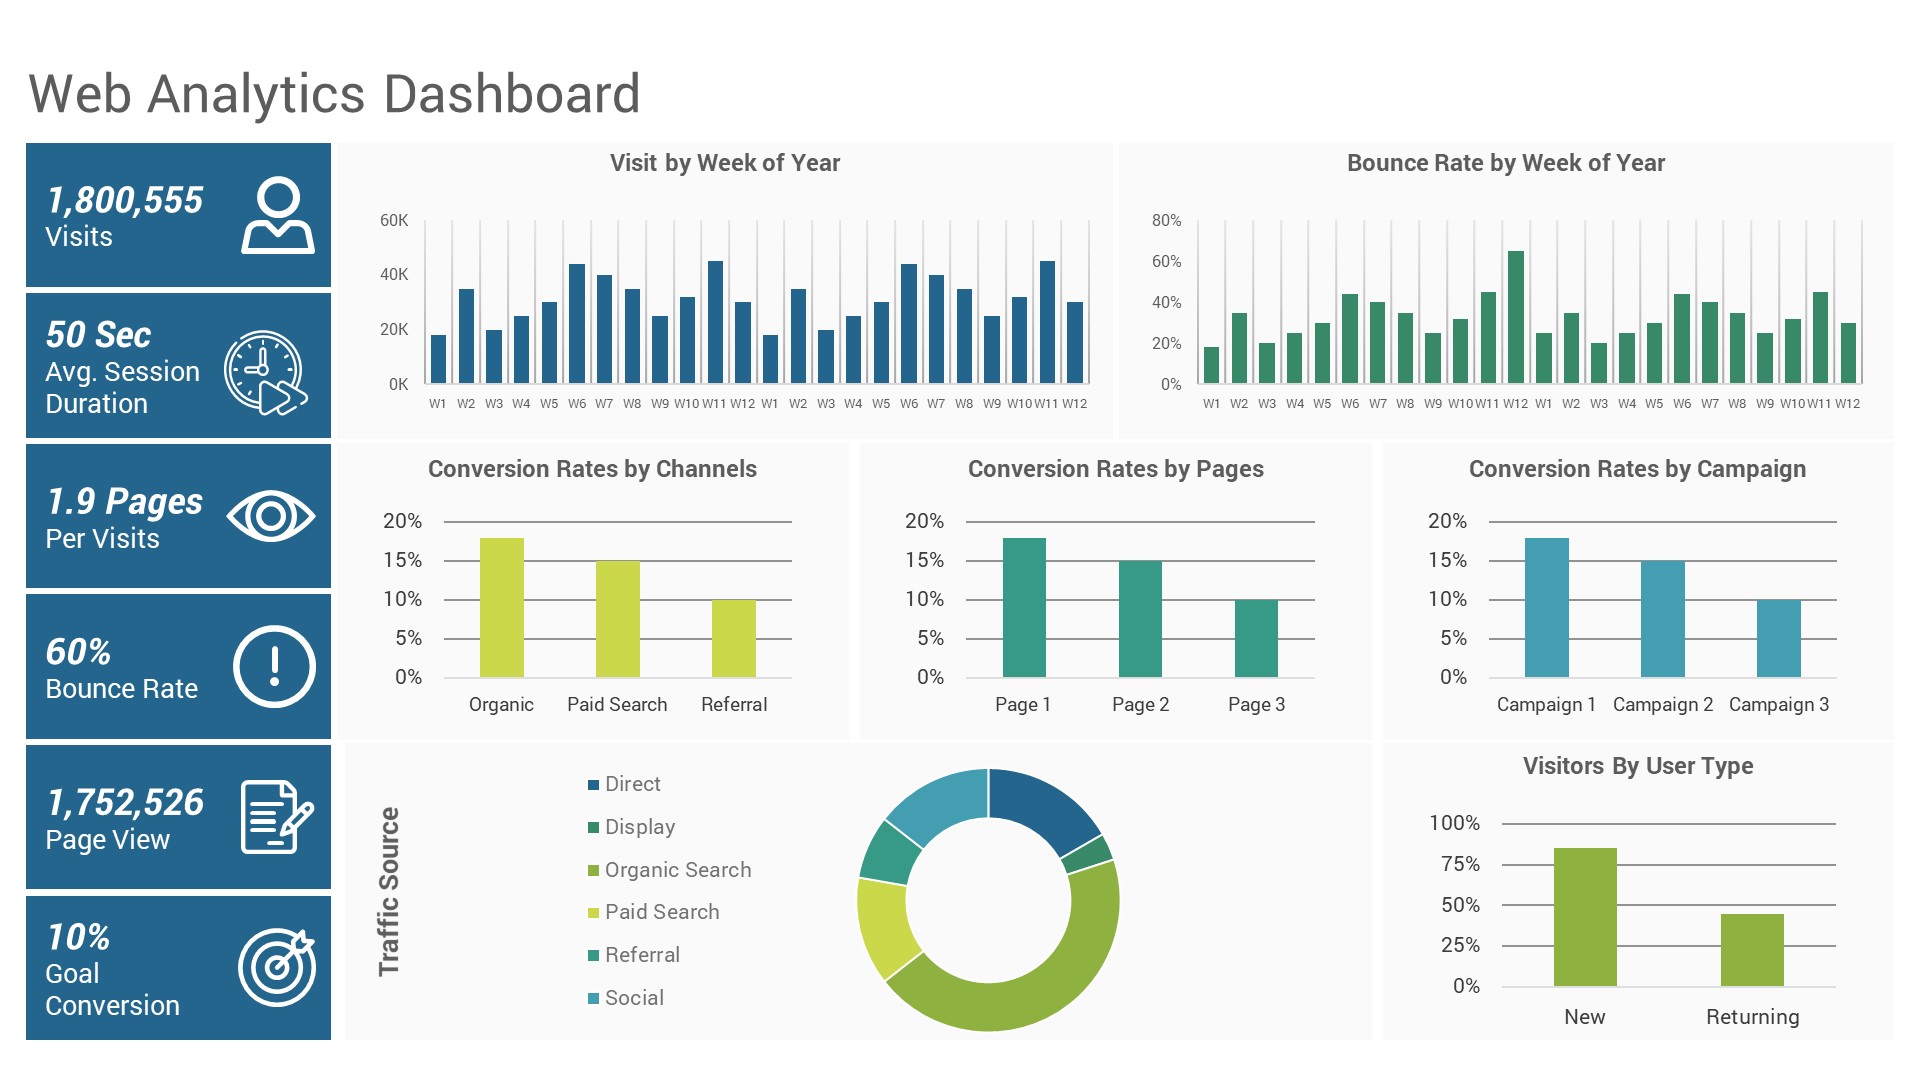
- Web Analytics Dashboard
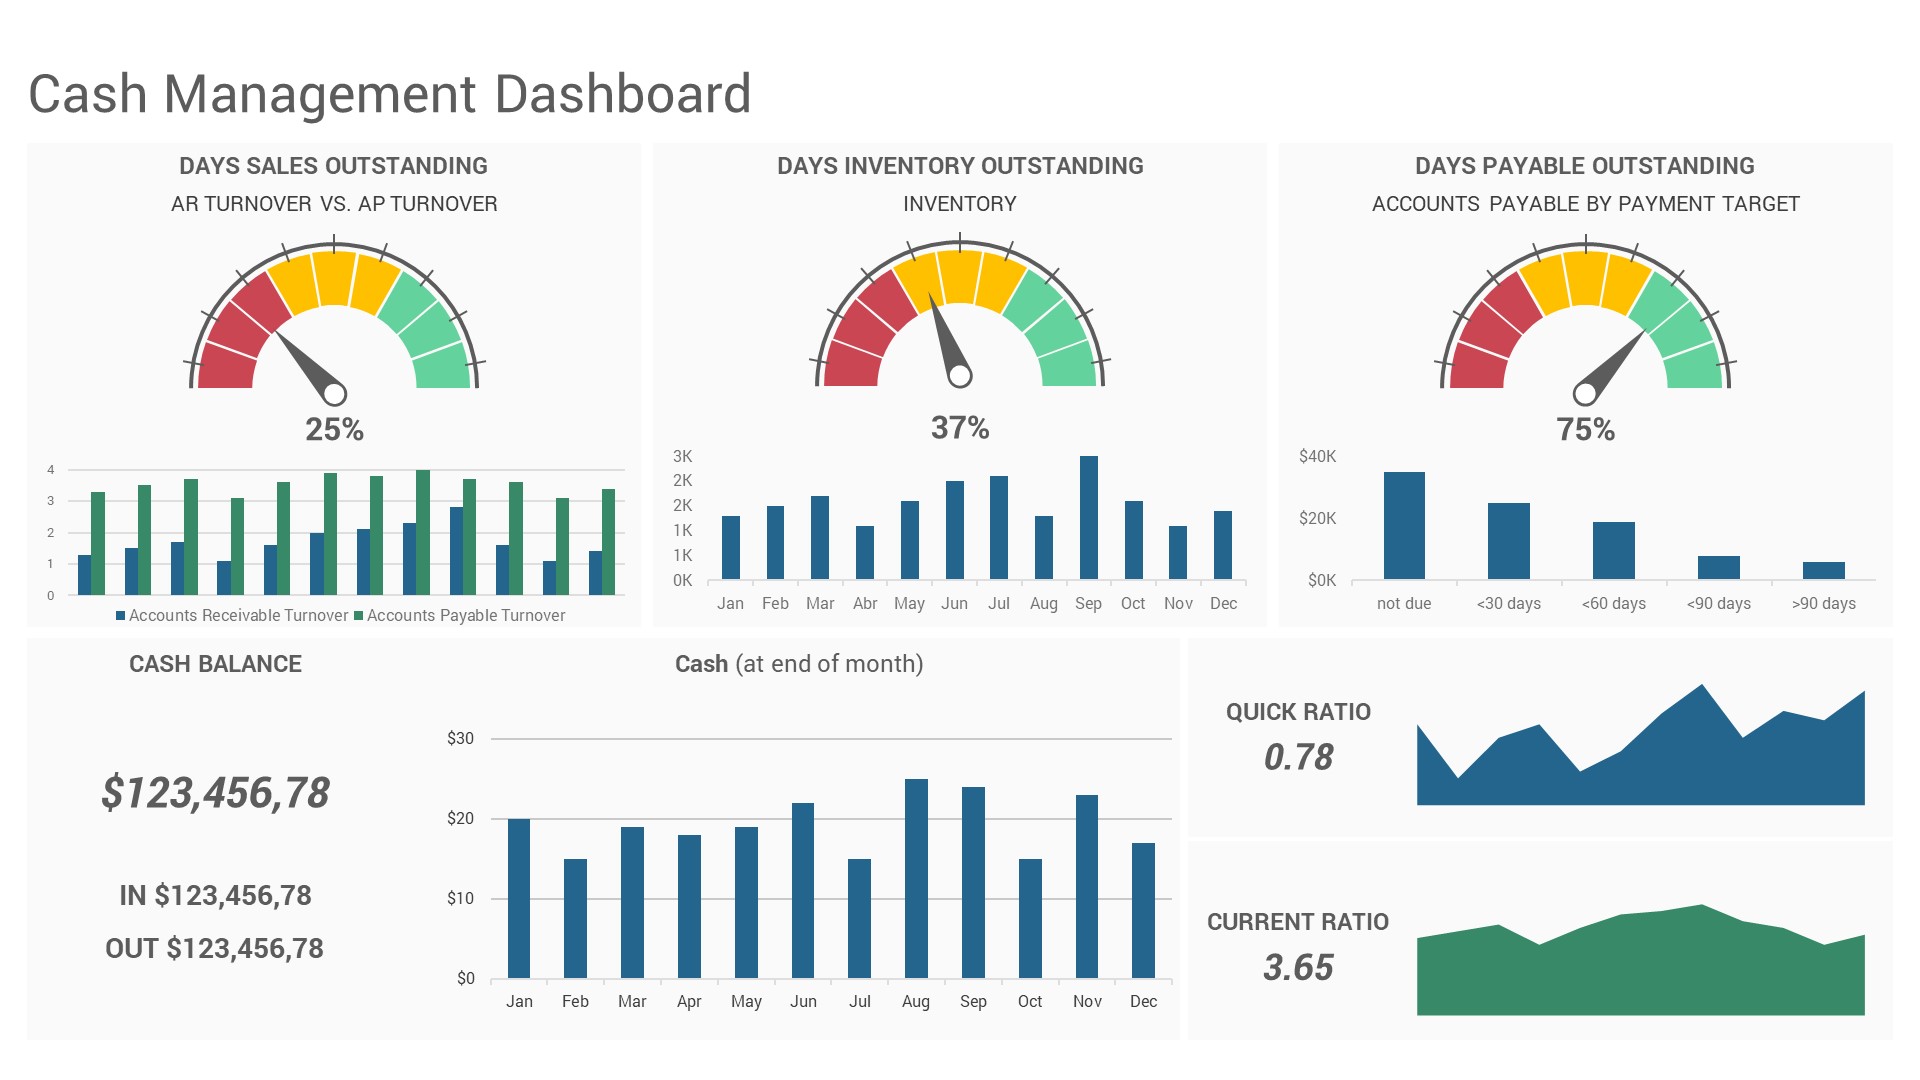
- Cash Management Dashboard
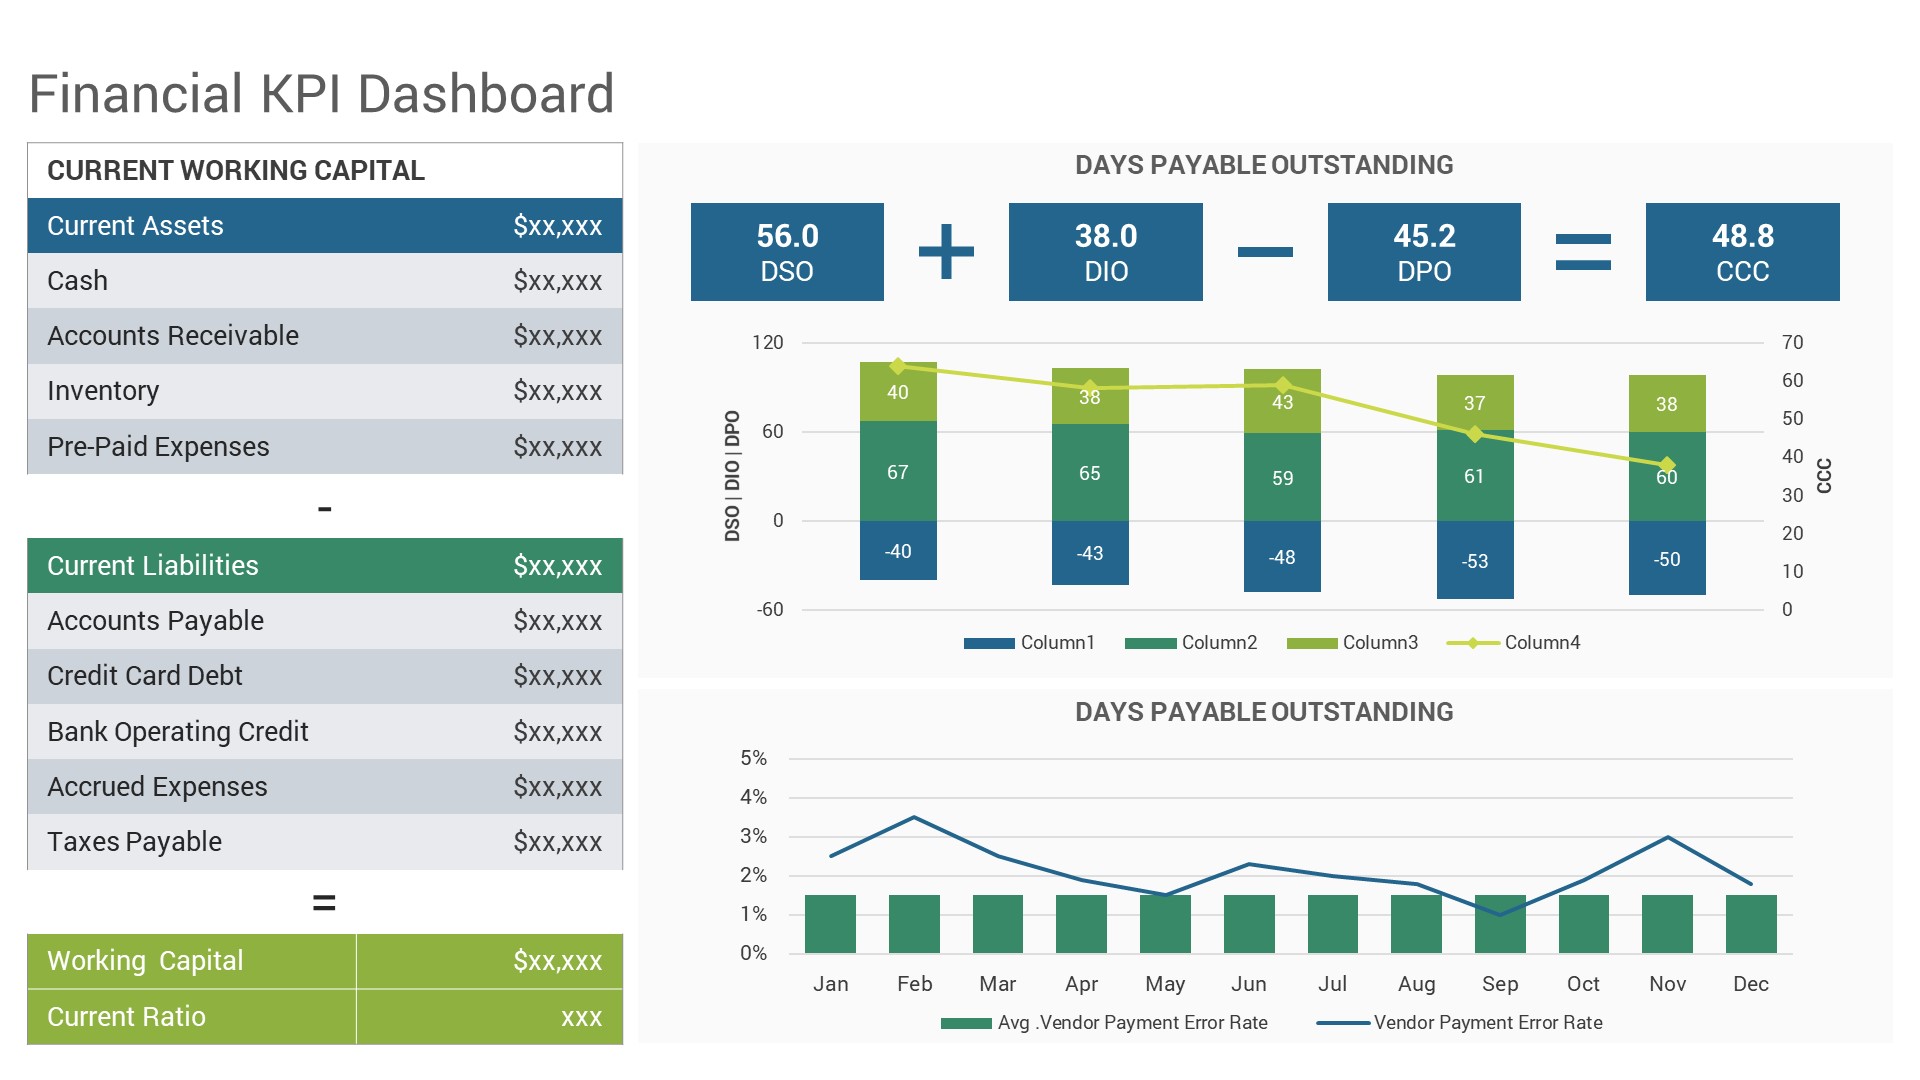
- Financial KPI Dashboard
- Chief Financial Officer (CFO) Dashboard
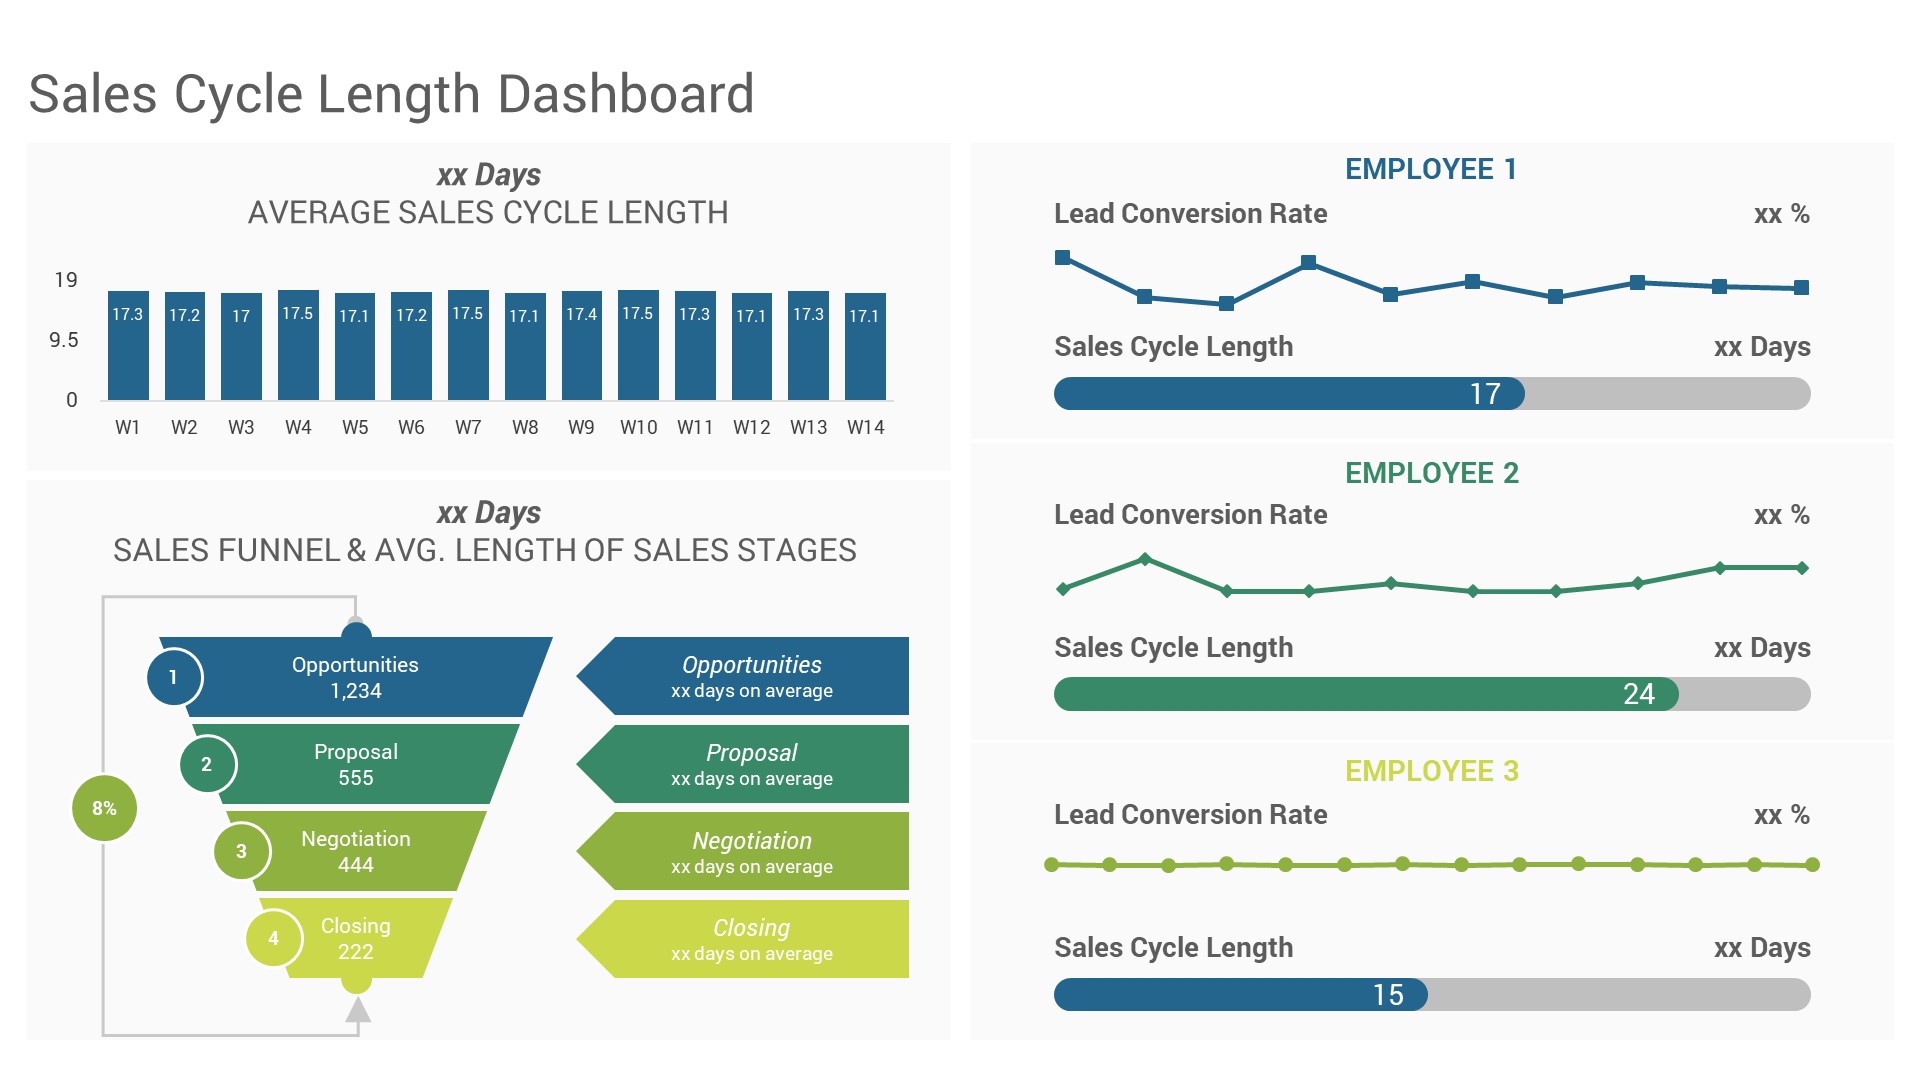
- Sales Cycle Length Dashboard
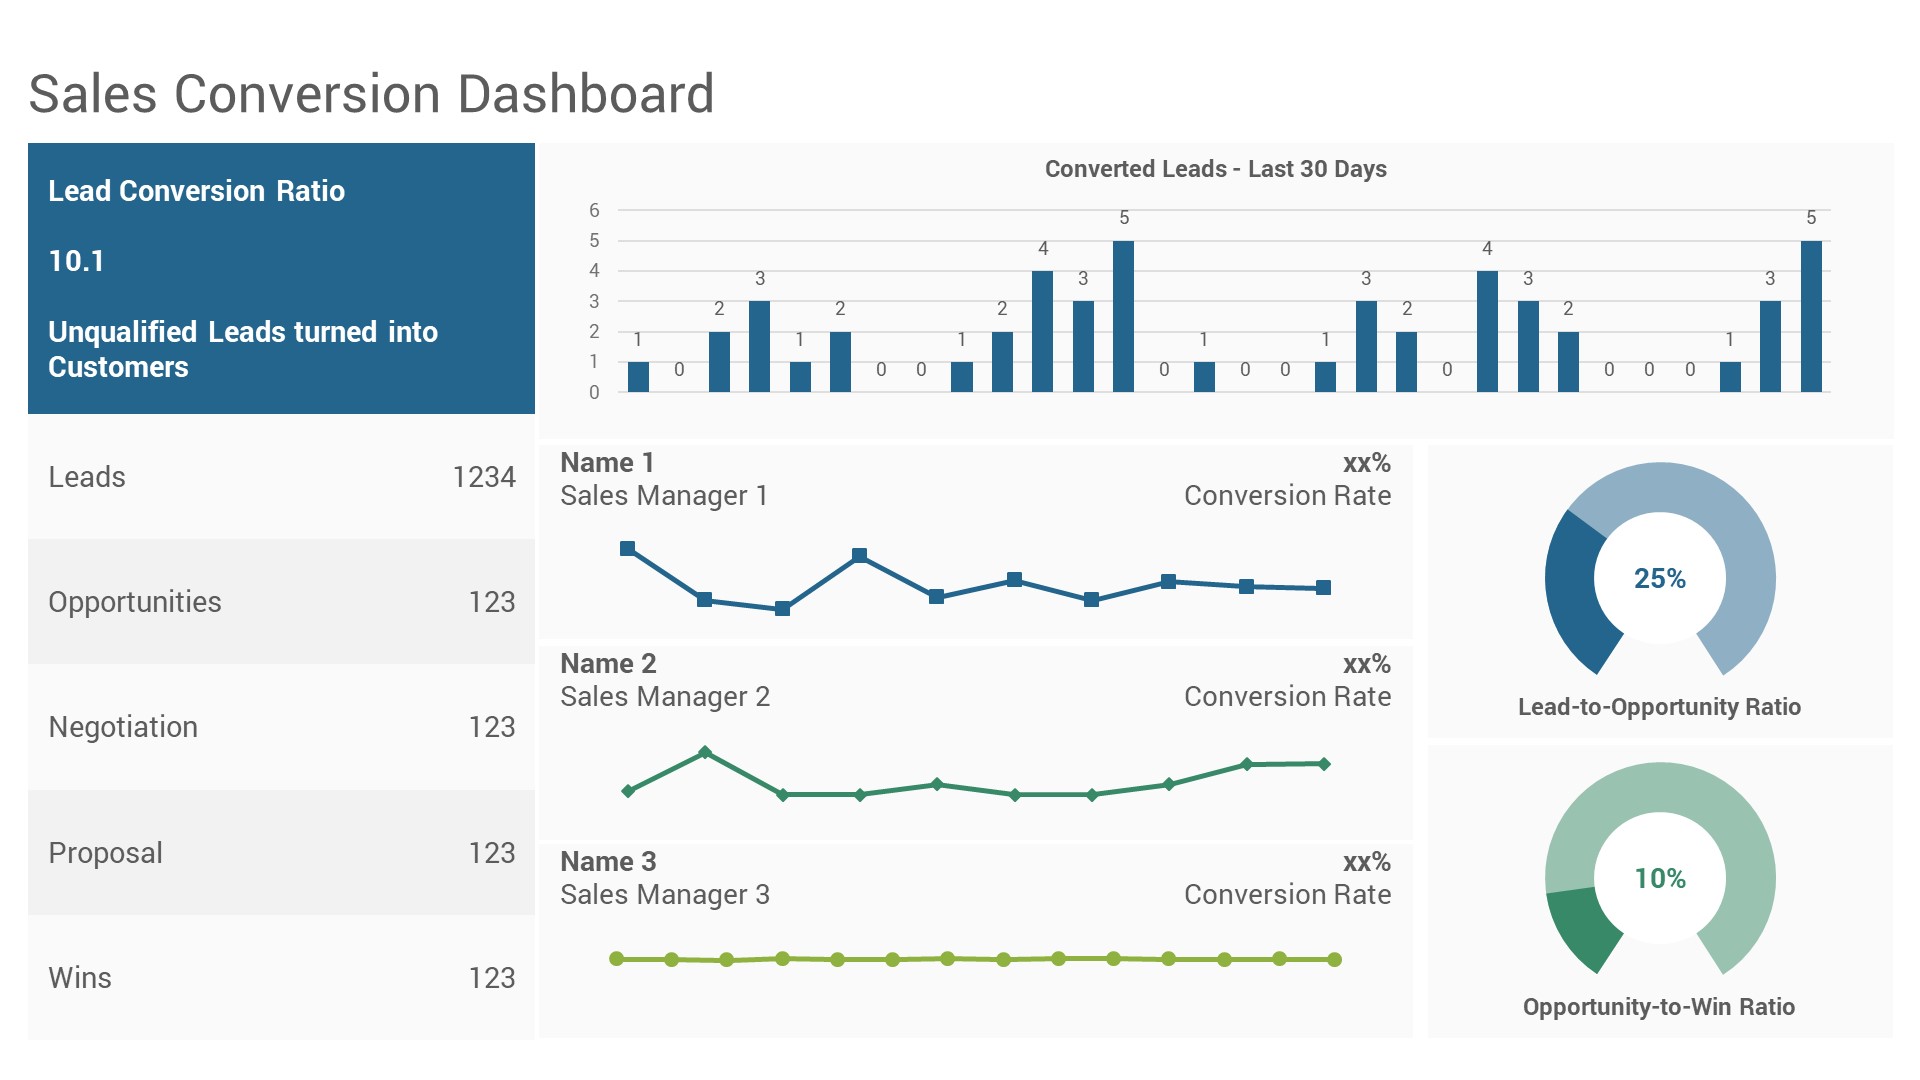
- Sales Conversion Dashboard
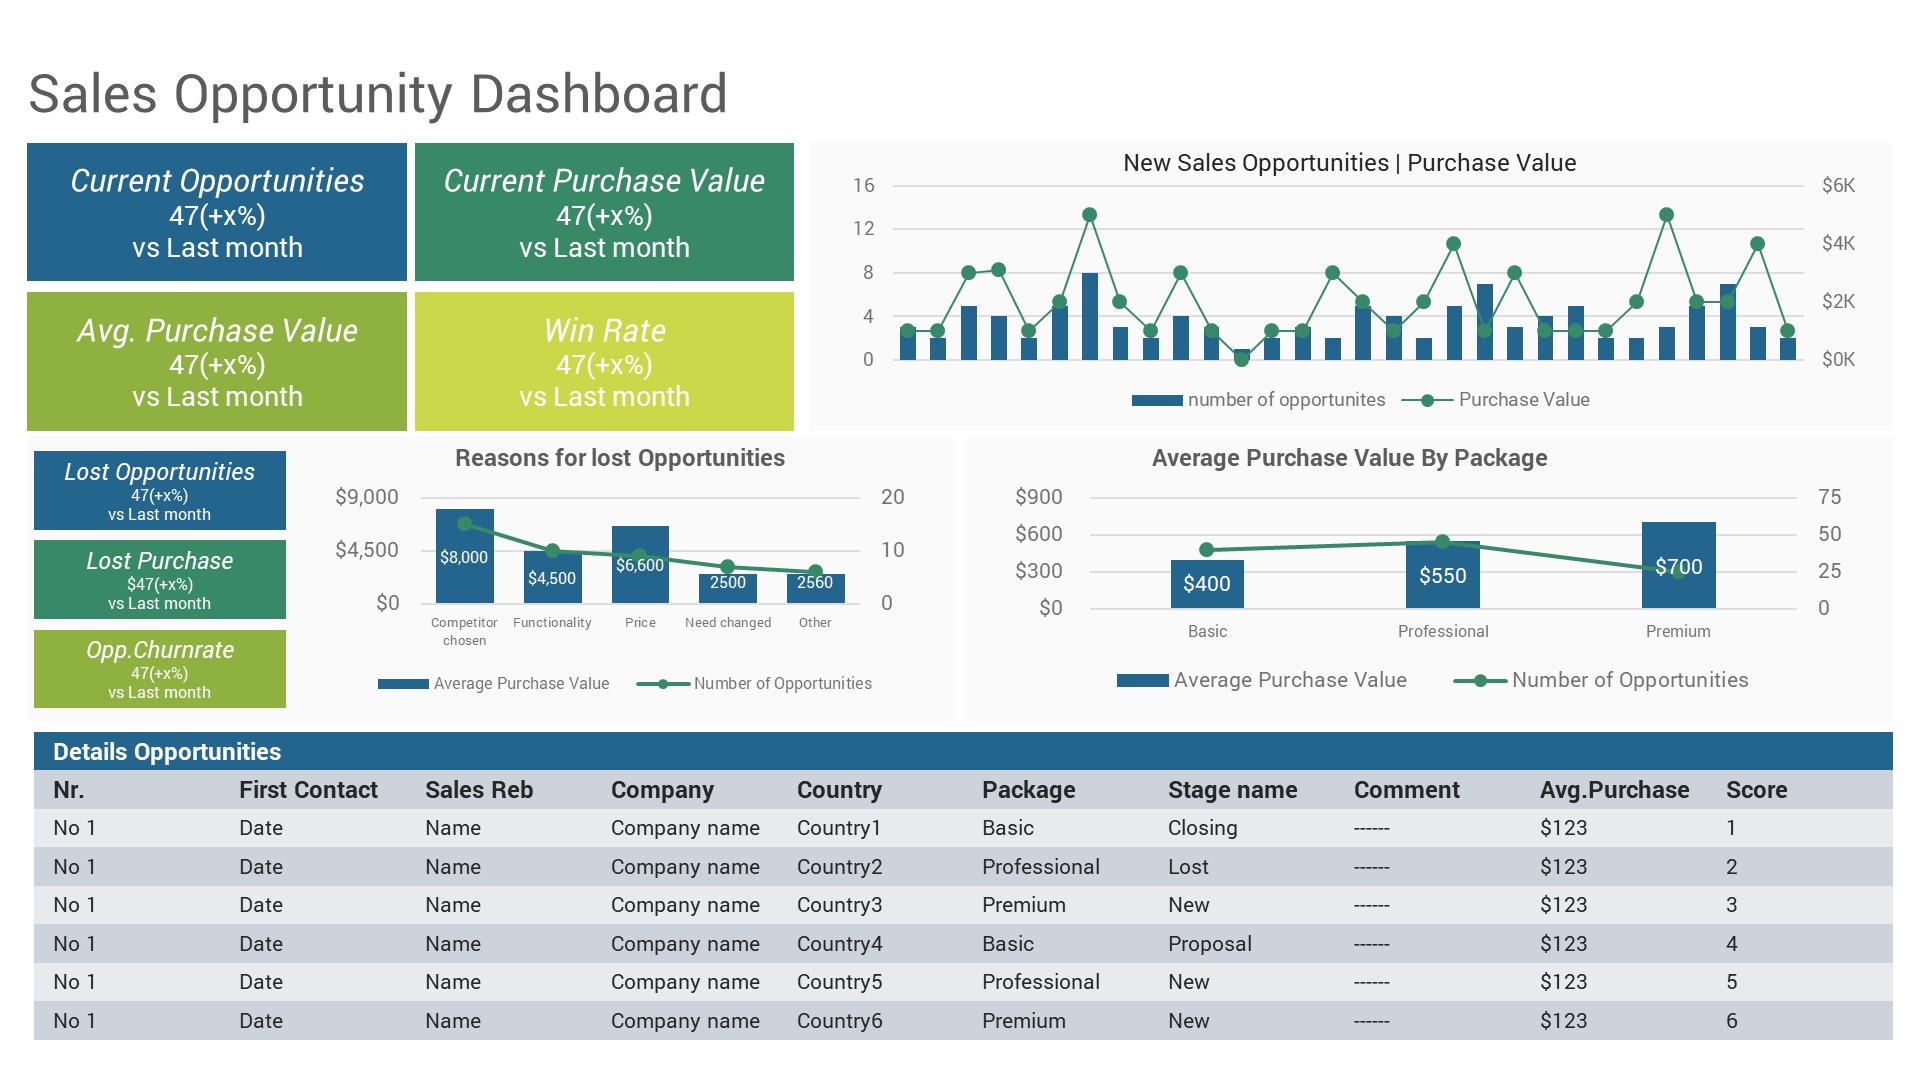
- Sales Opportunity Dashboard
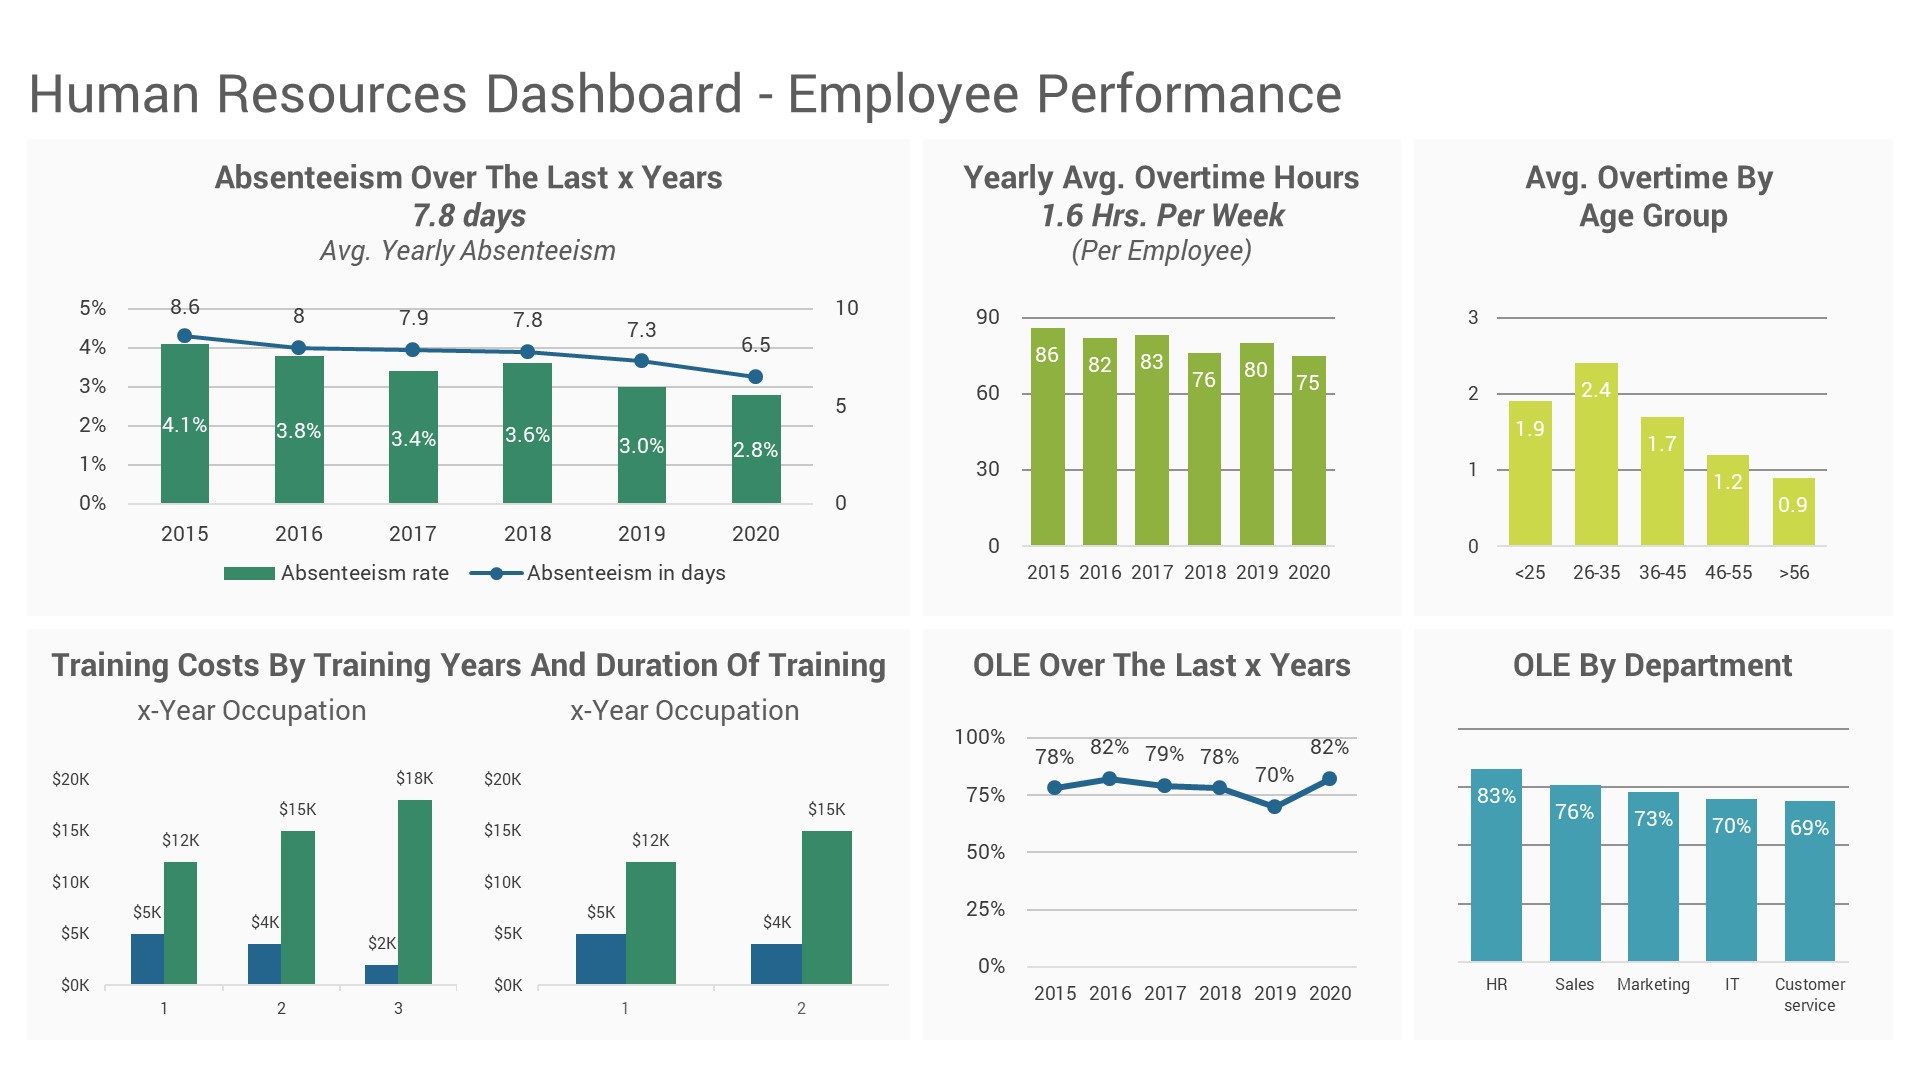
- Human Resources Dashboard Employee Performance
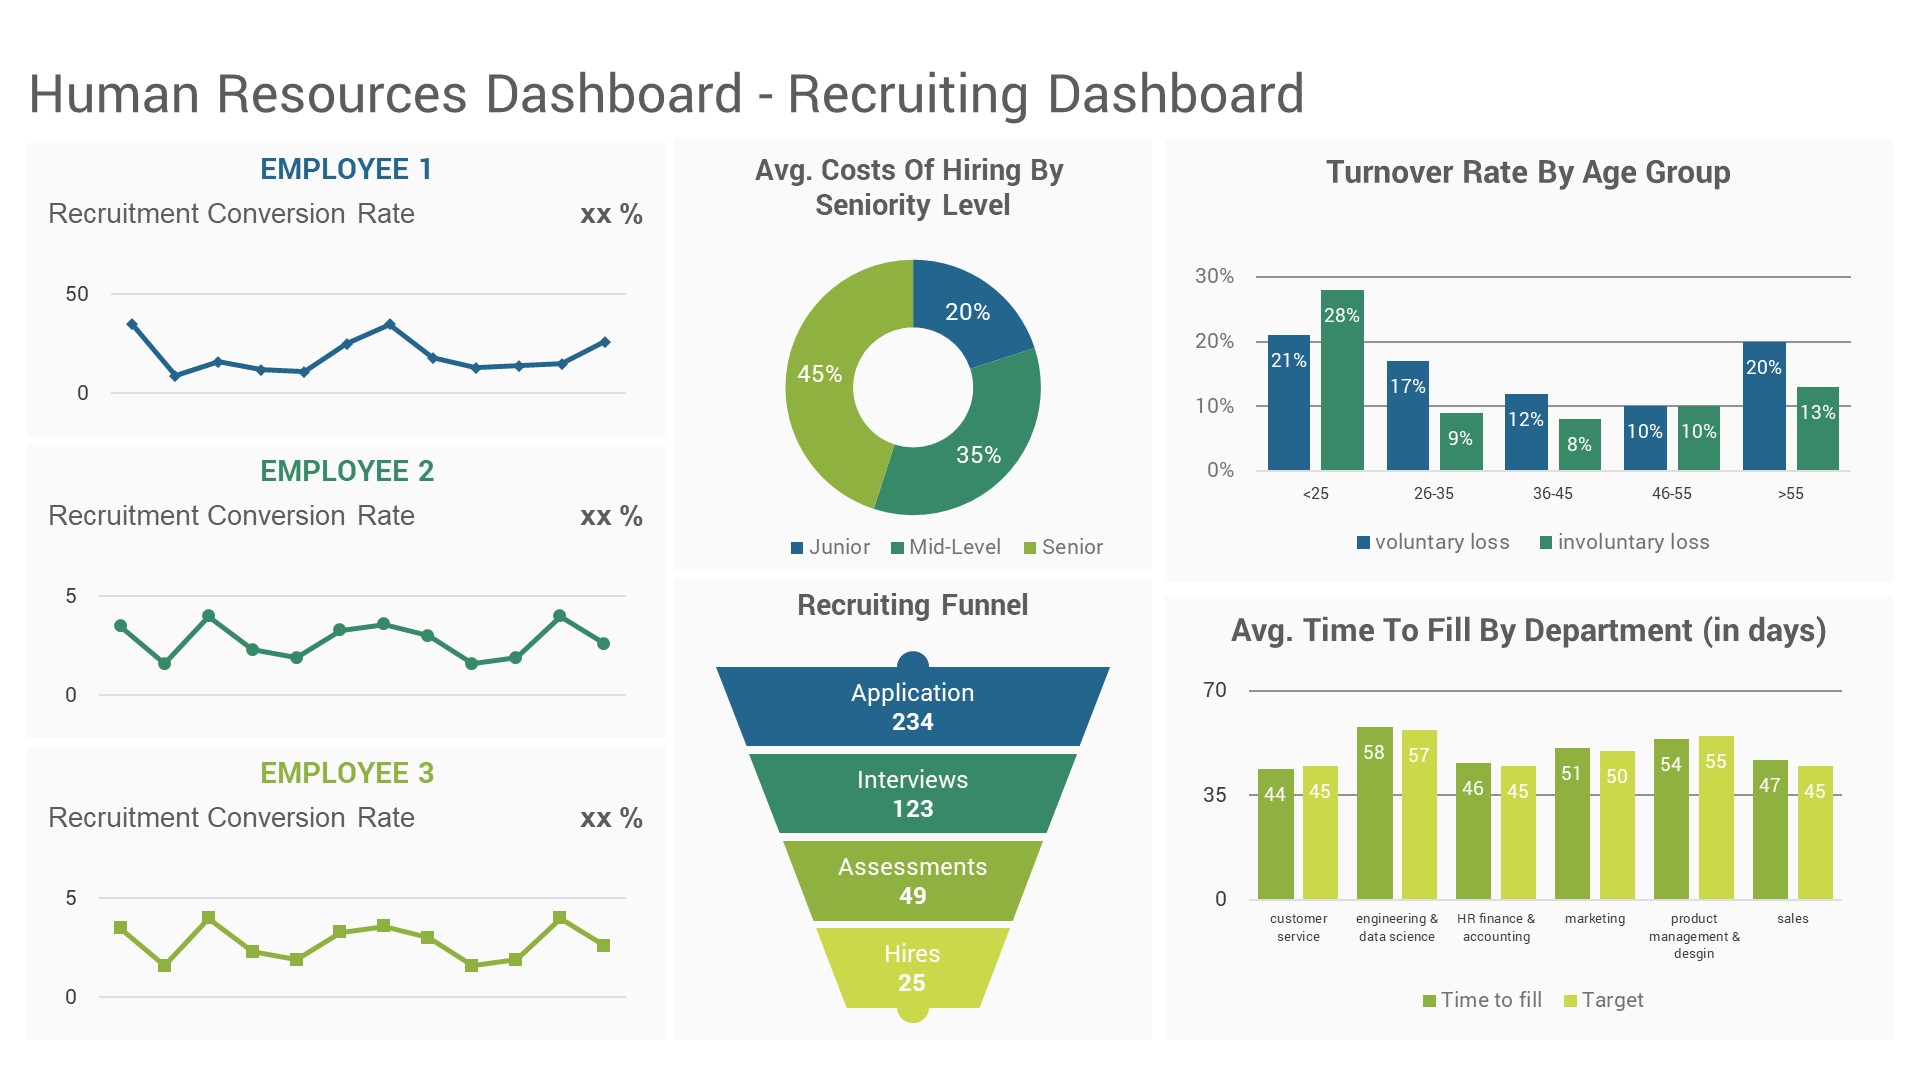
- Human Resources Dashboard Recruiting Dashboard
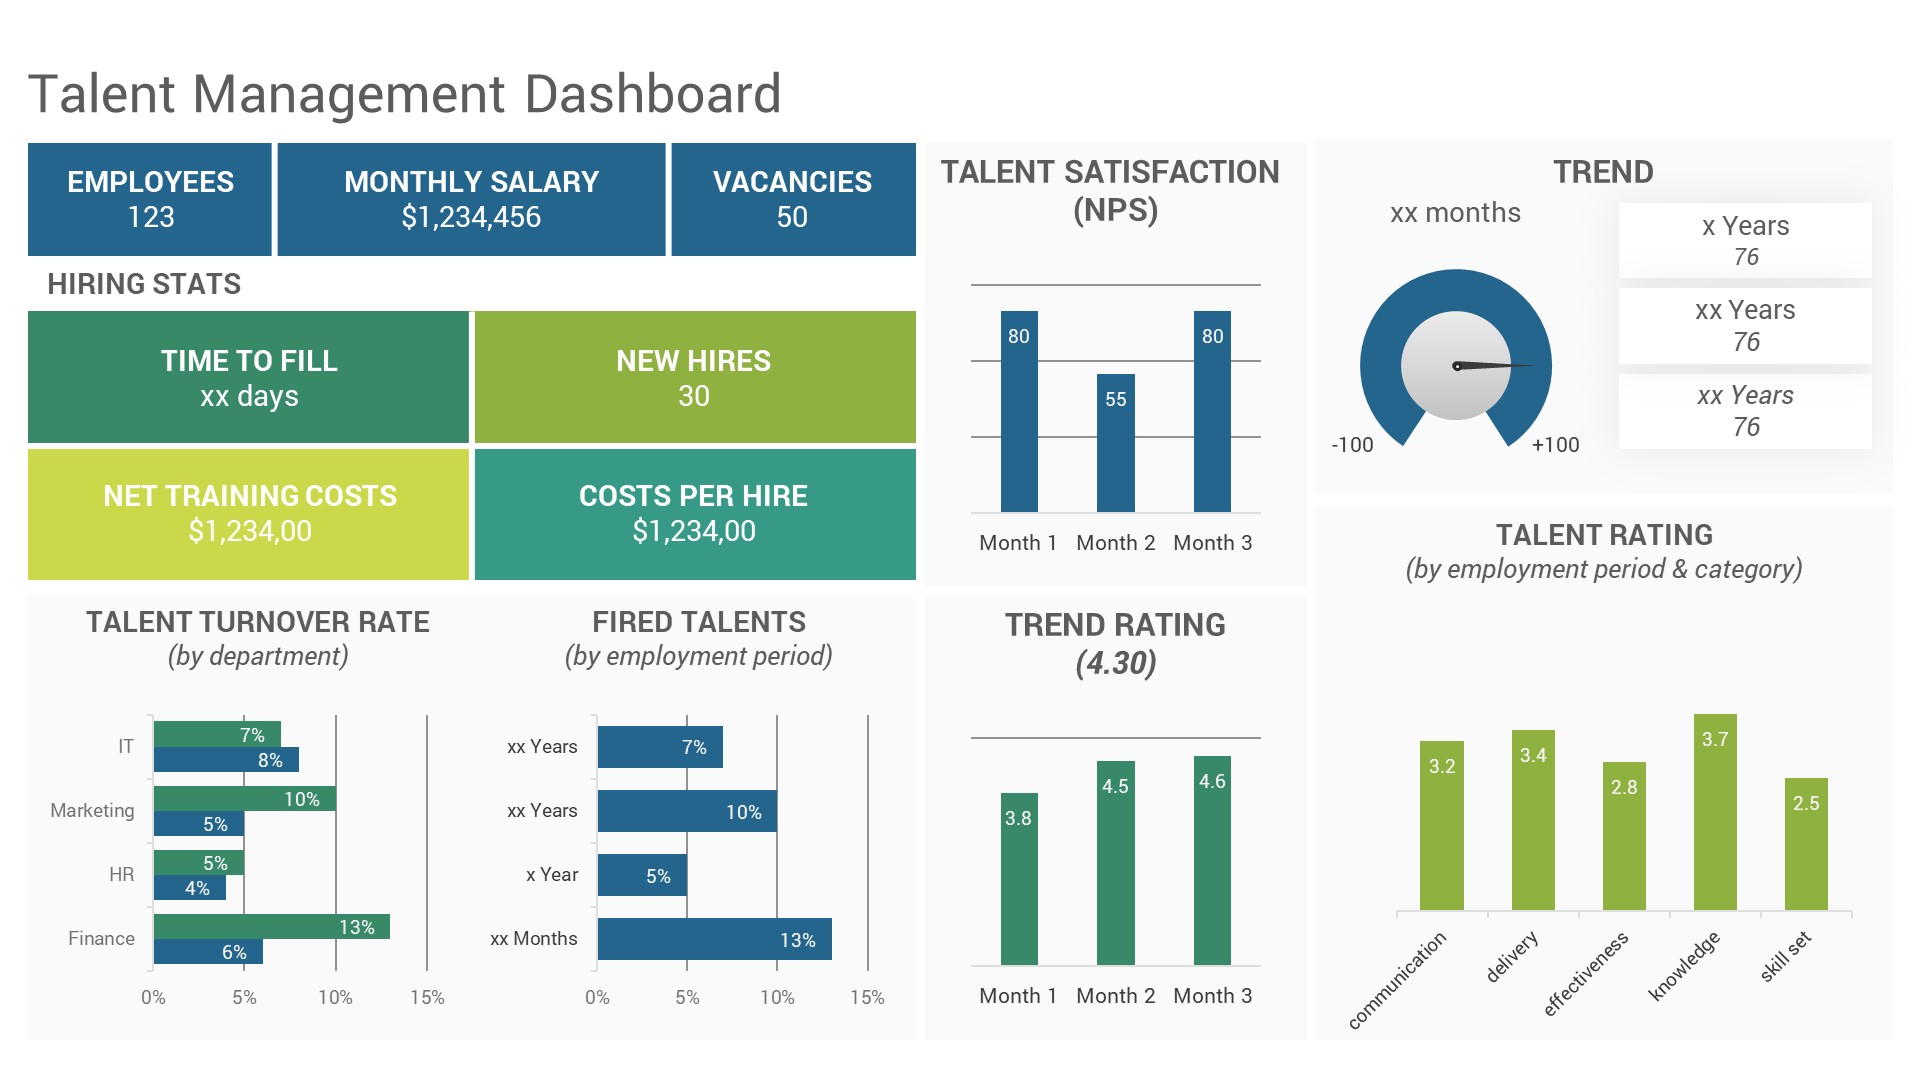
- Talent Management Dashboard
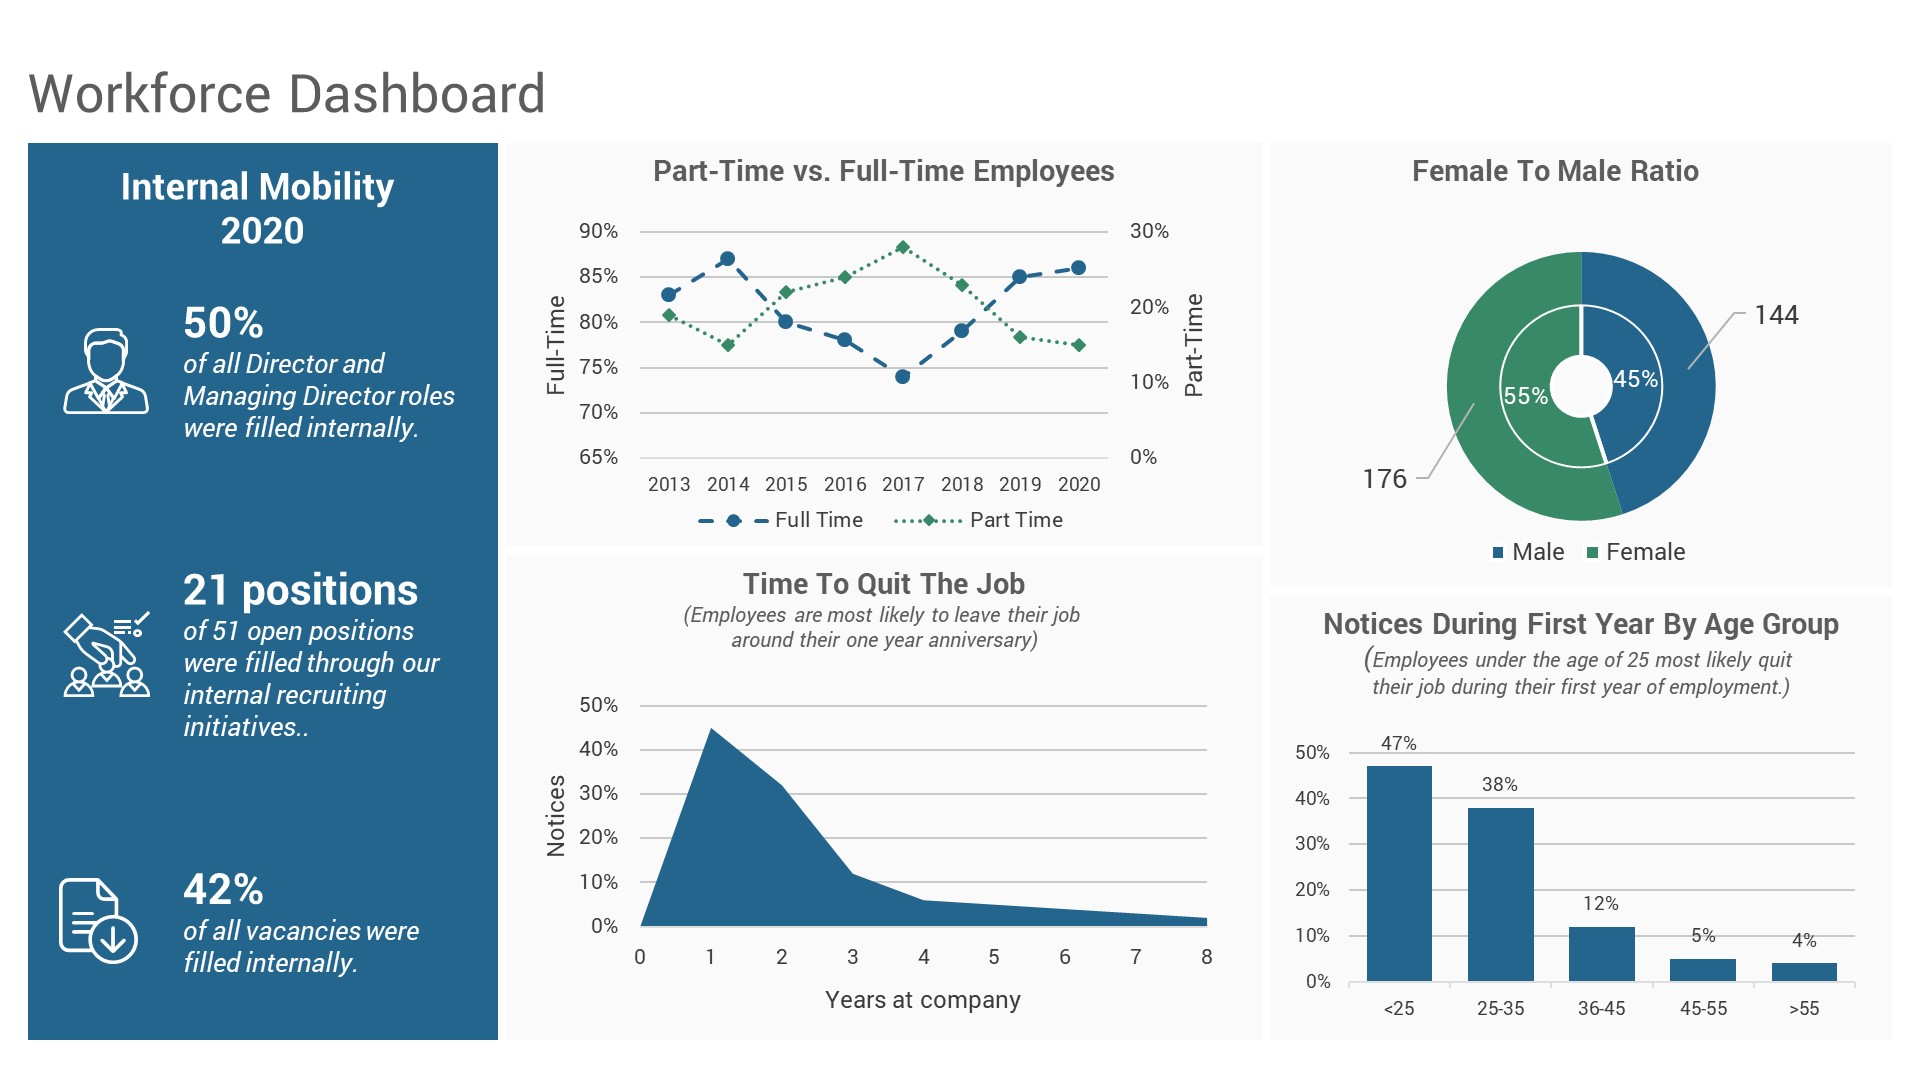
- Workforce Dashboard
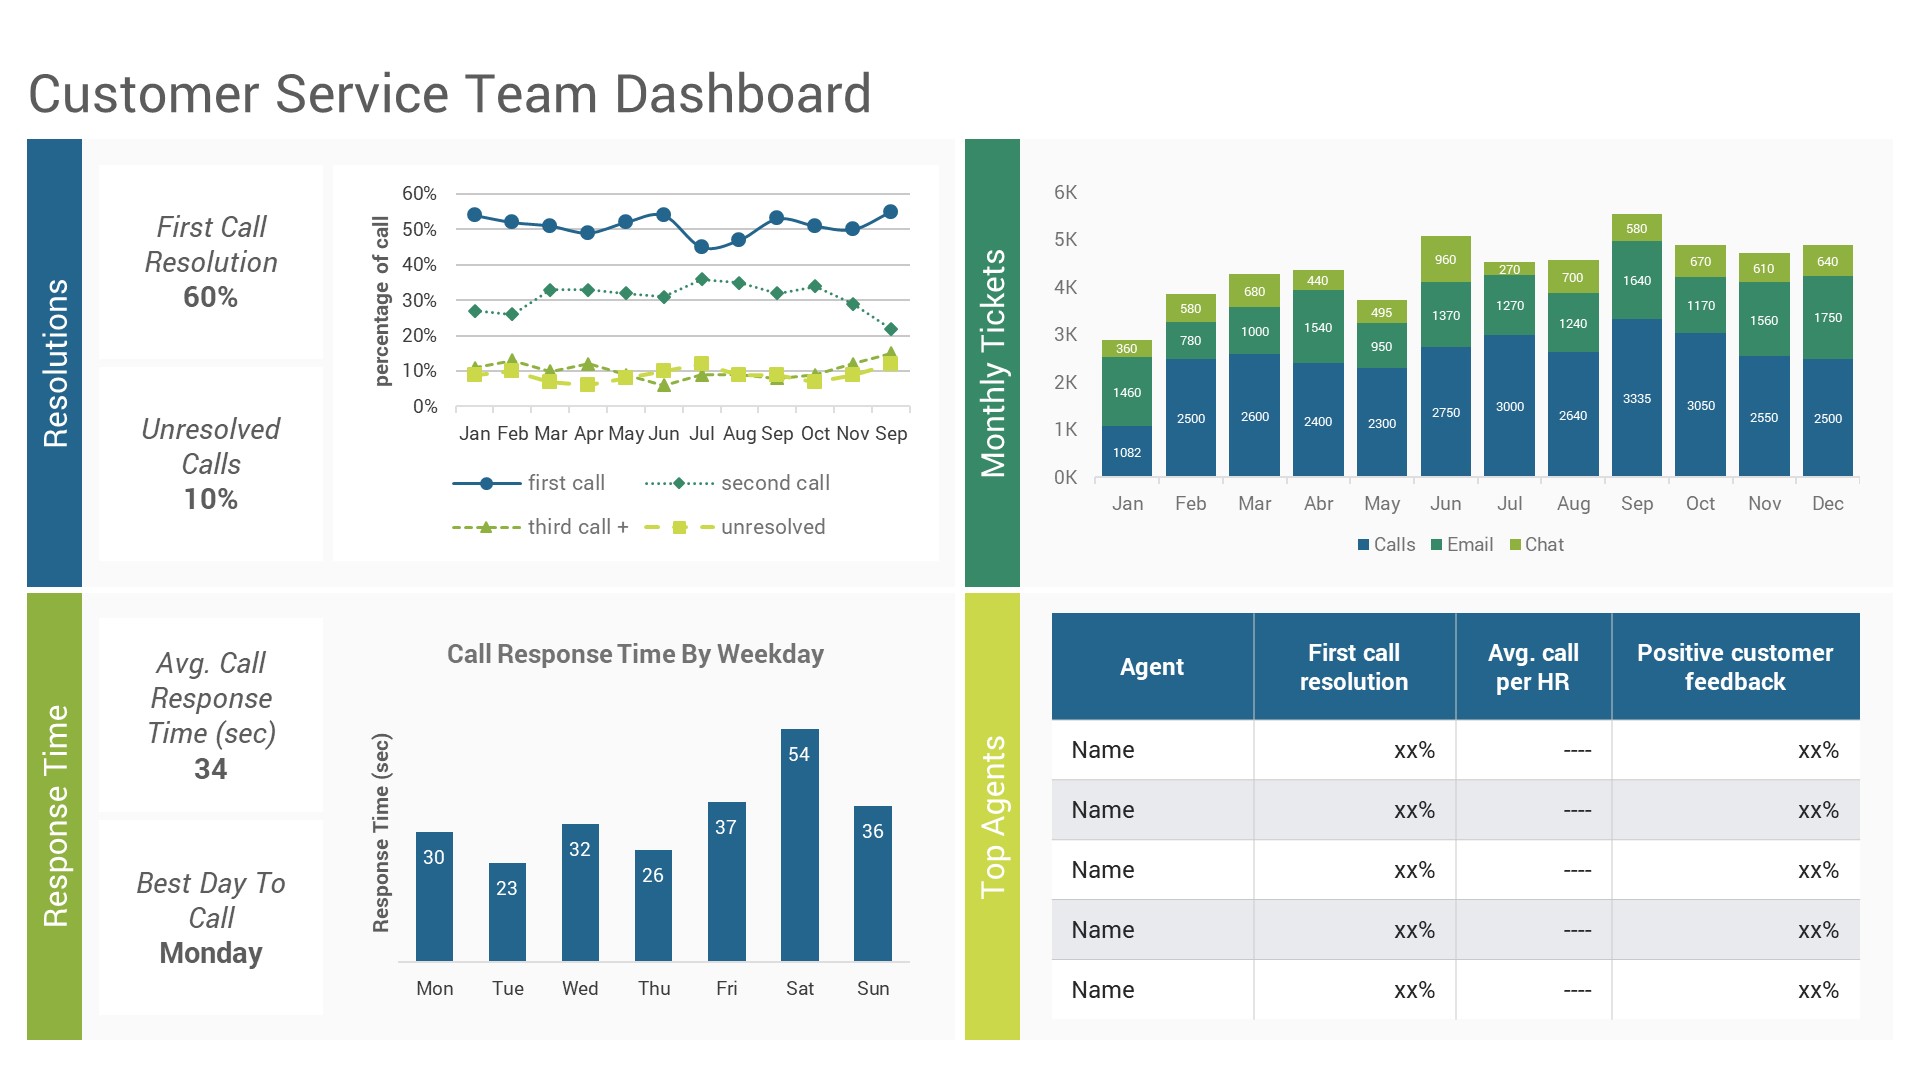
- Customer Service Team Dashboard
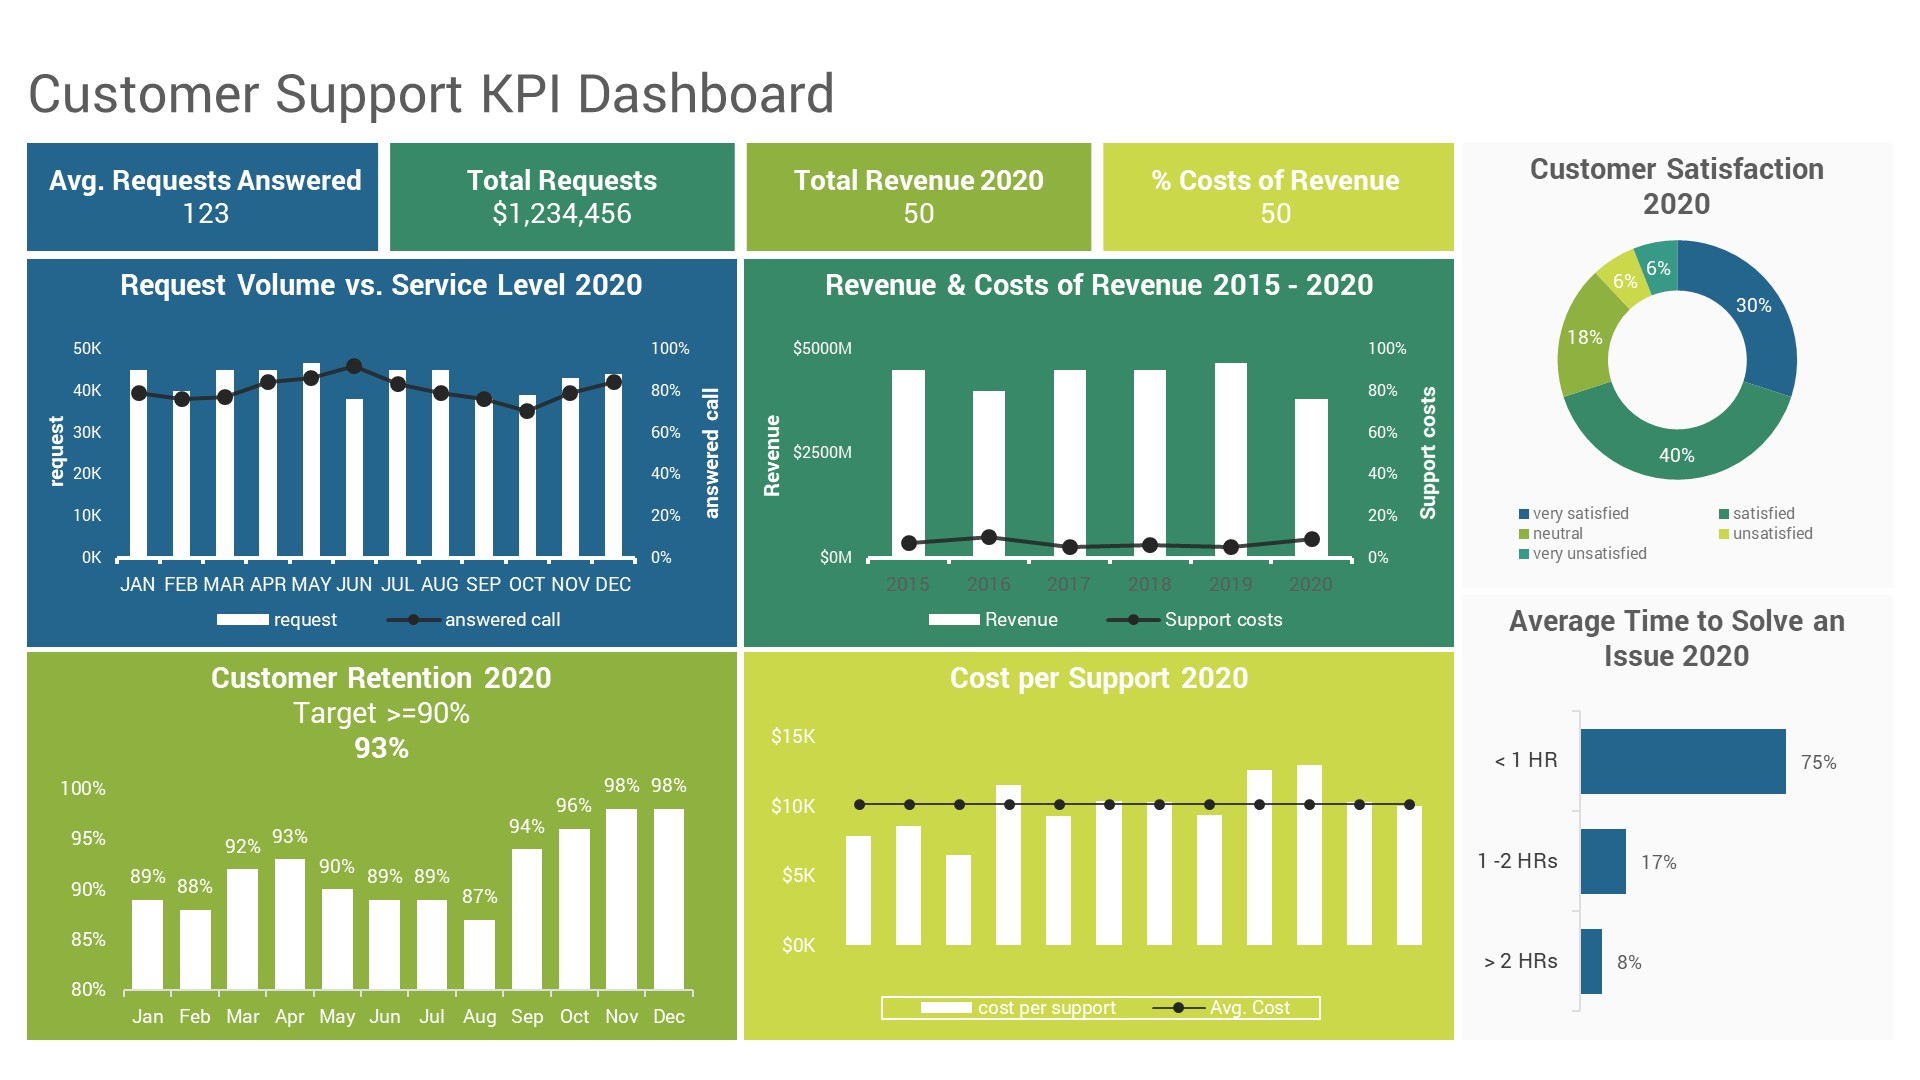
- Customer Support KPI Dashboard
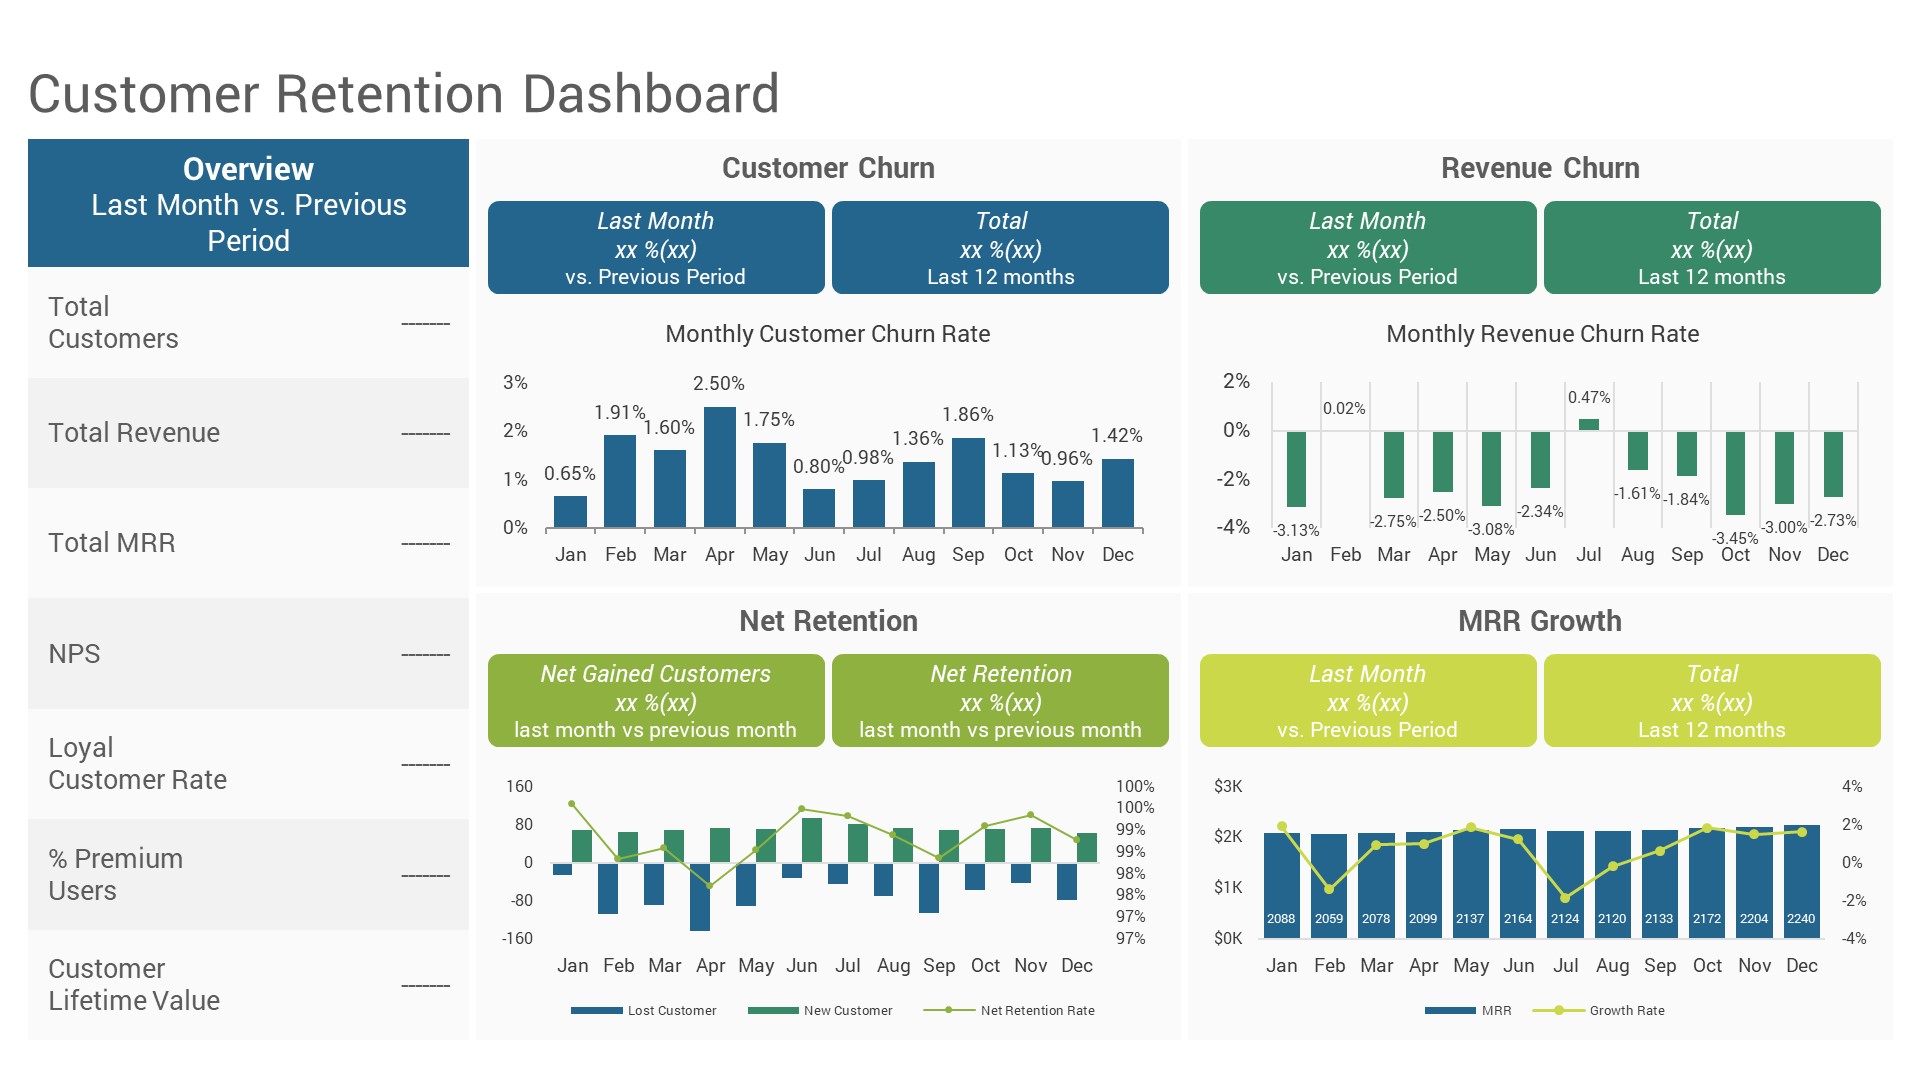
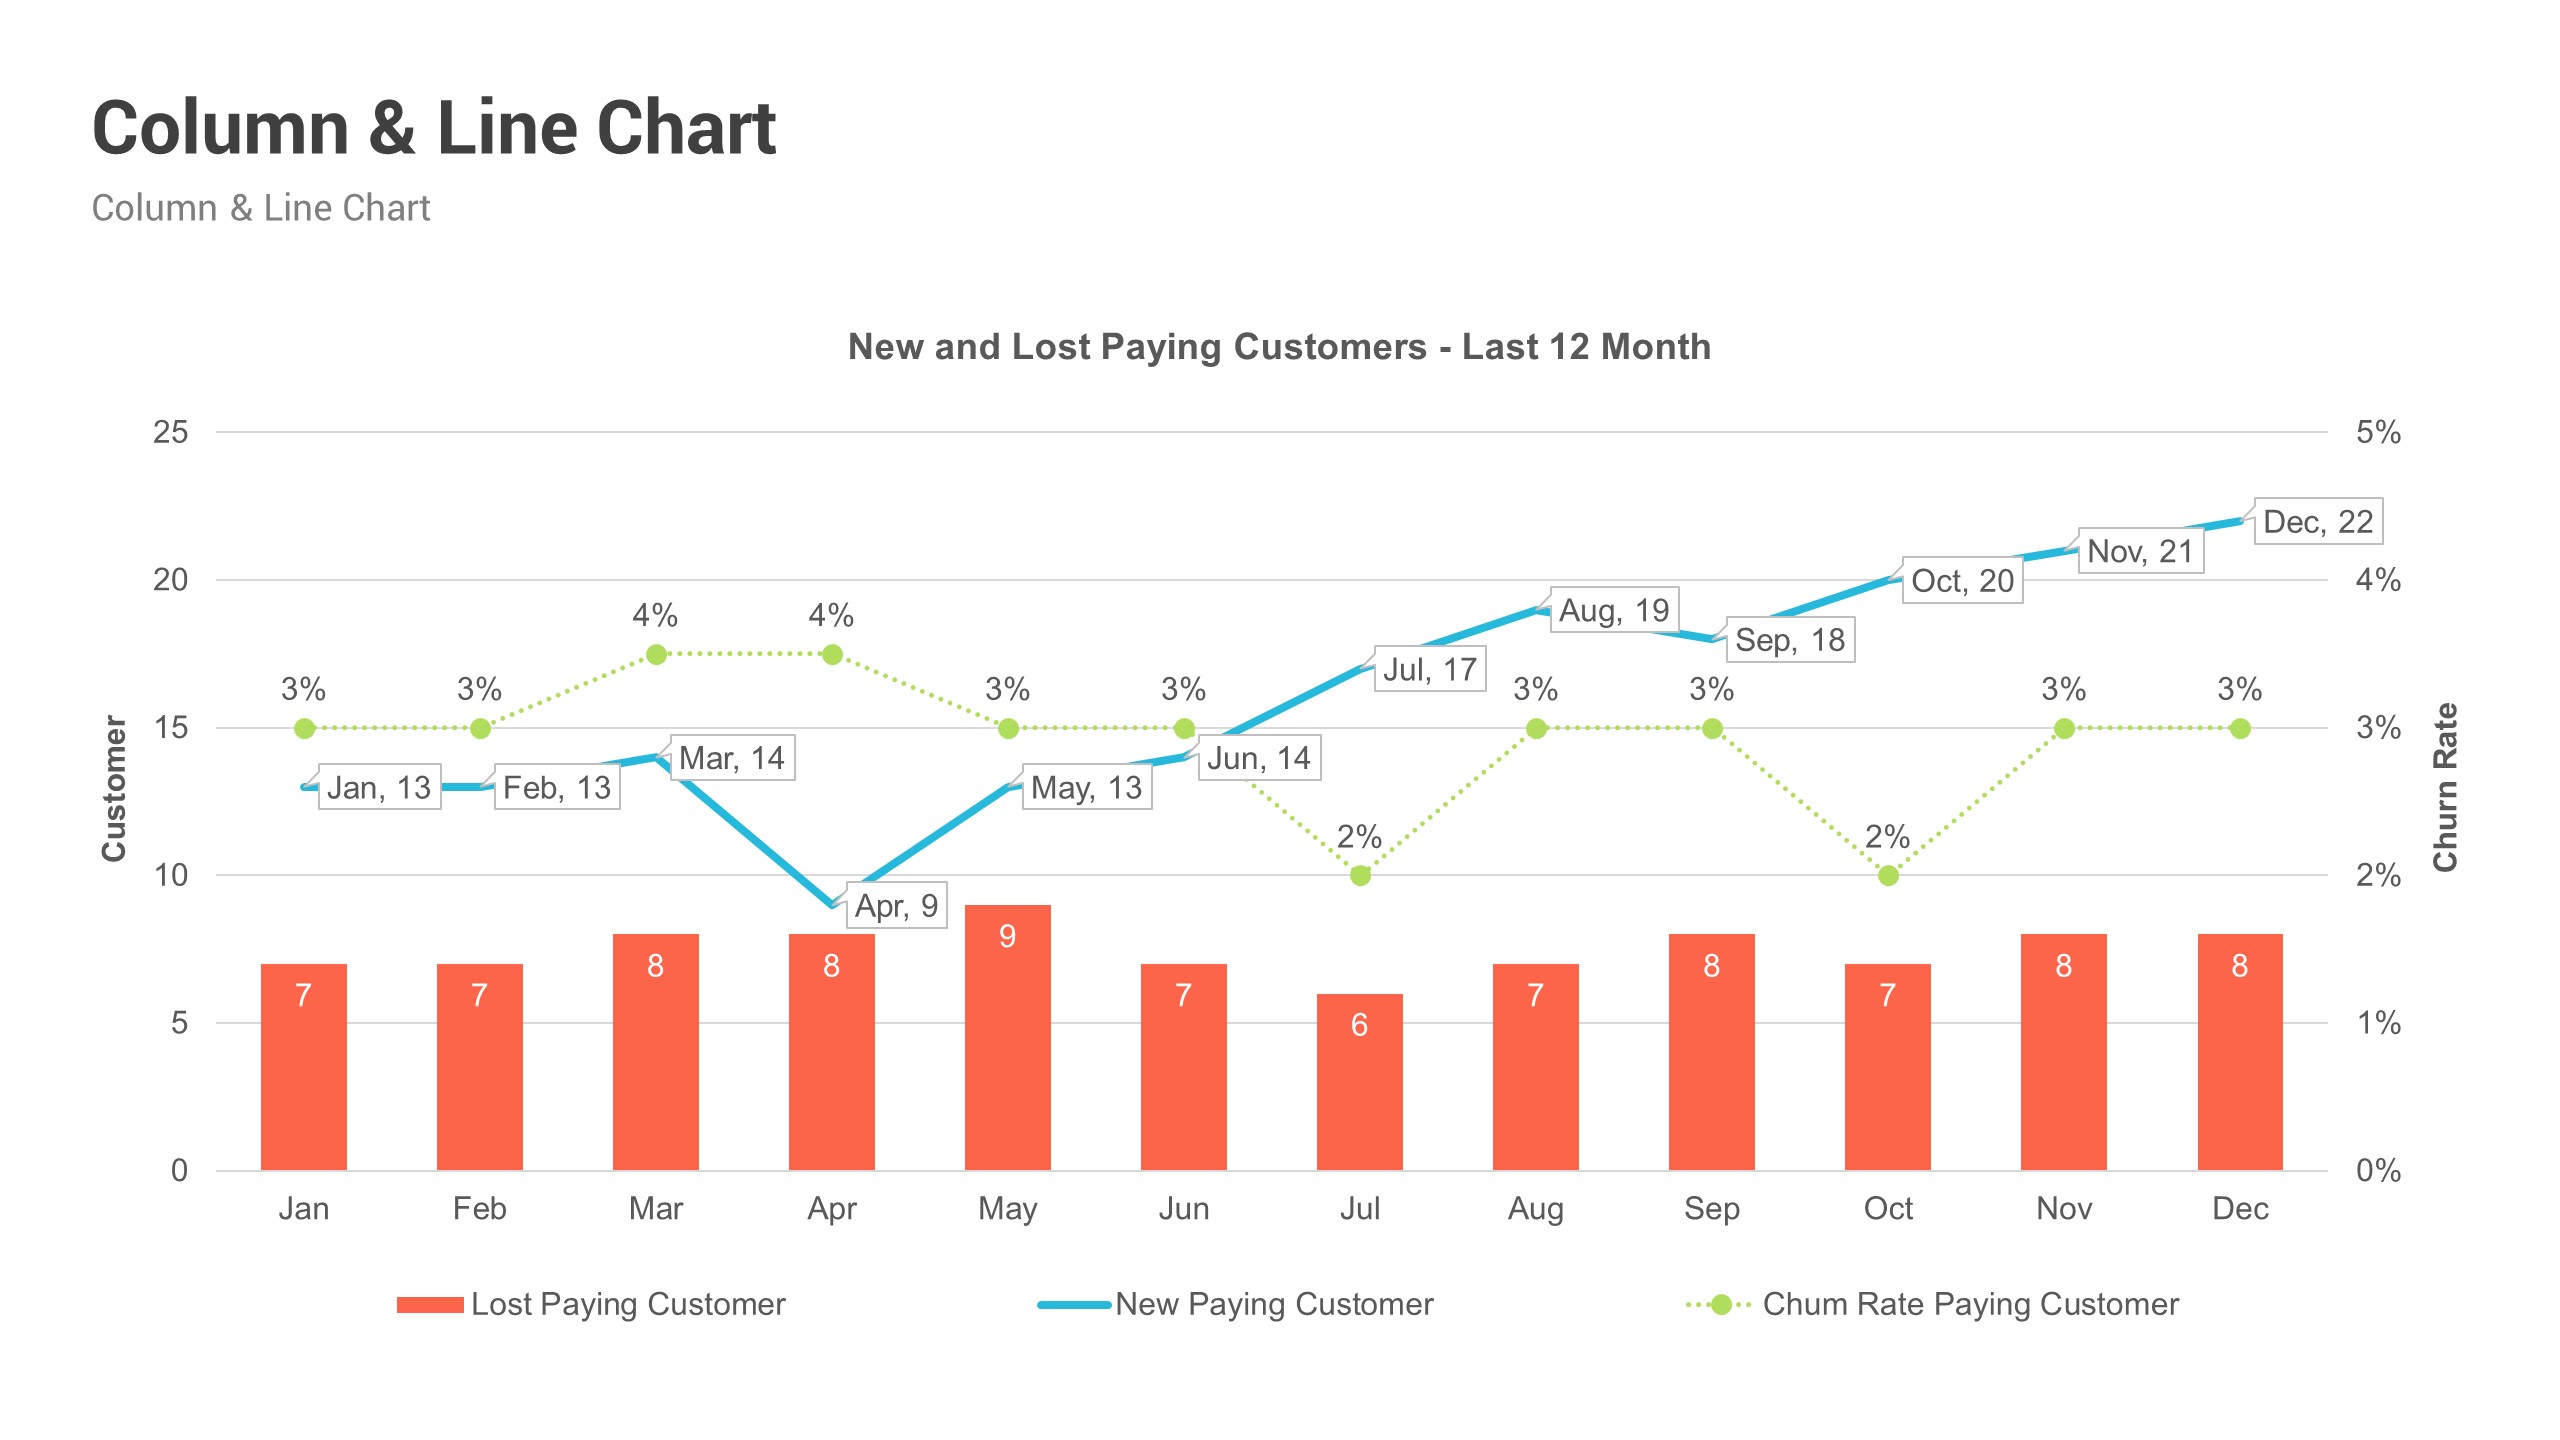
- Customer Retention Dashboard
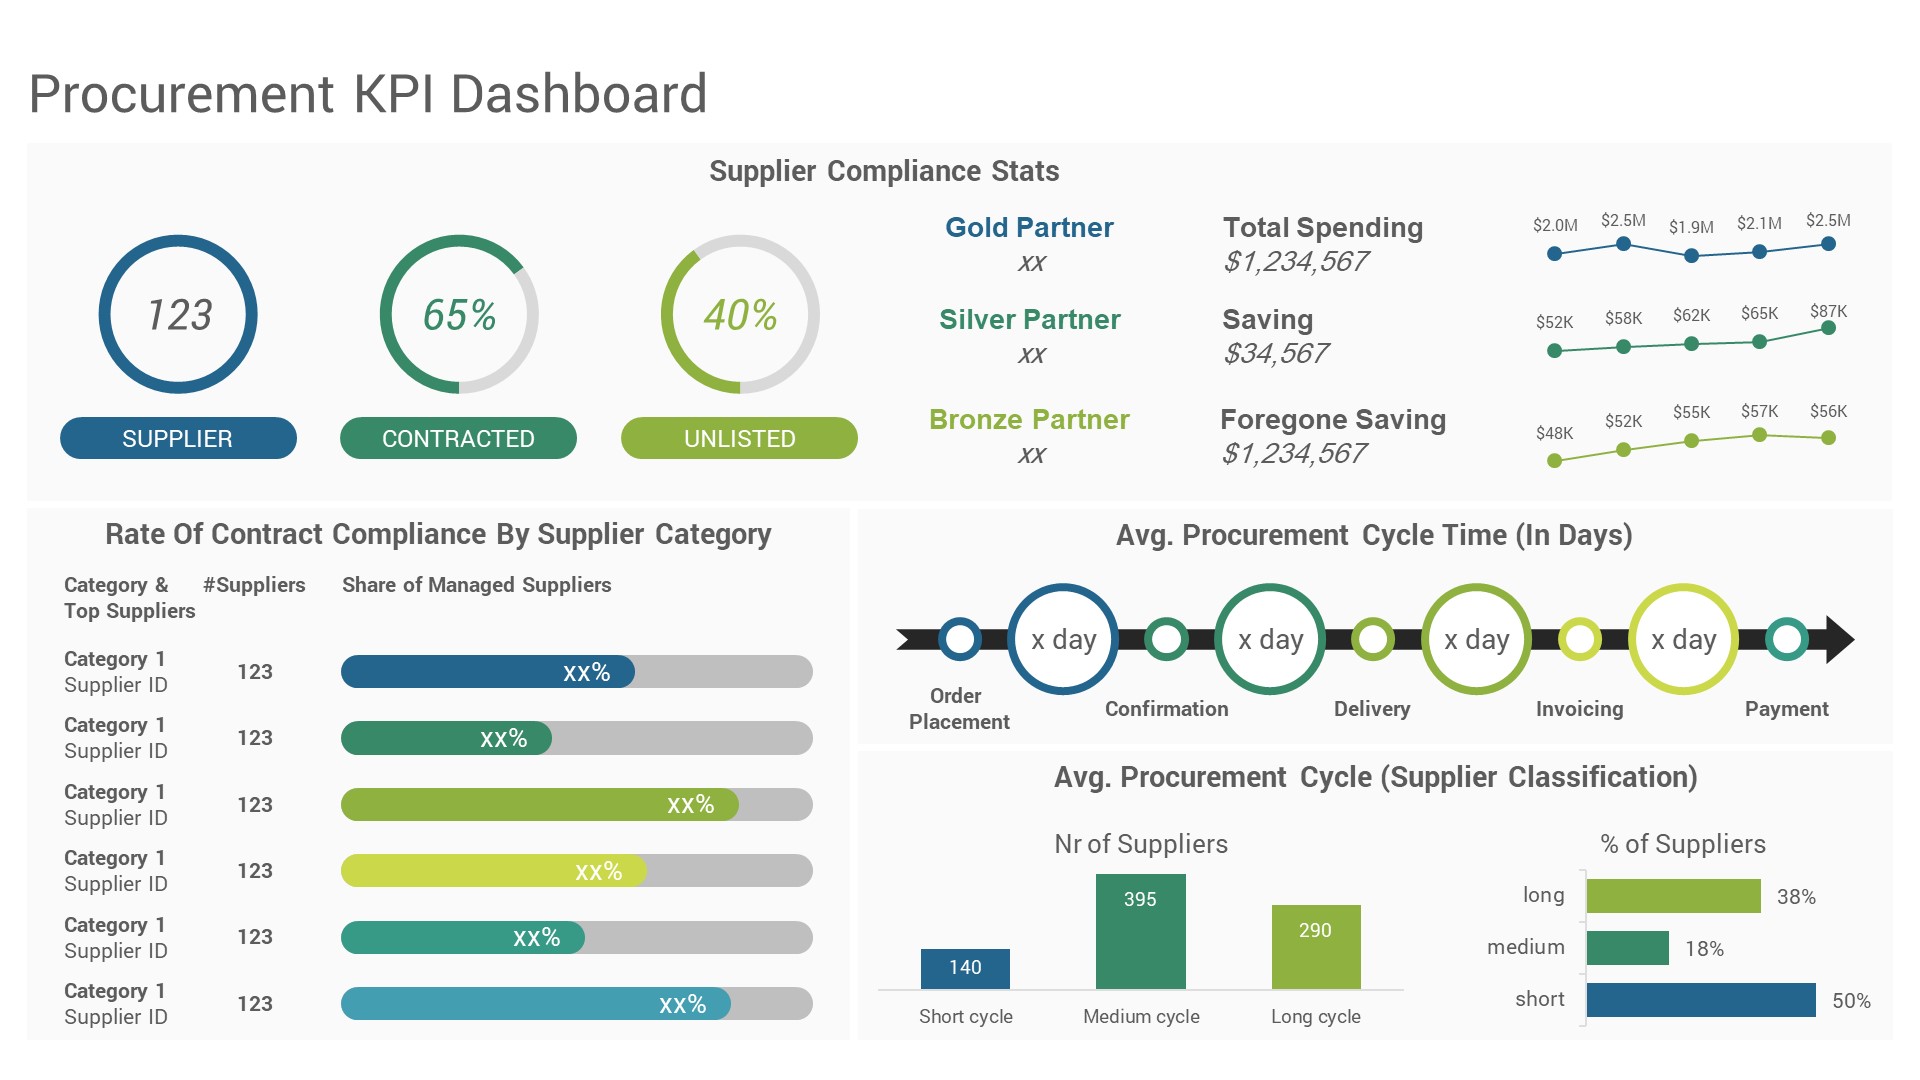
- Procurement KPI Dashboard
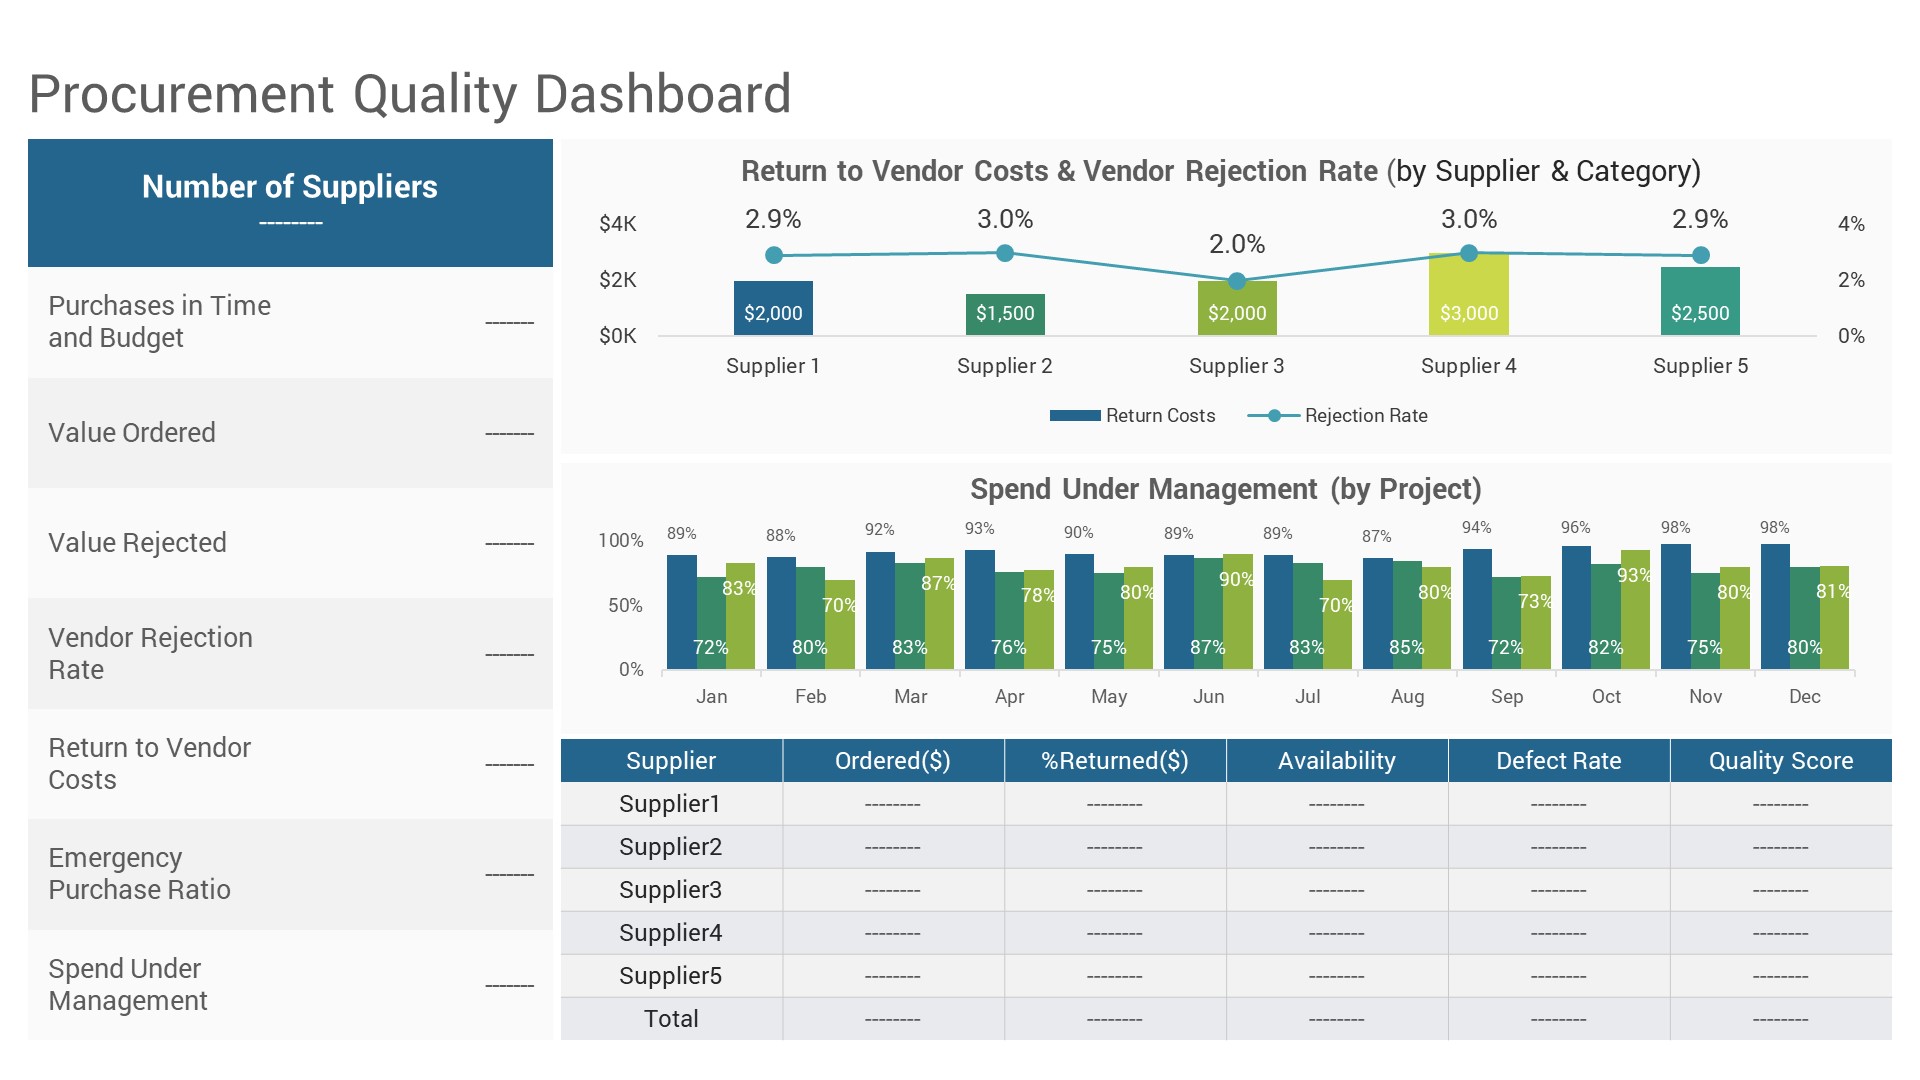
- Procurement Quality Dashboard
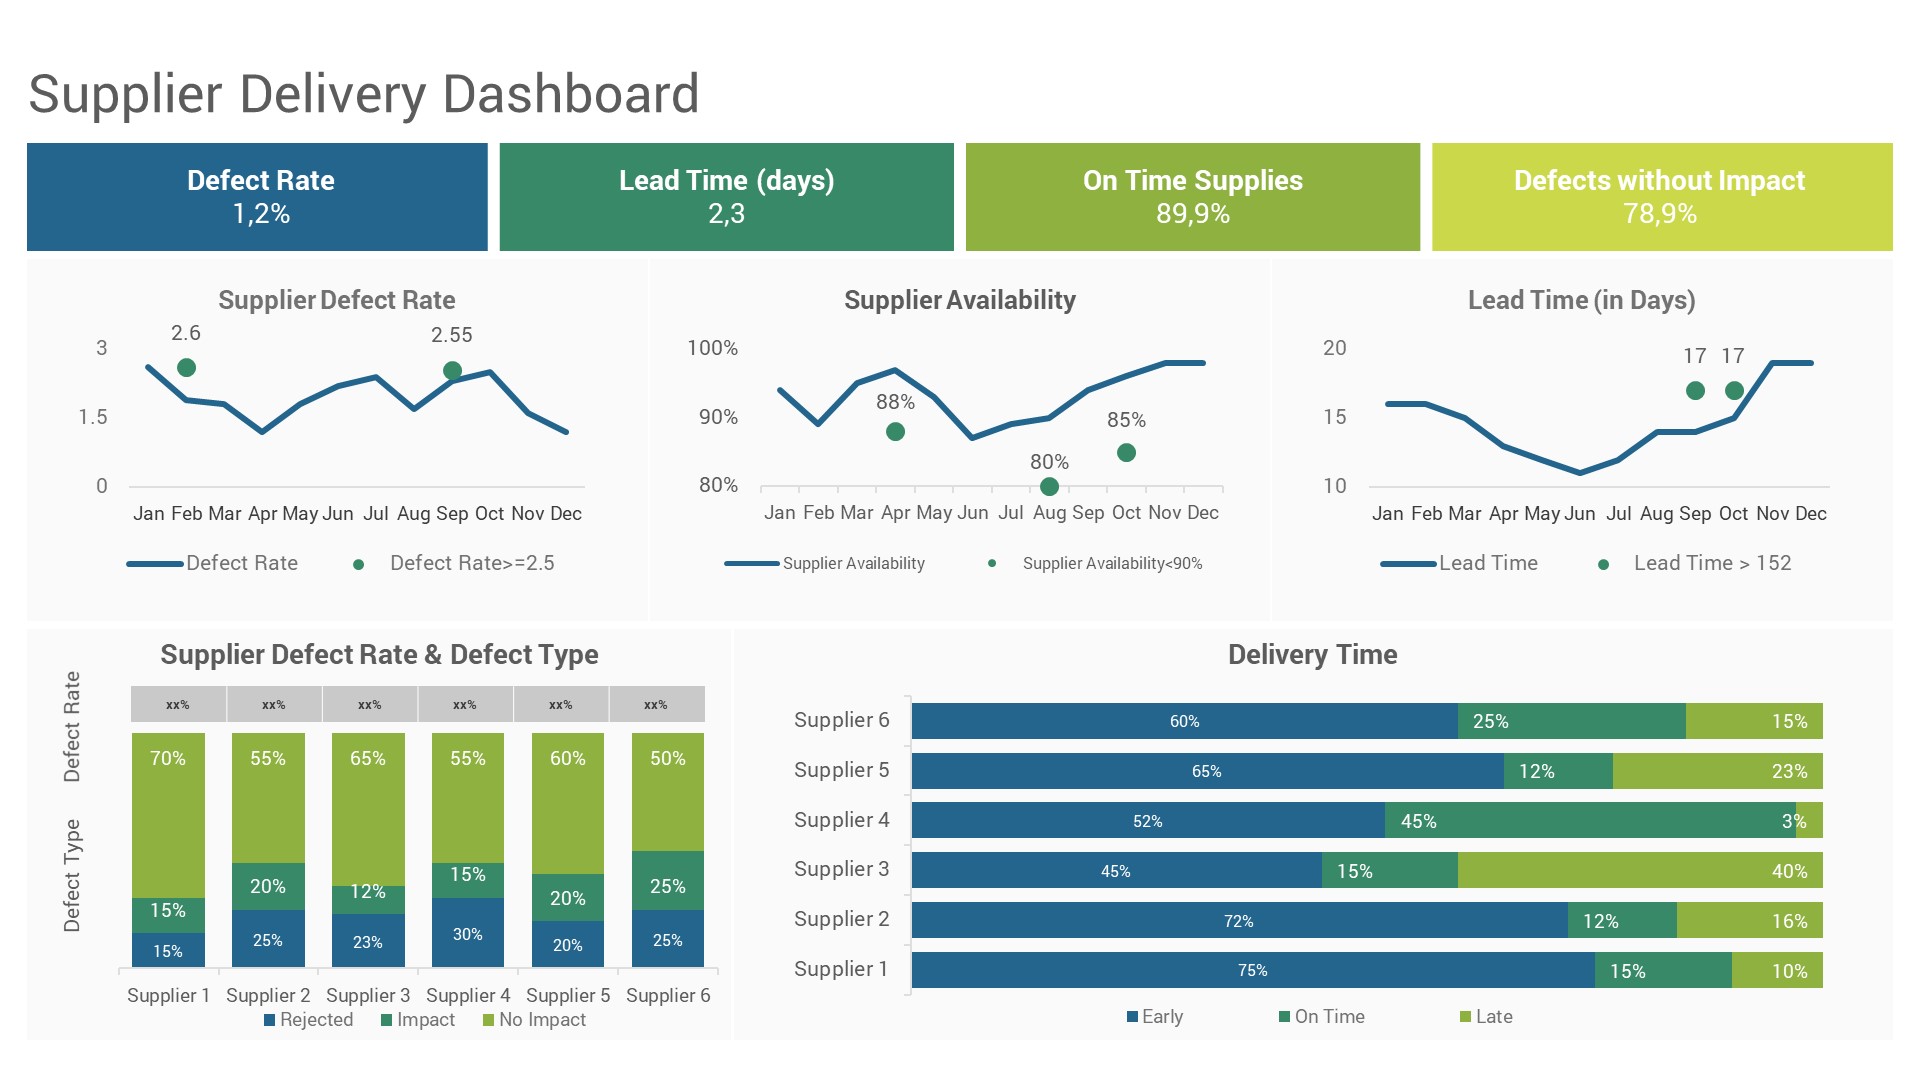
- Supplier Delivery Dashboard
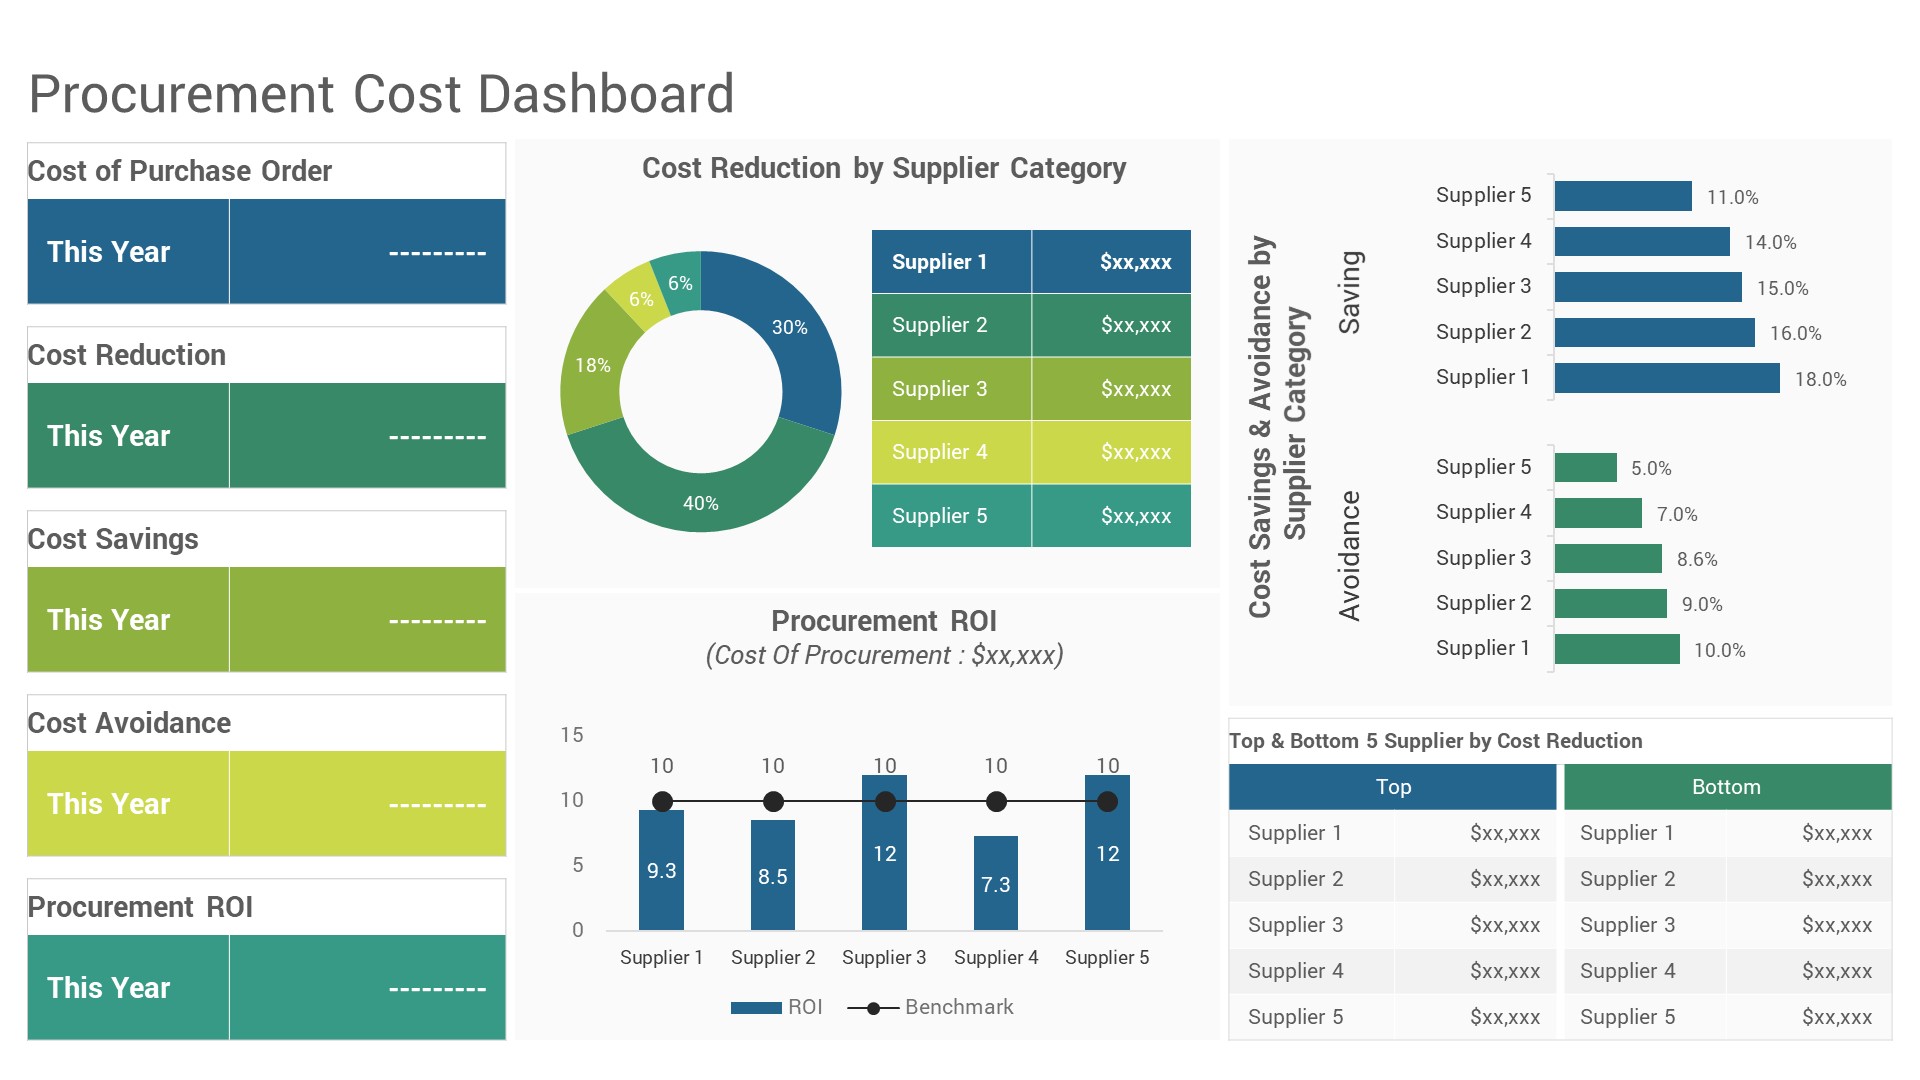
- Procurement Cost Dashboard
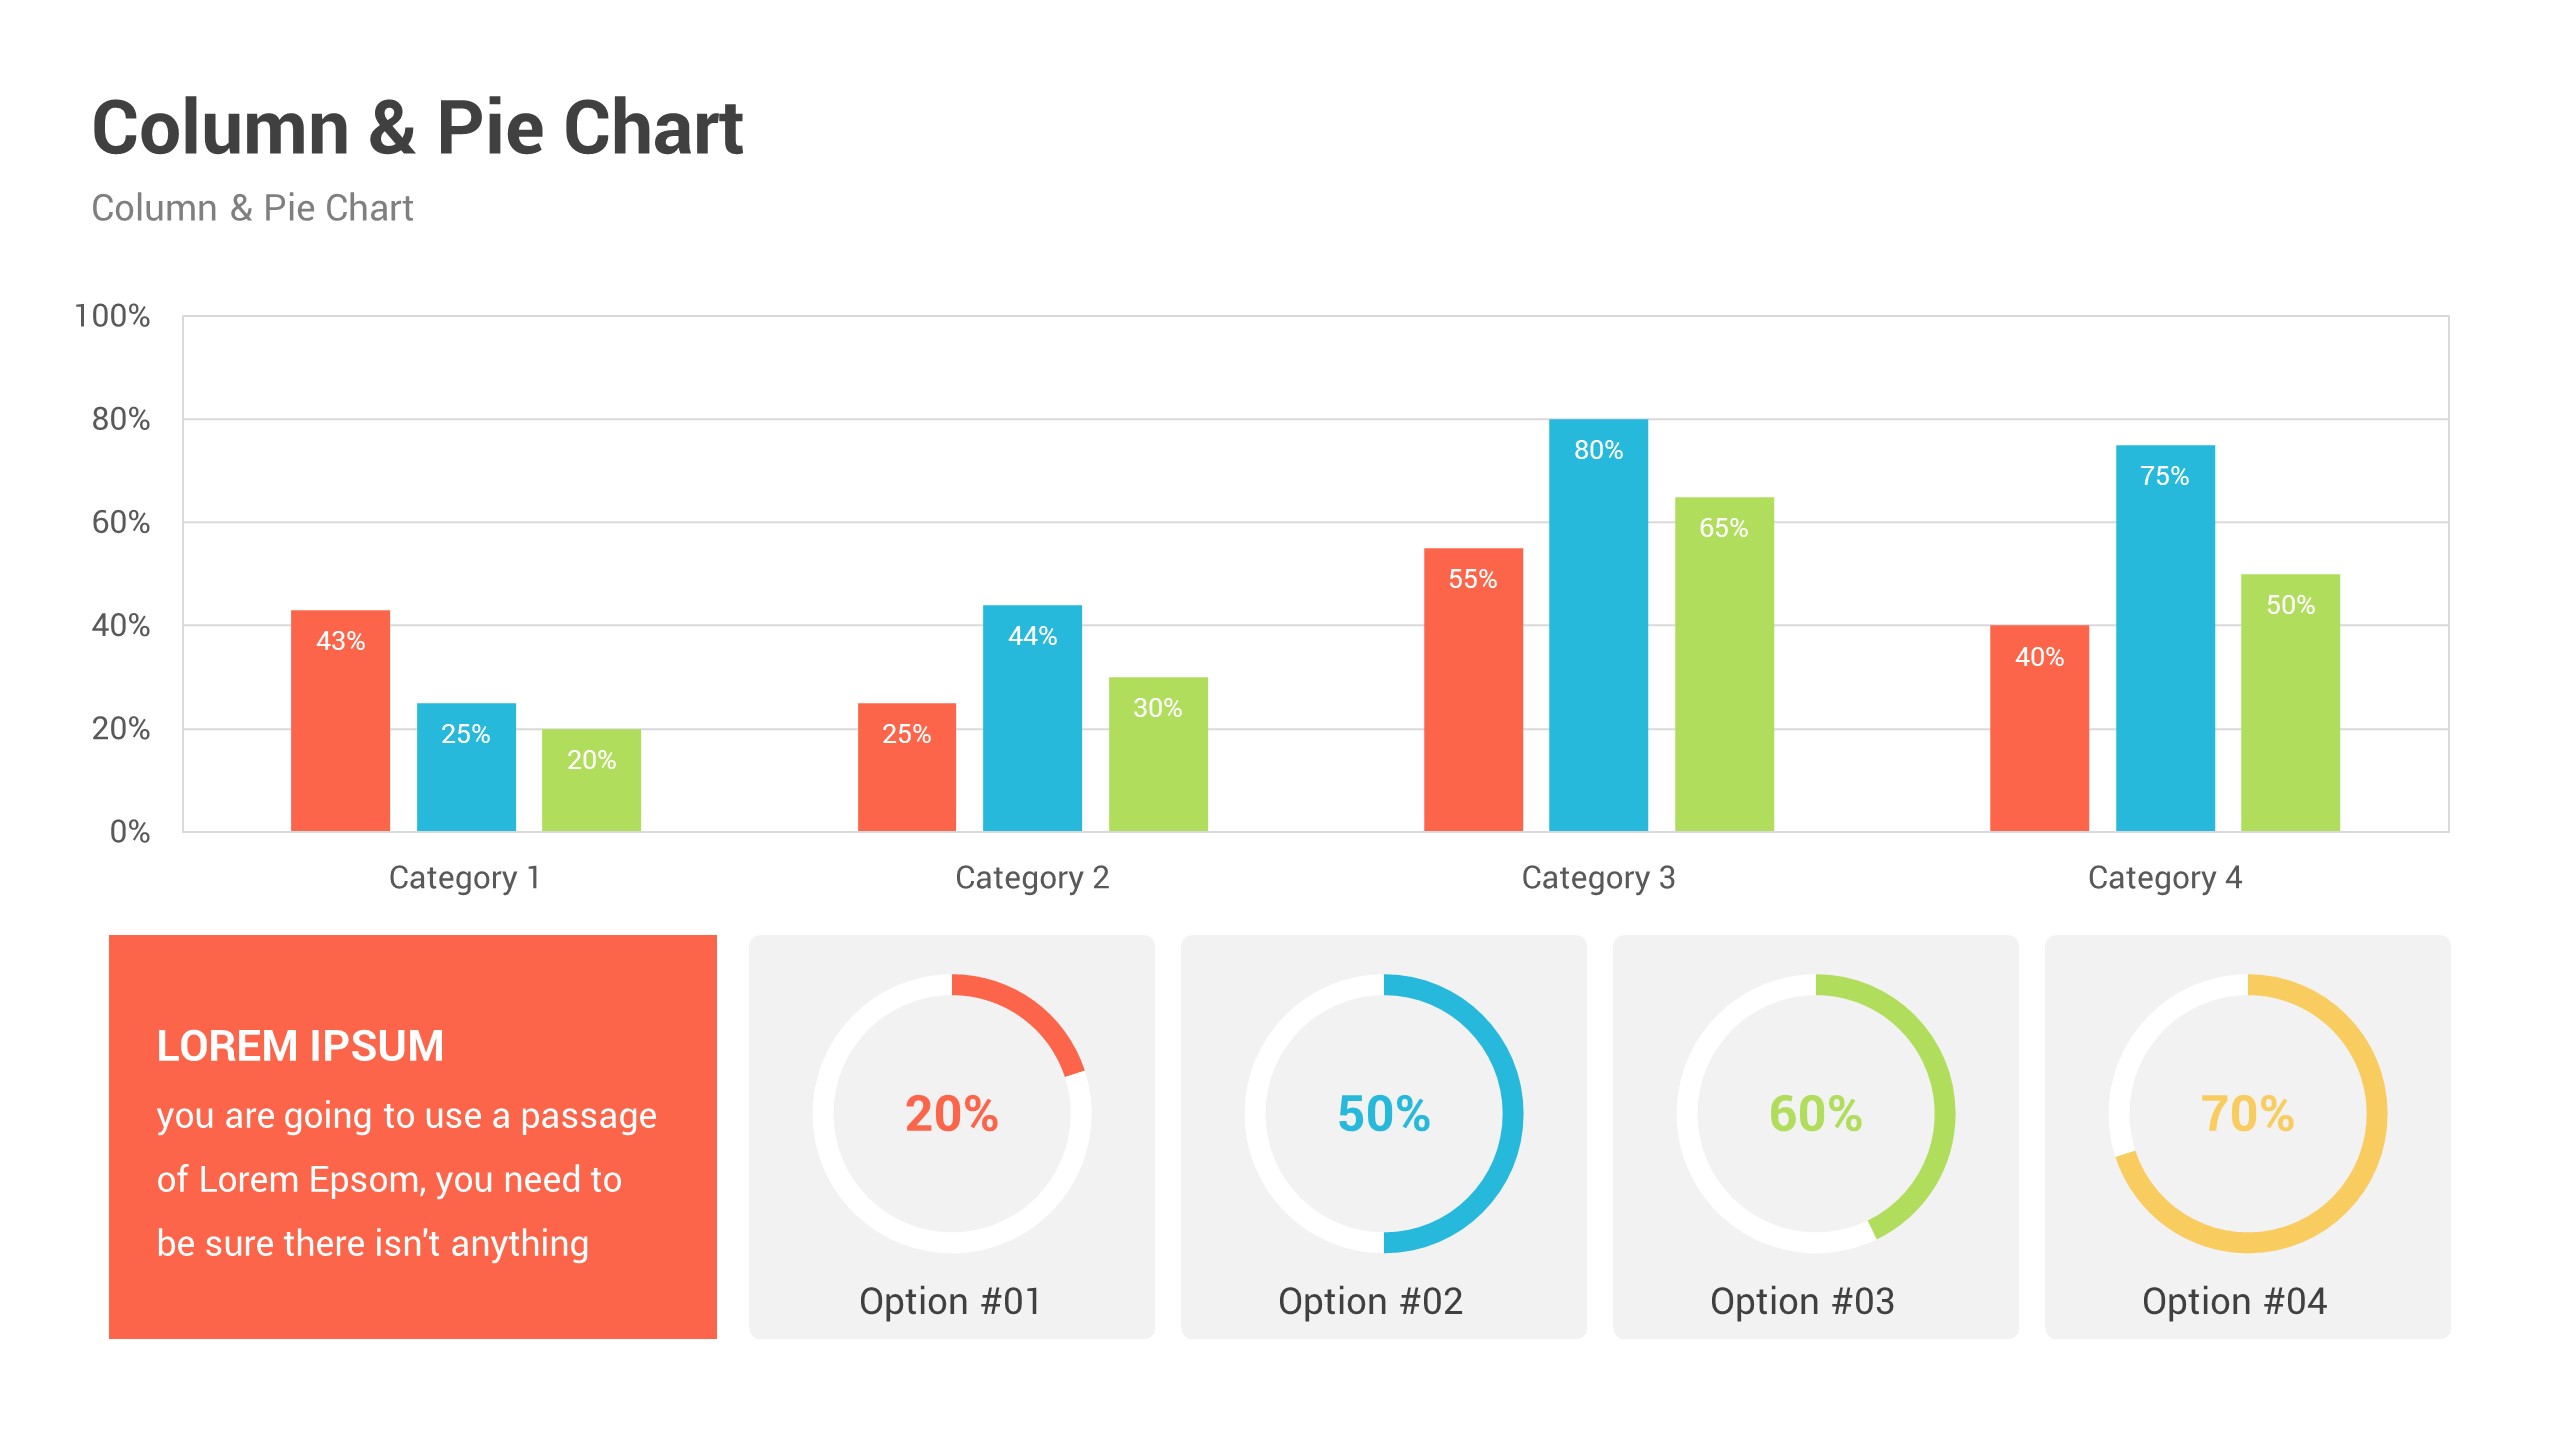
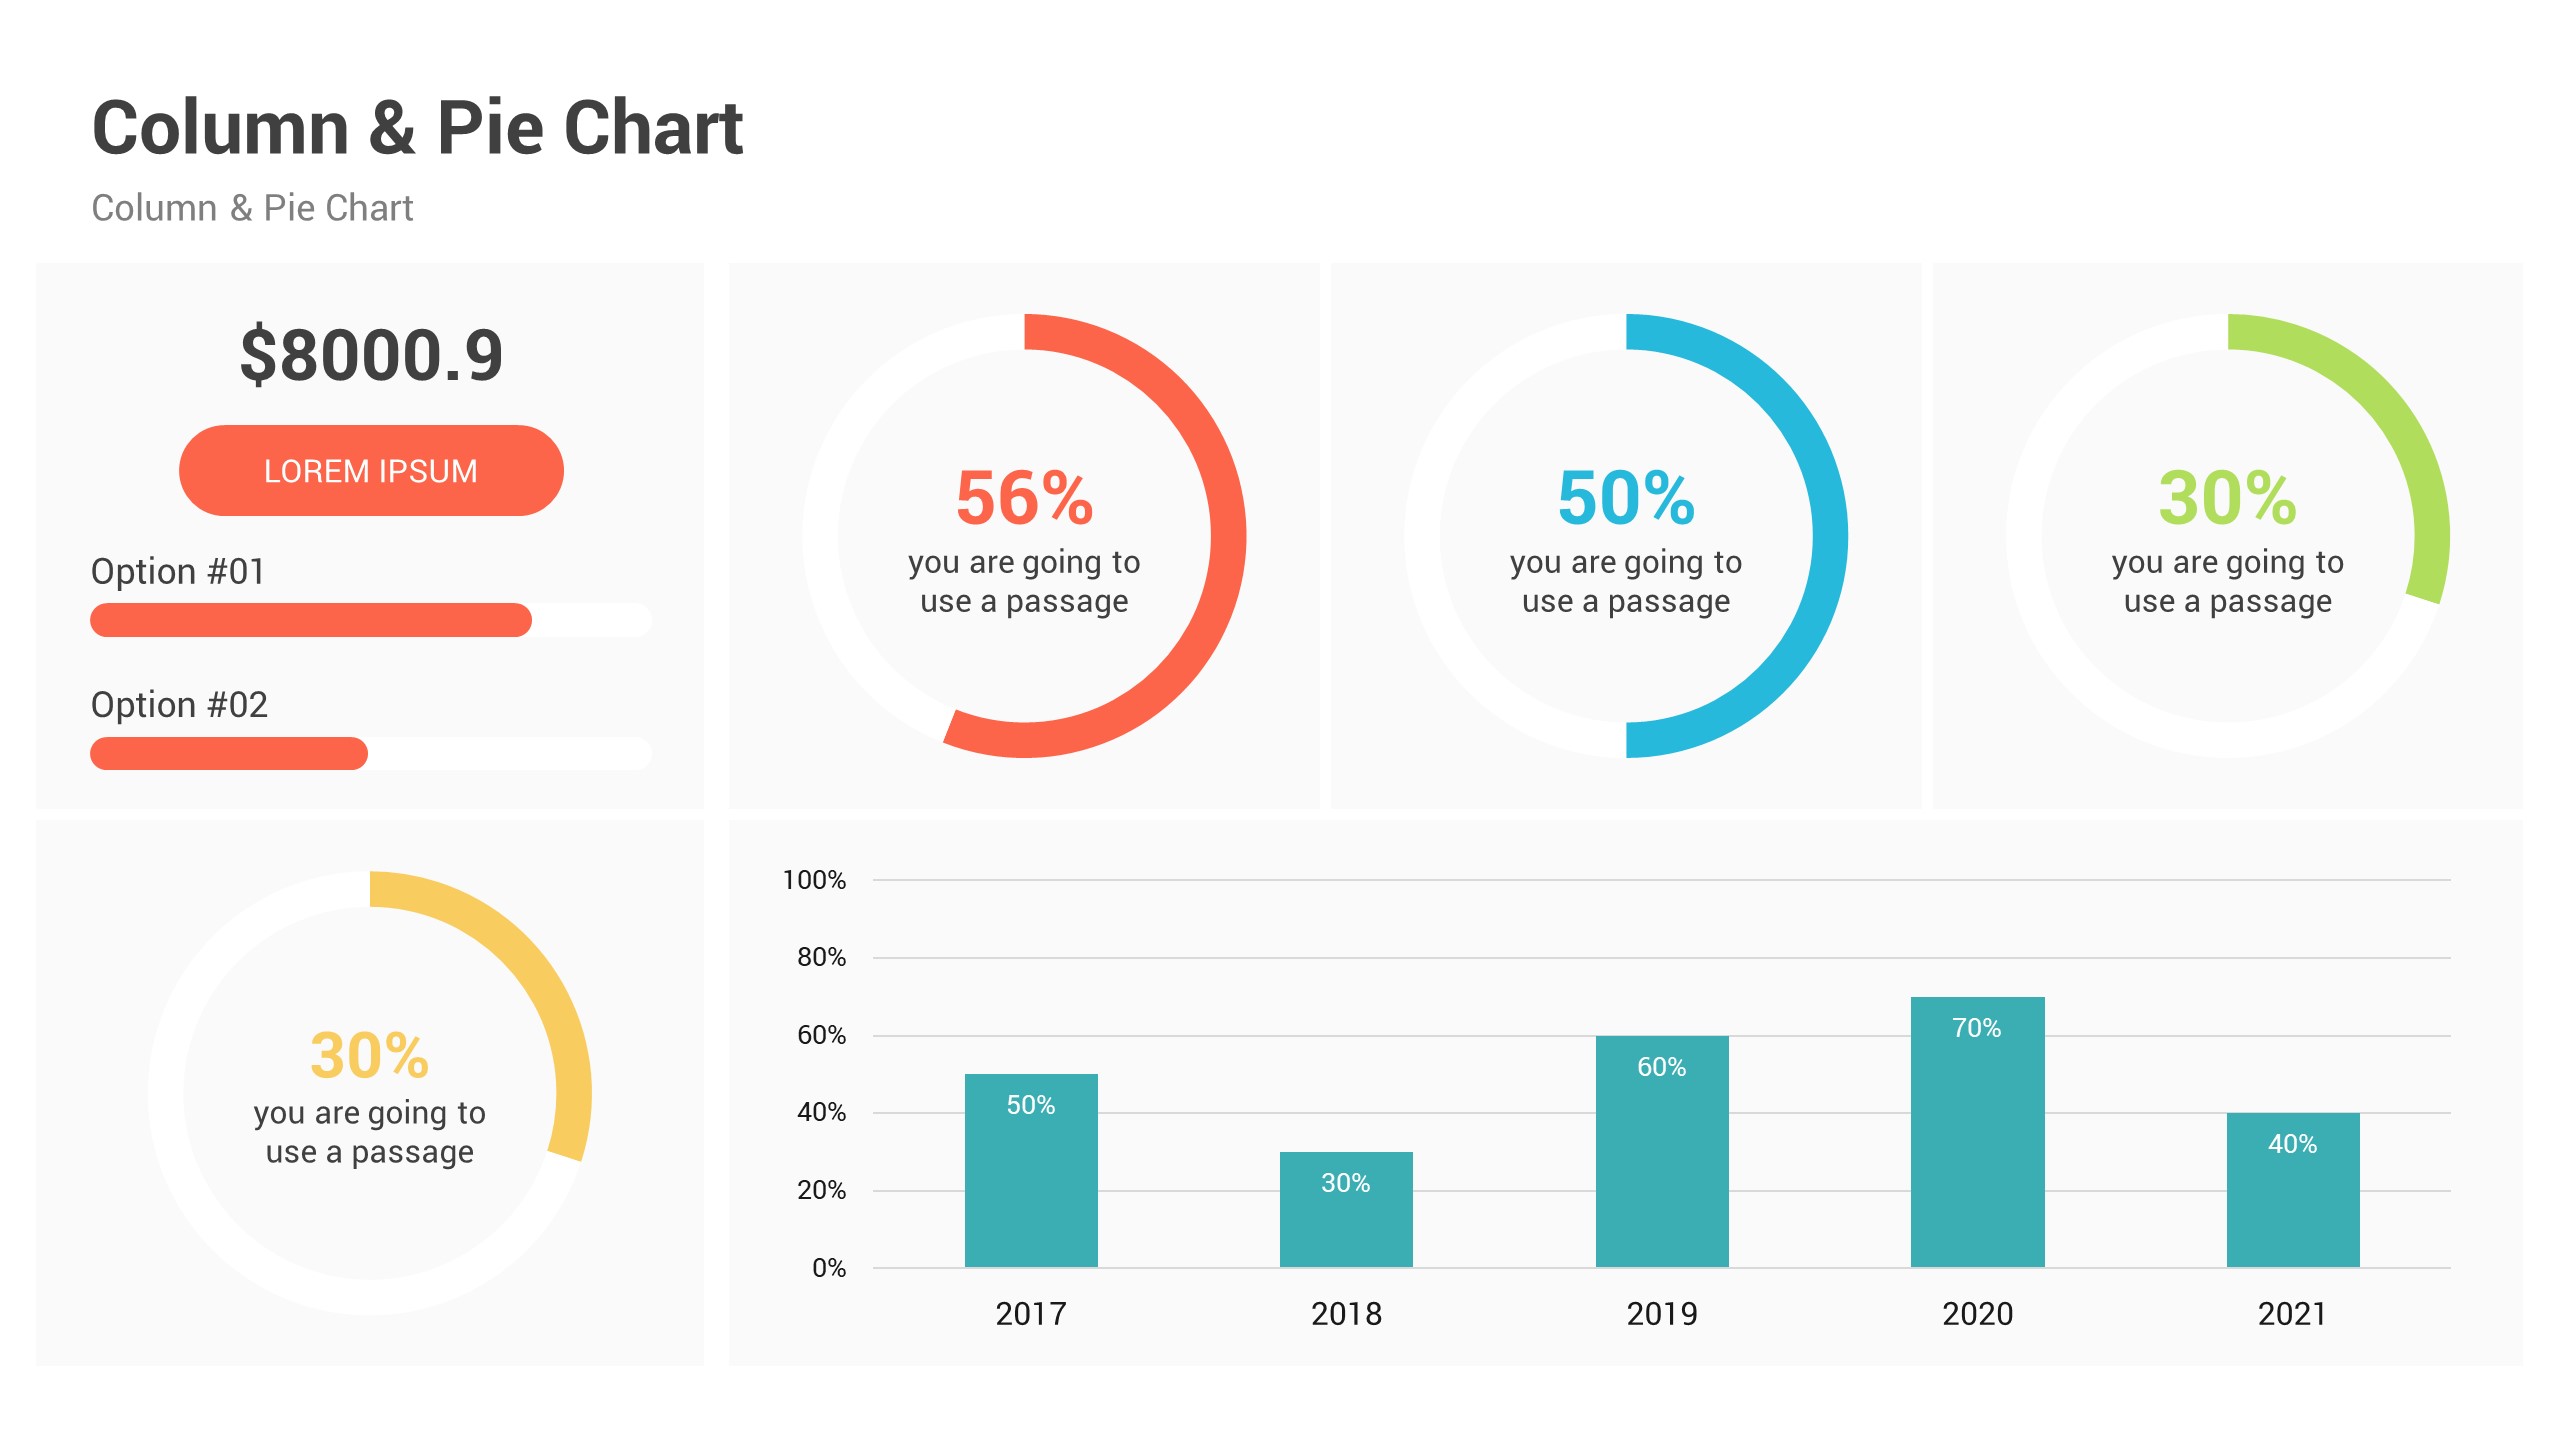
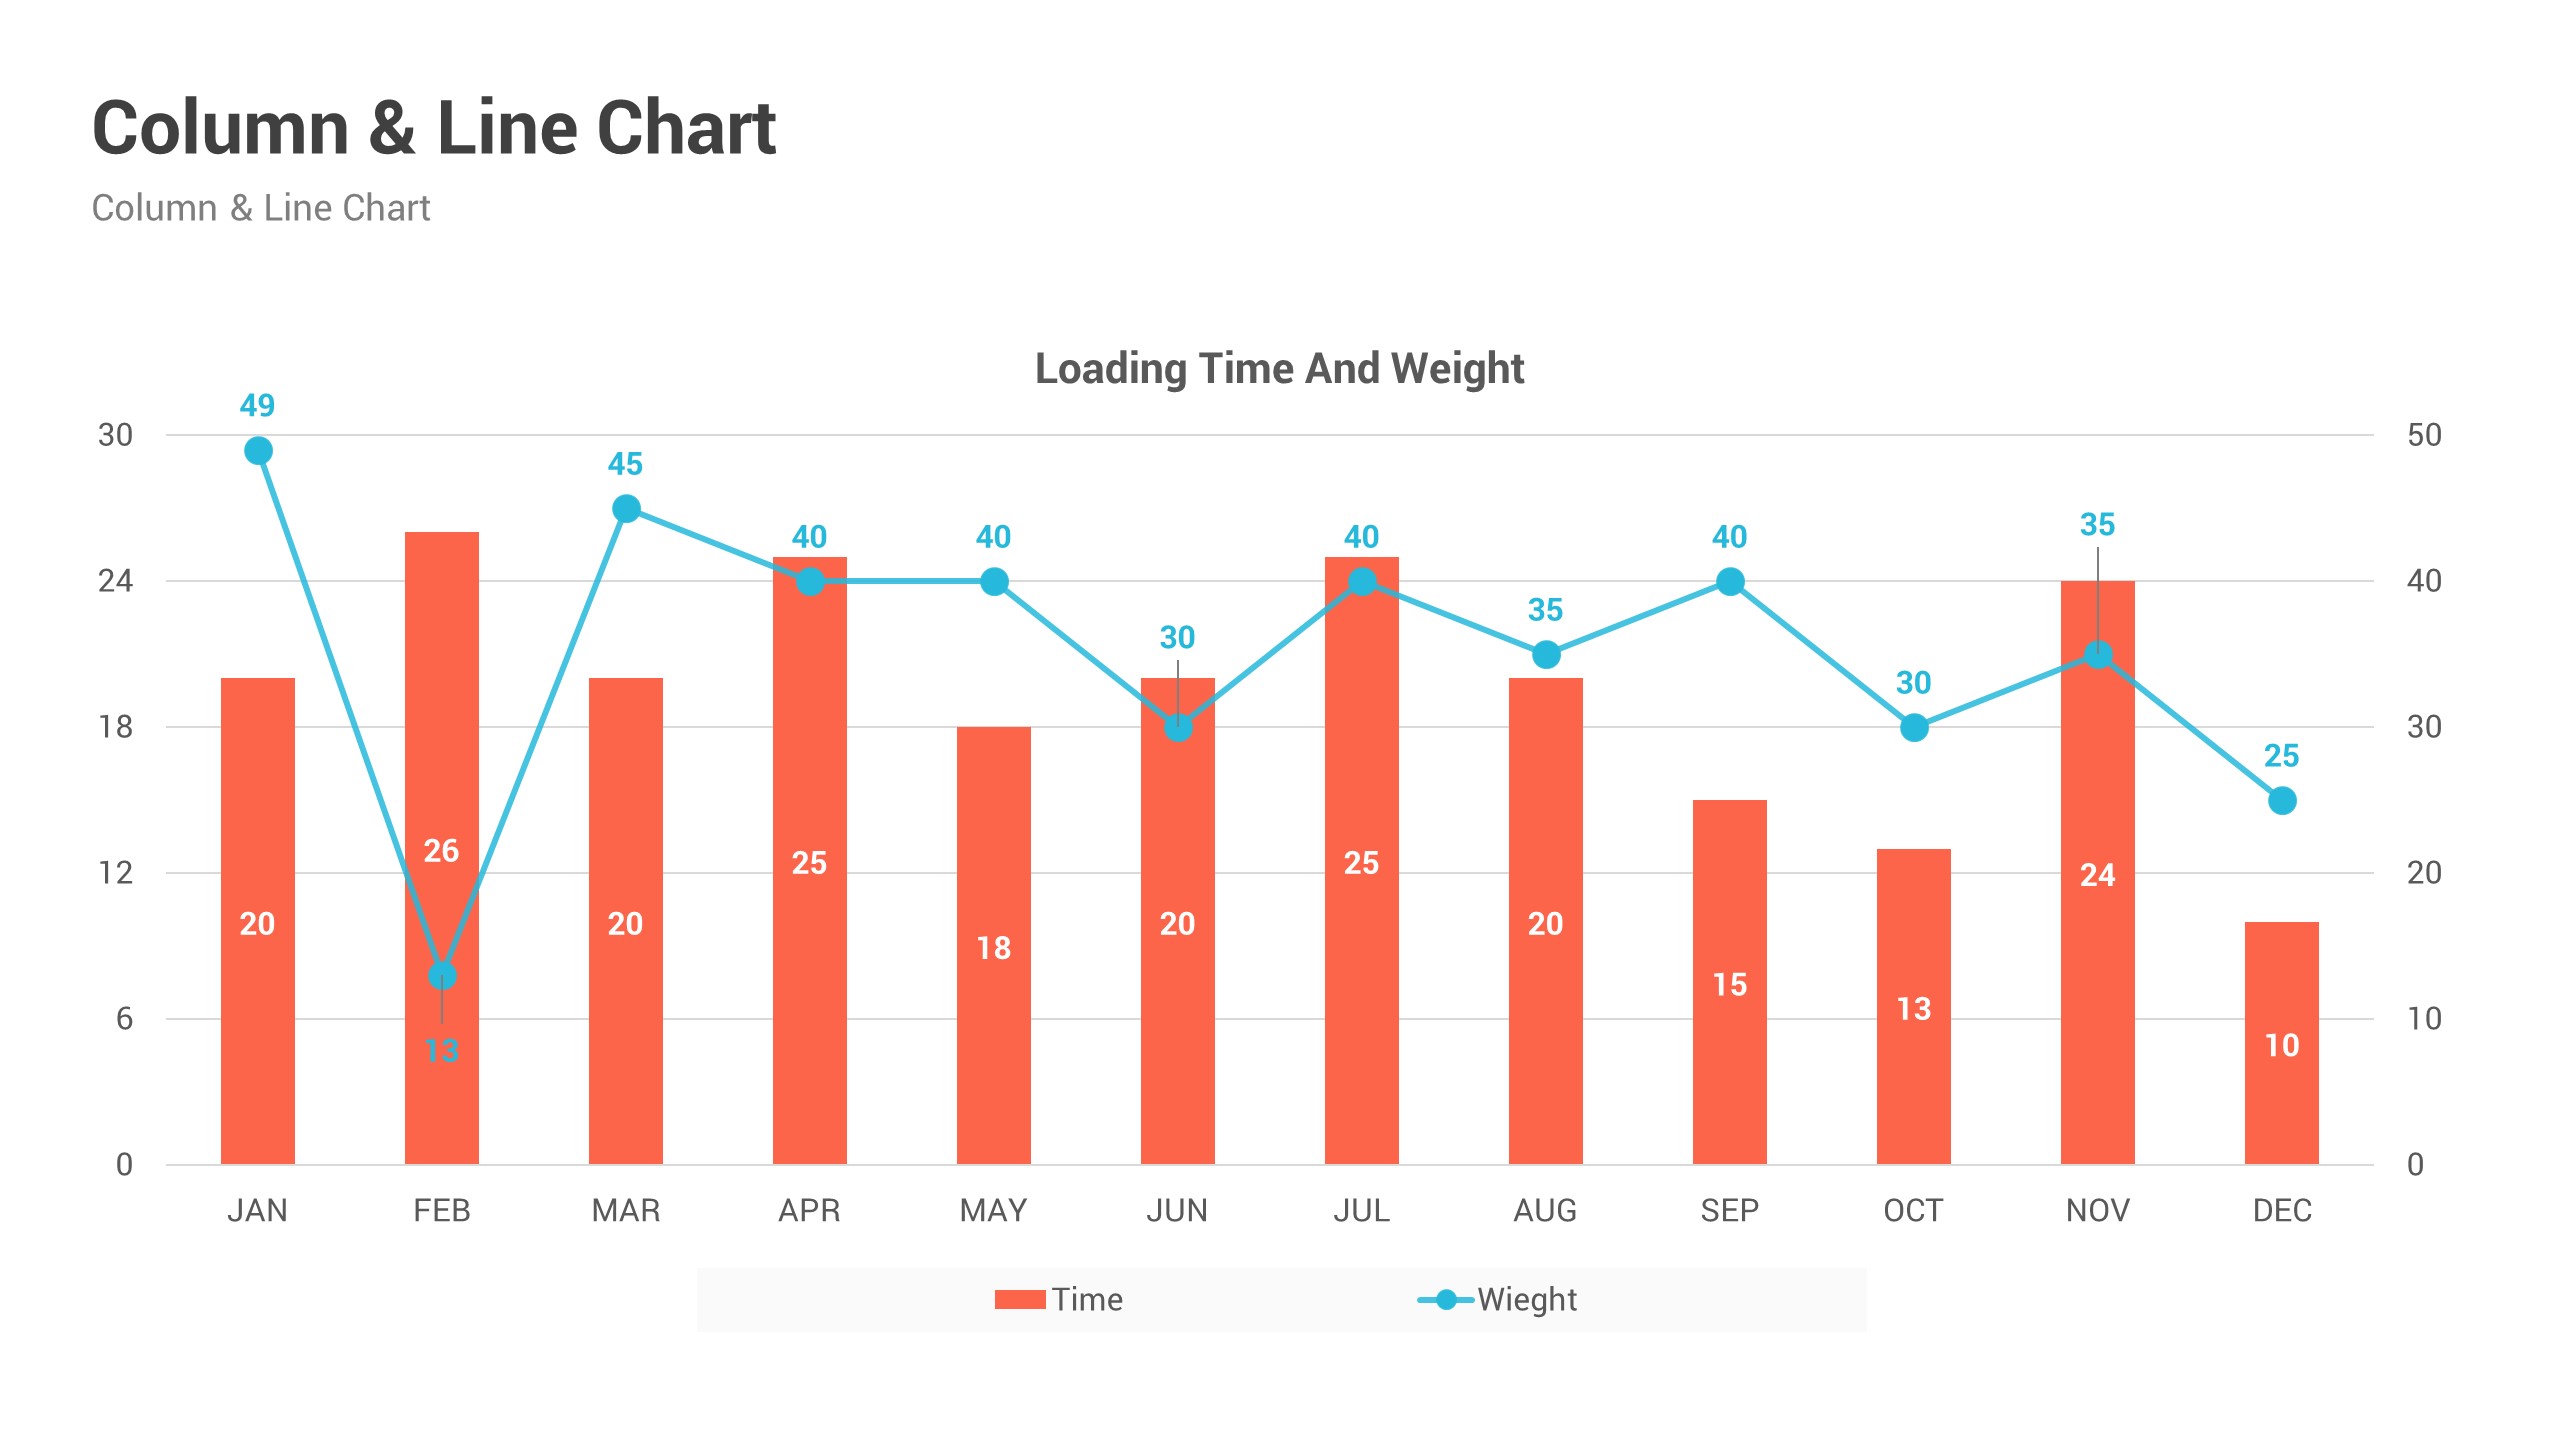
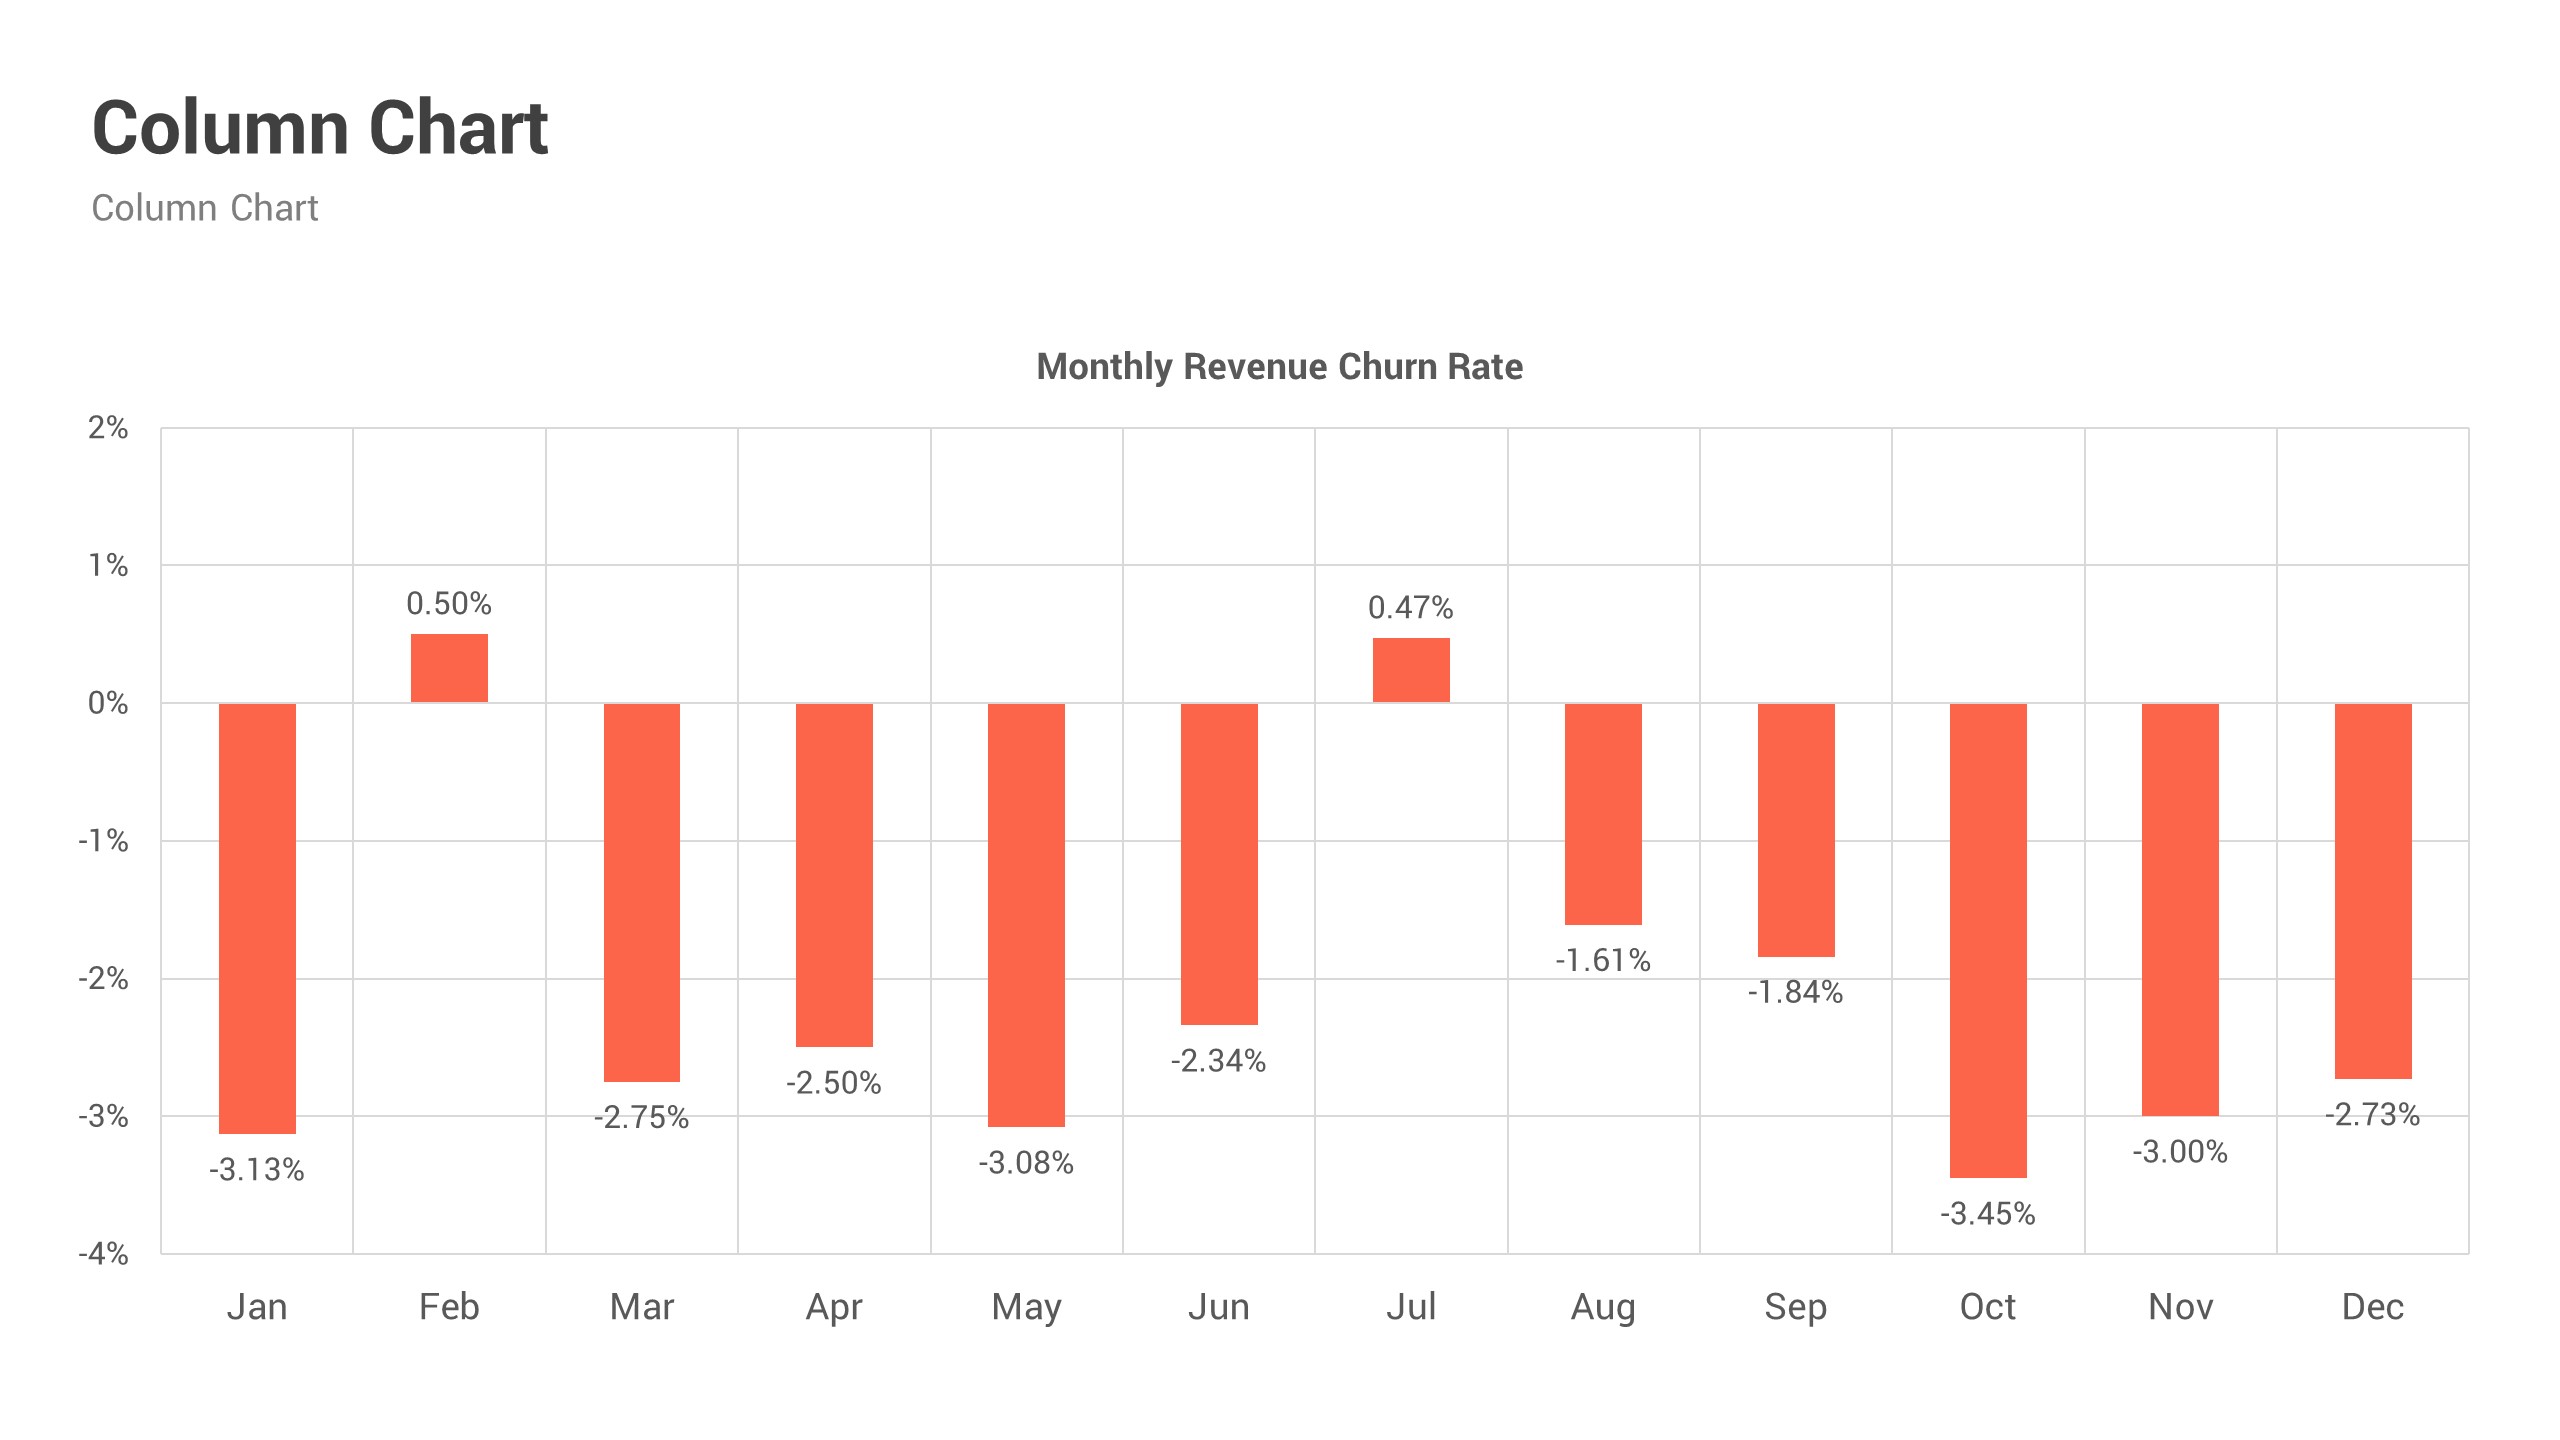
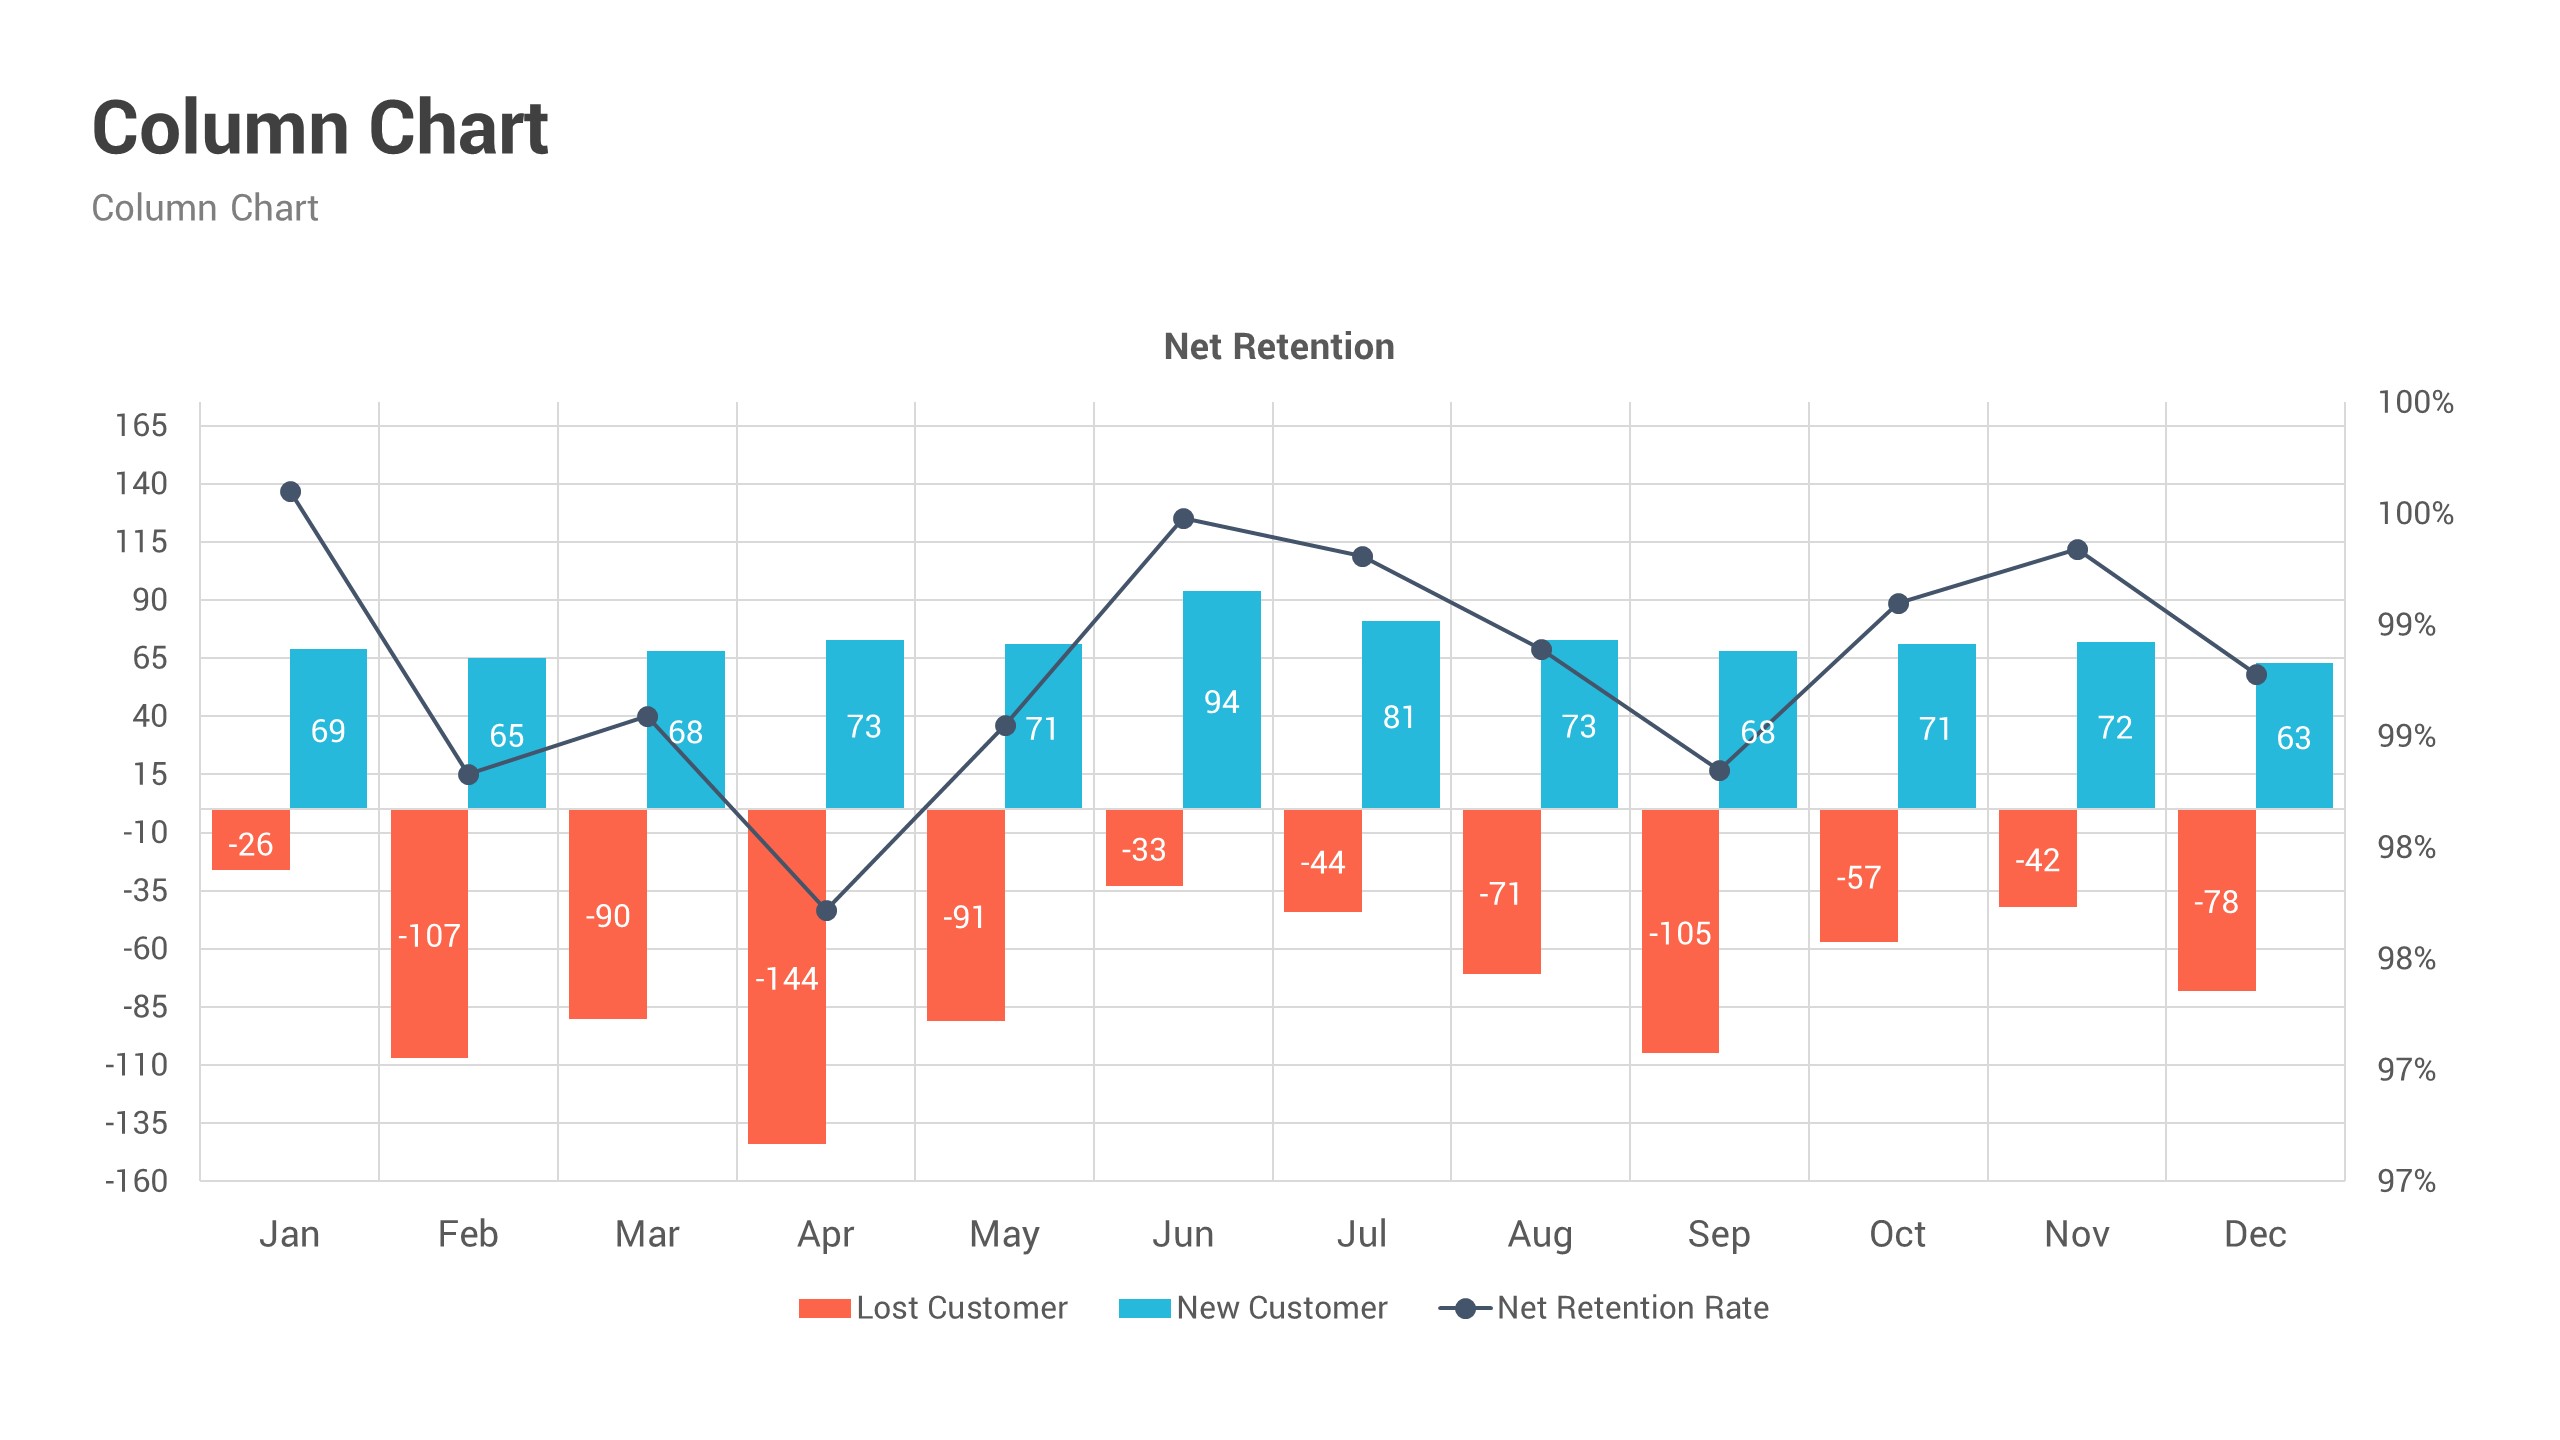
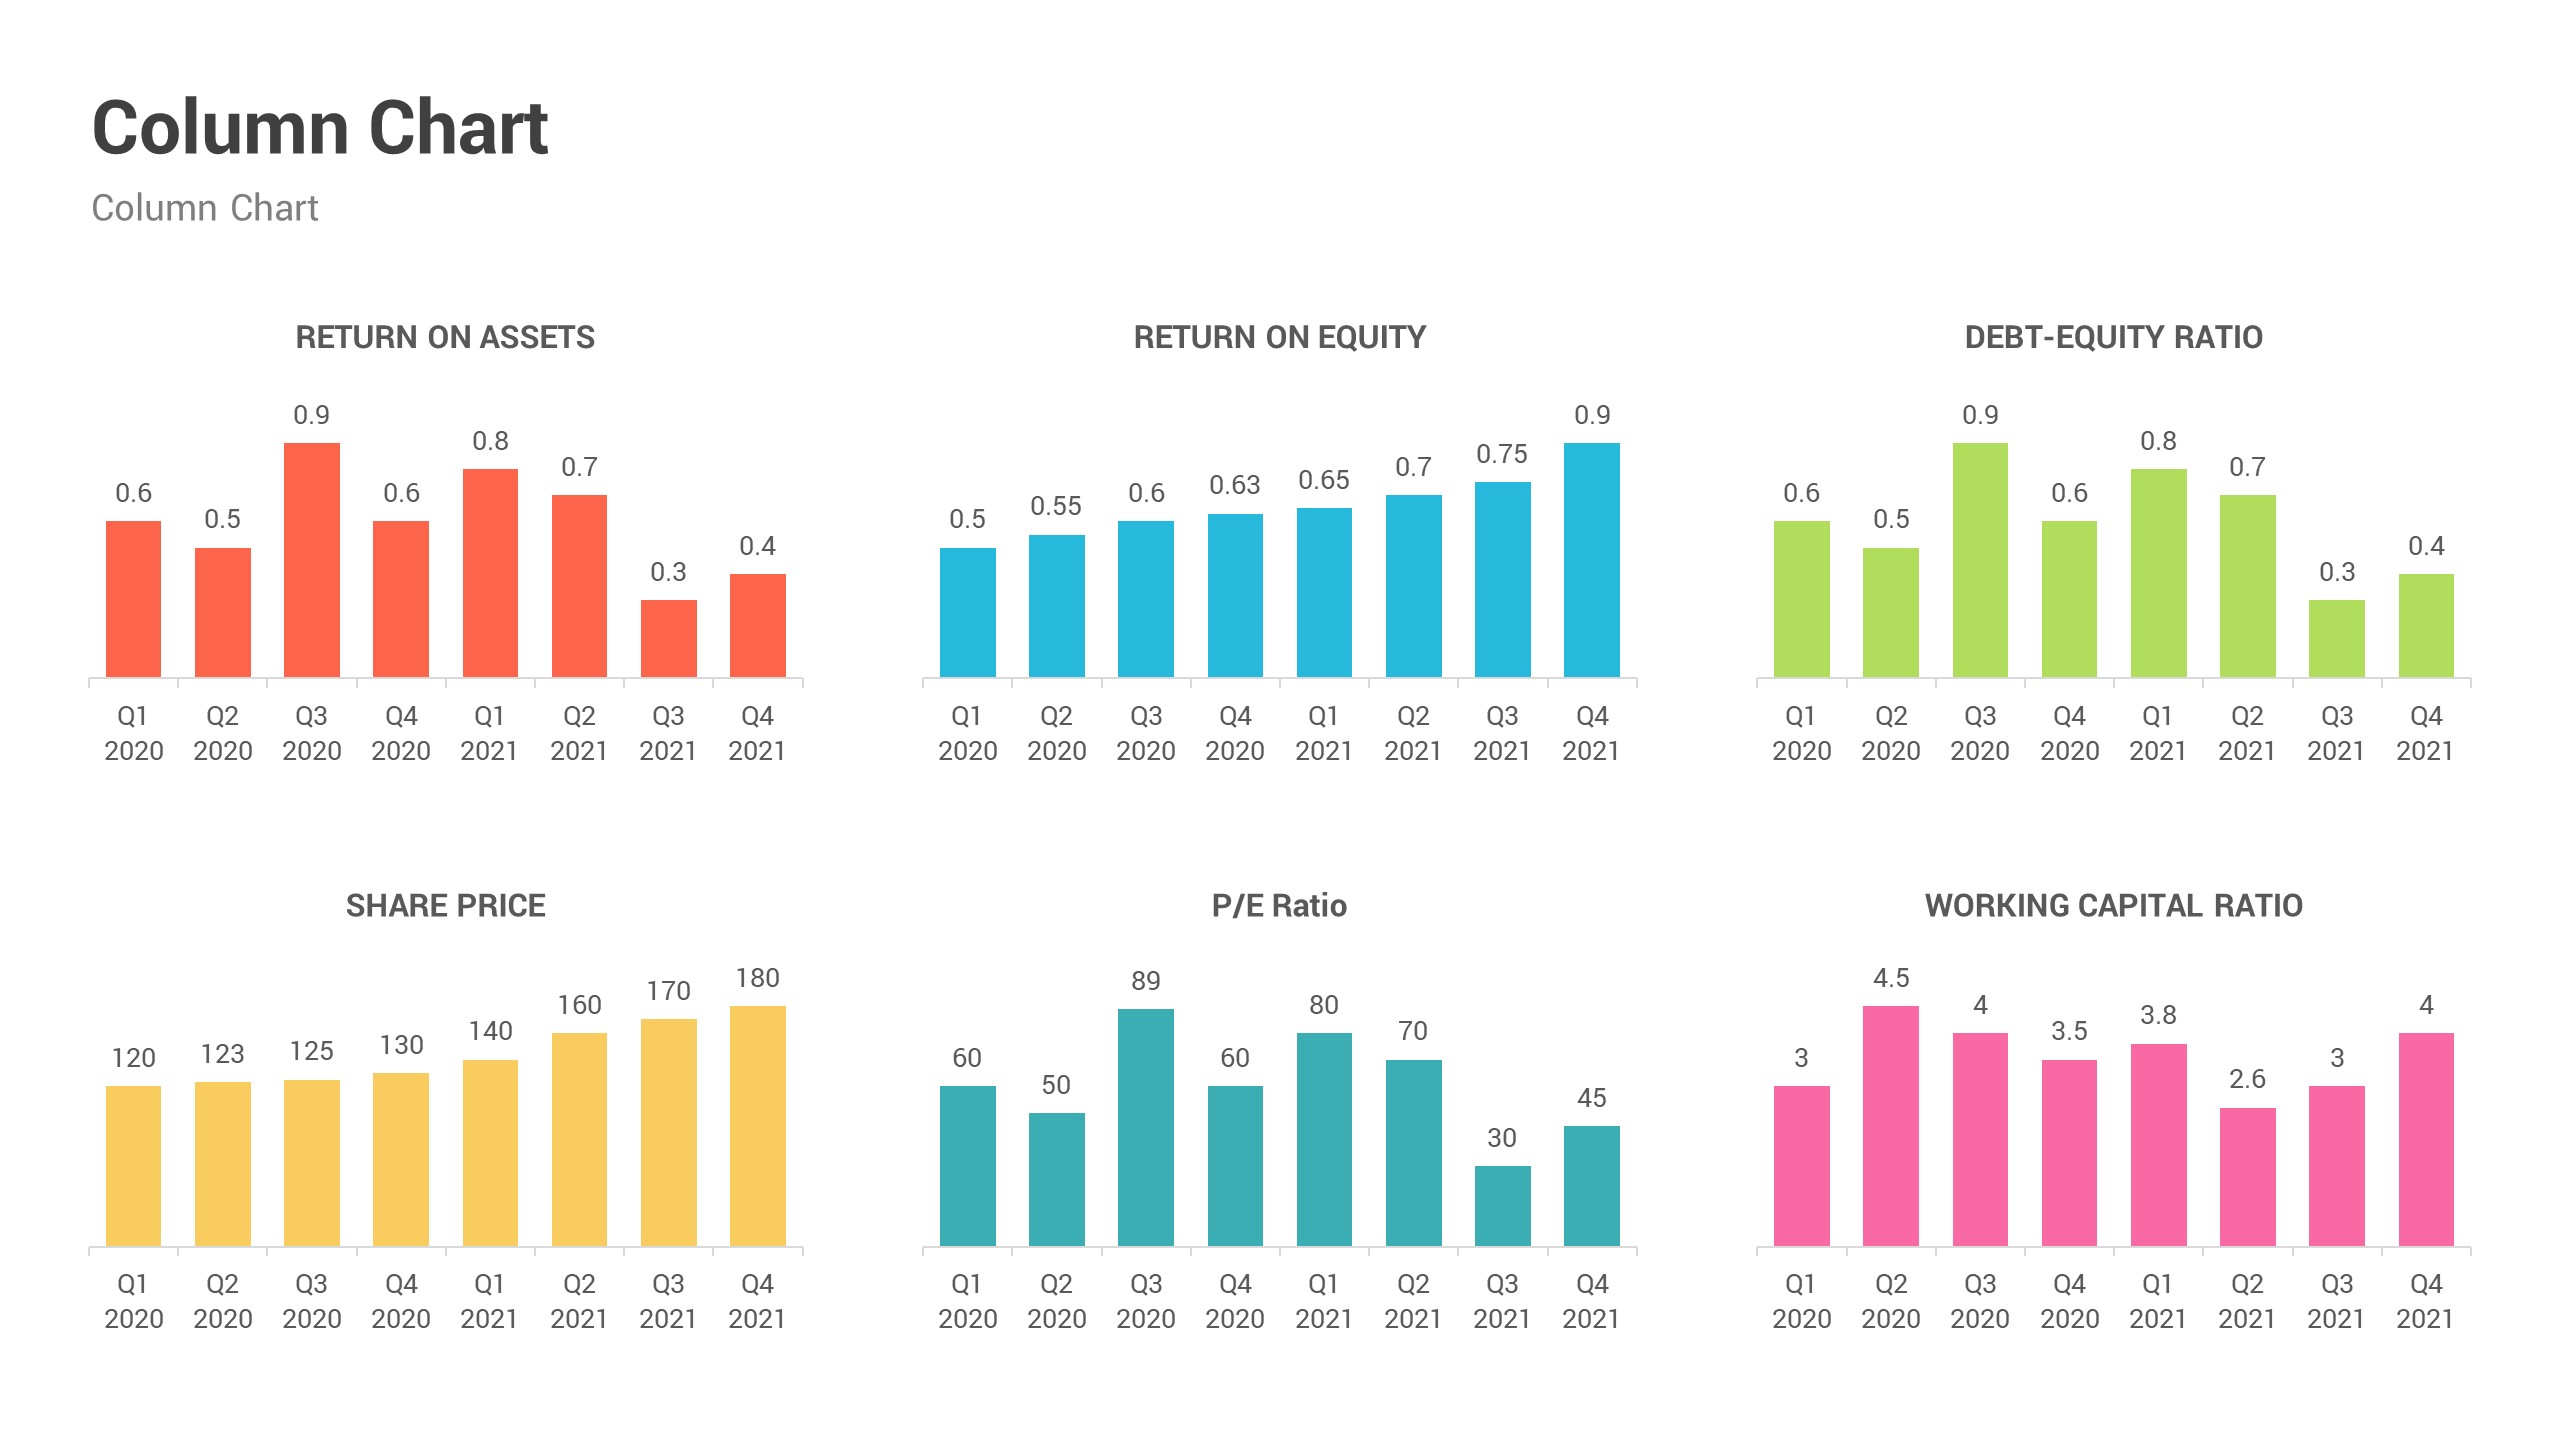
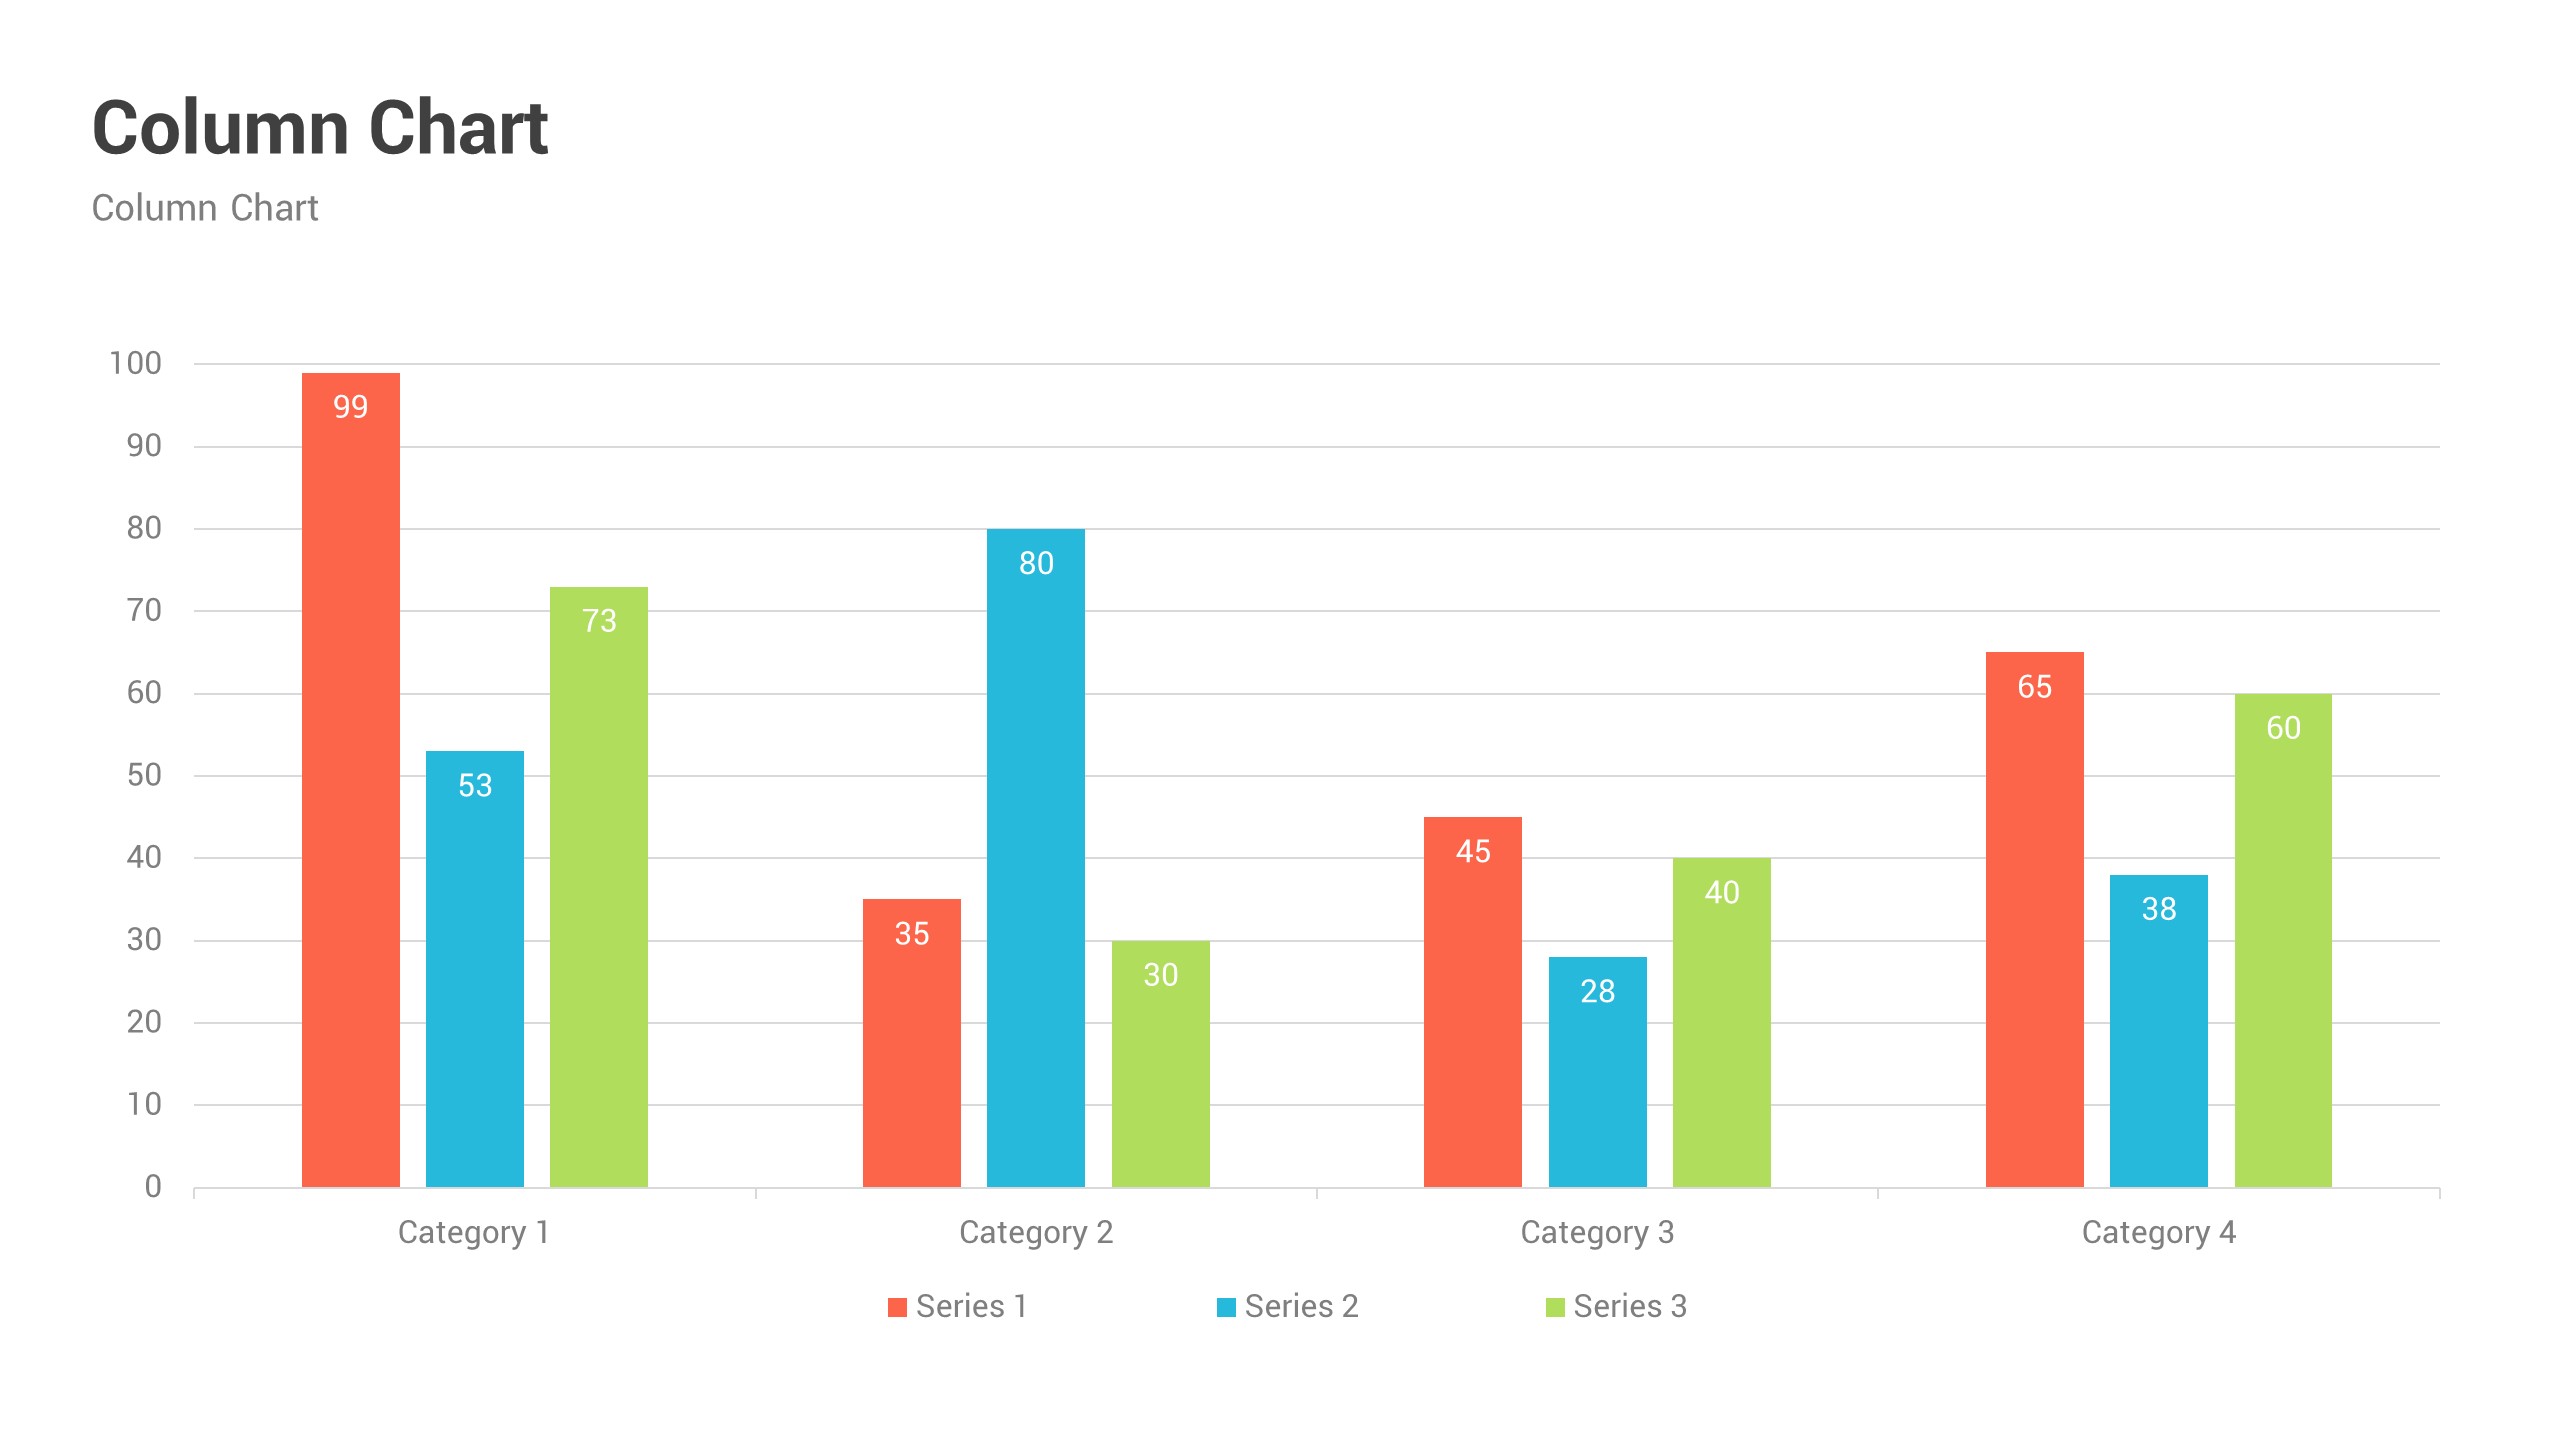
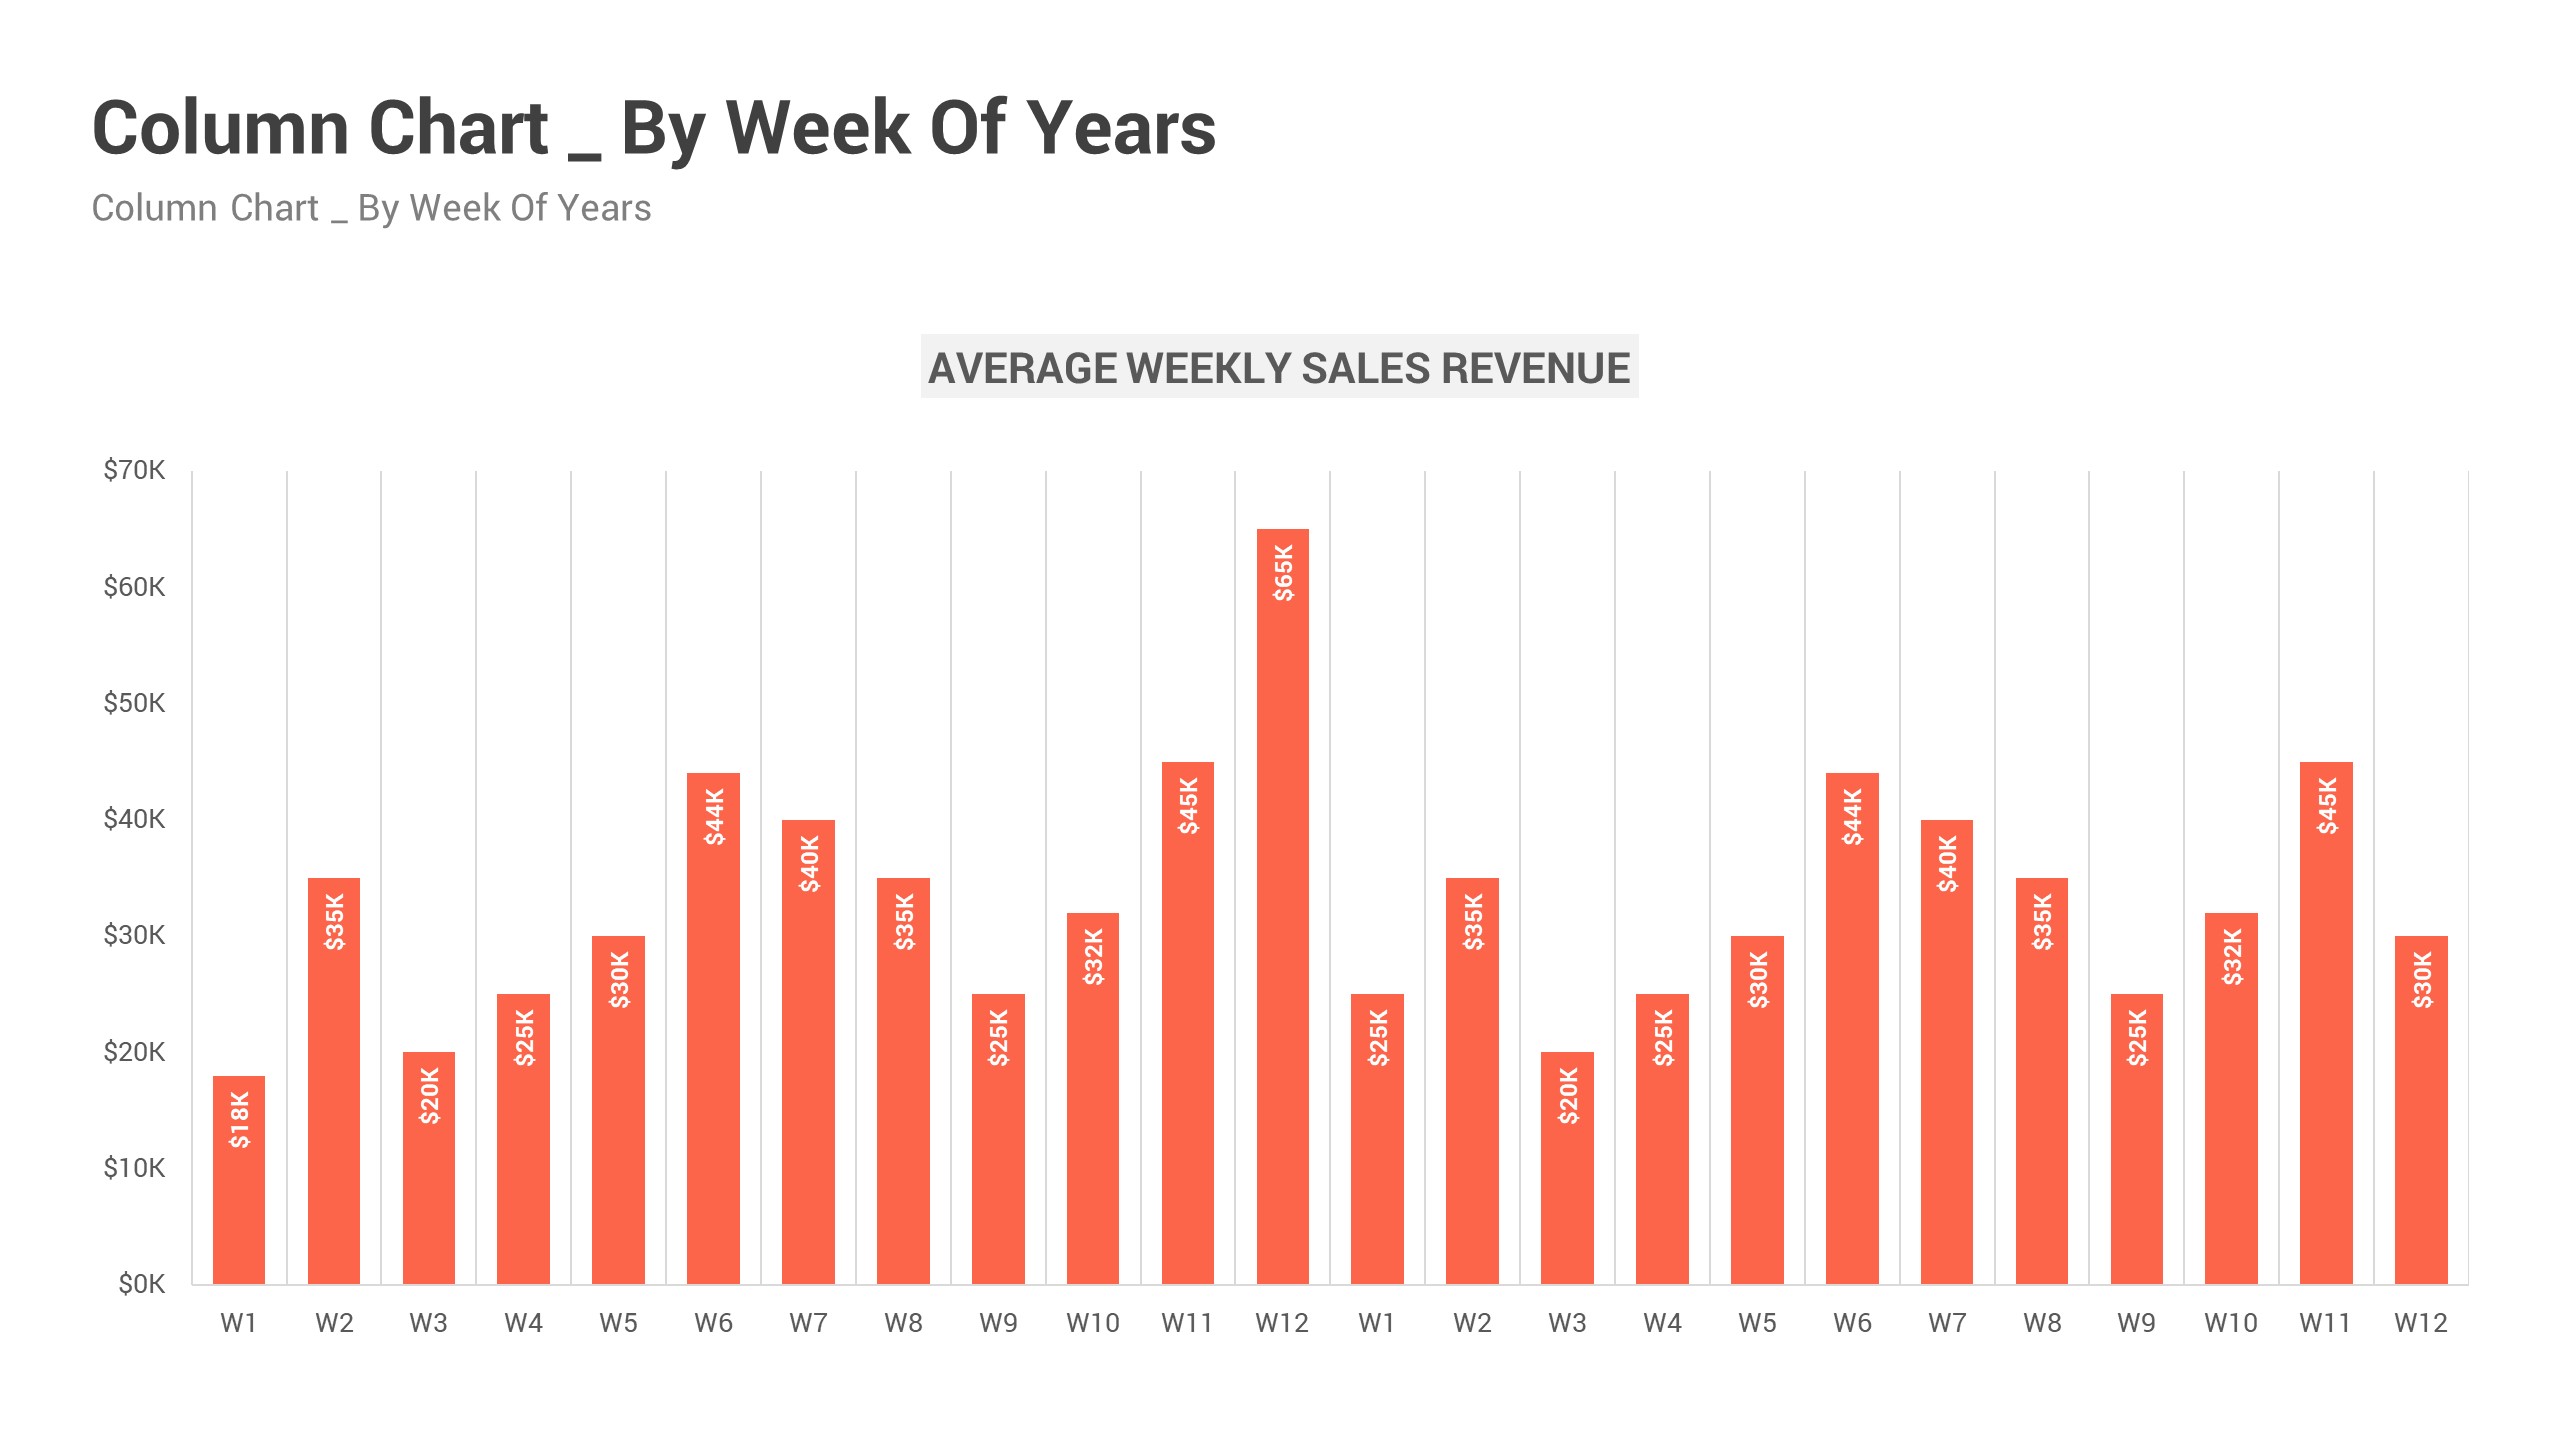
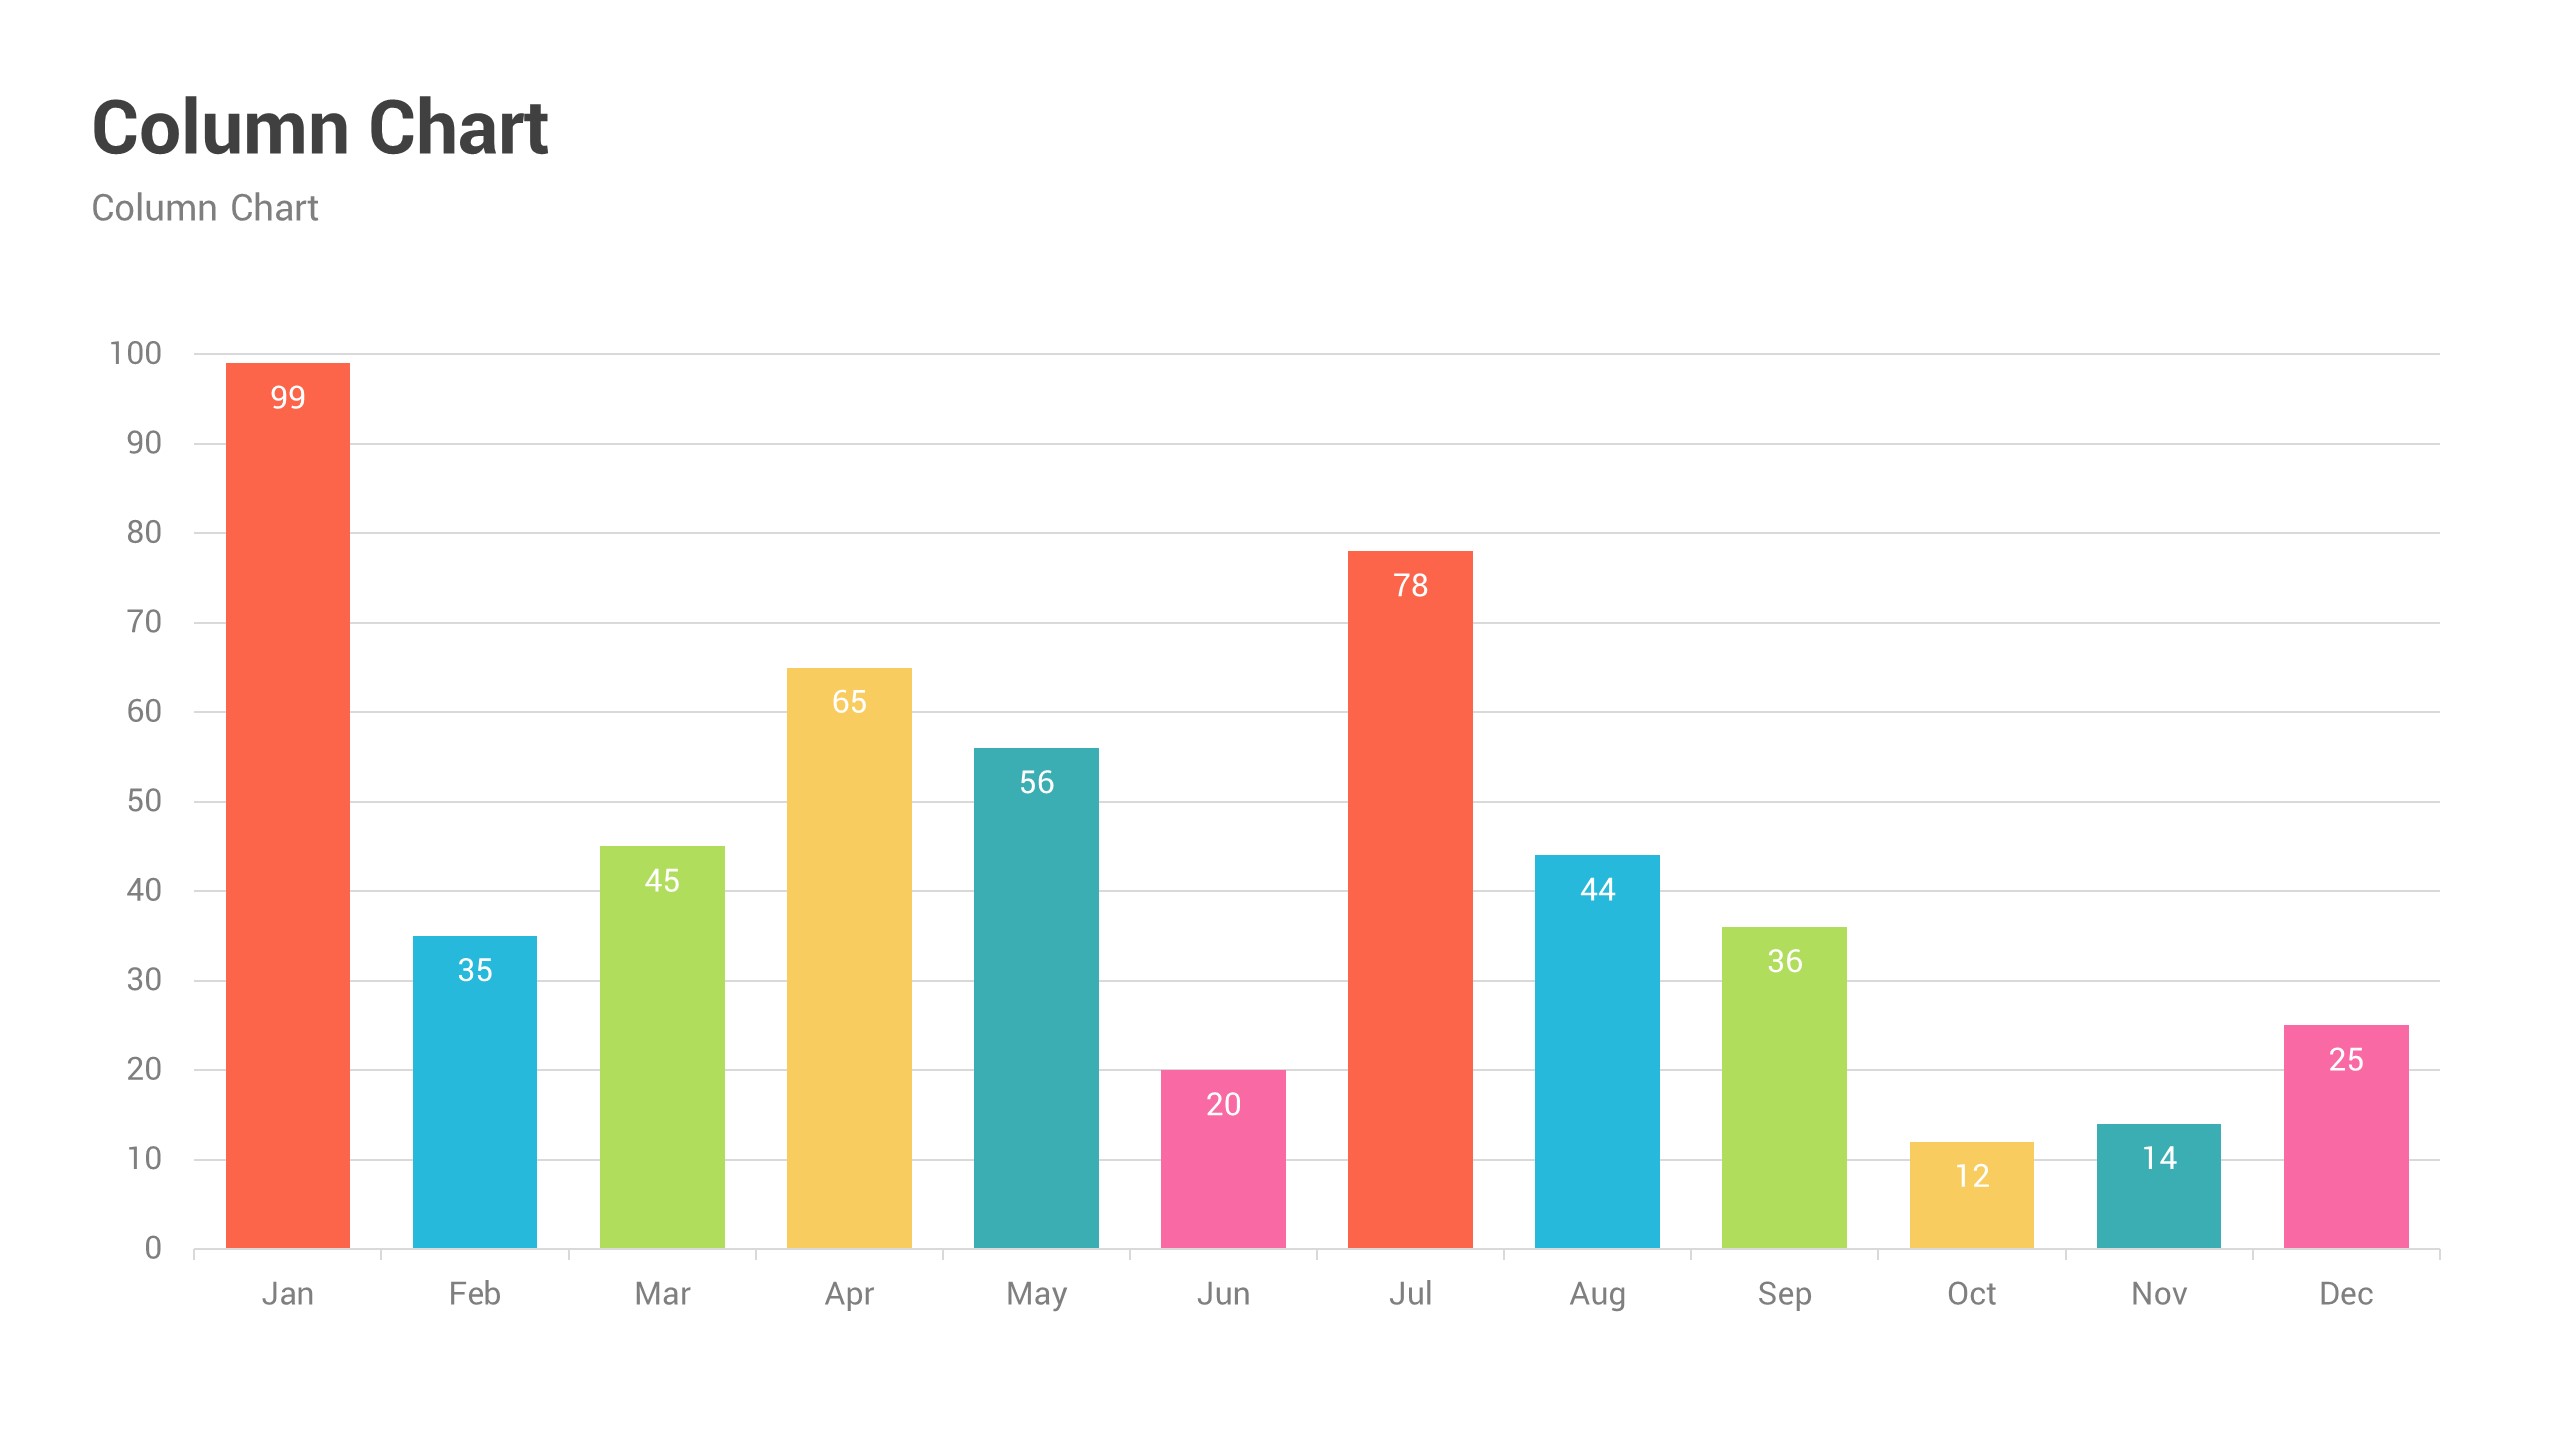
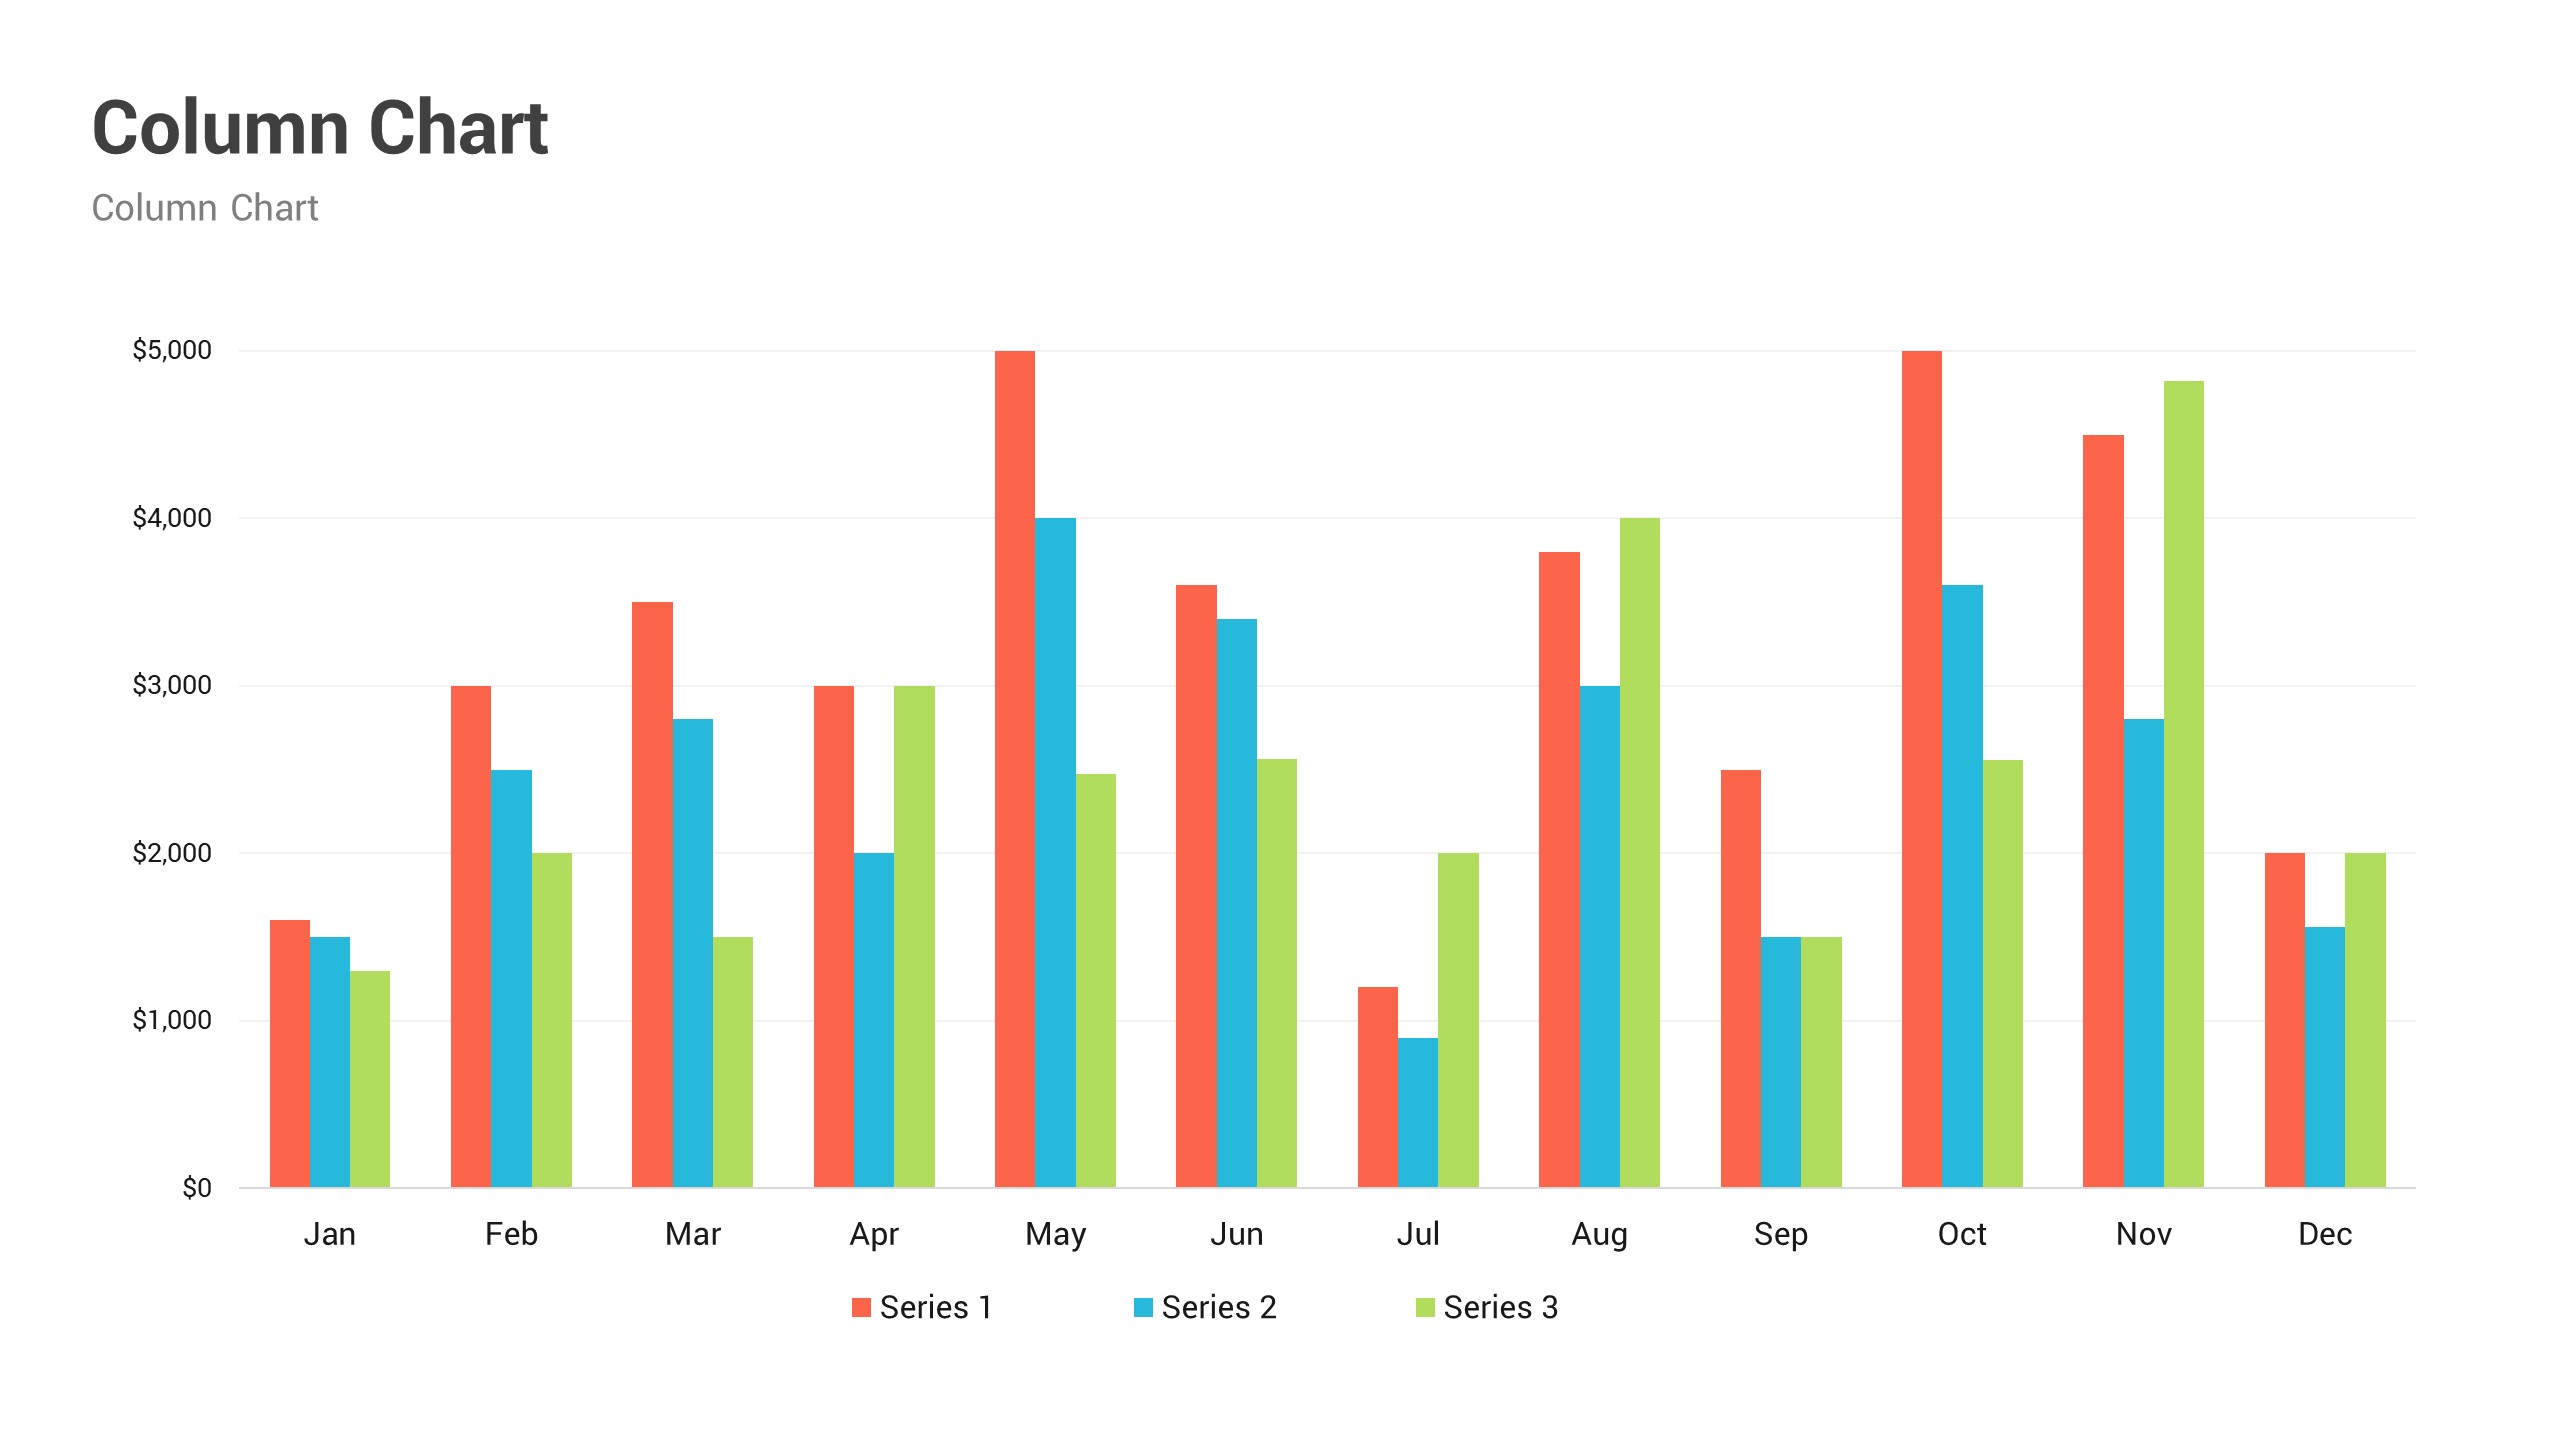
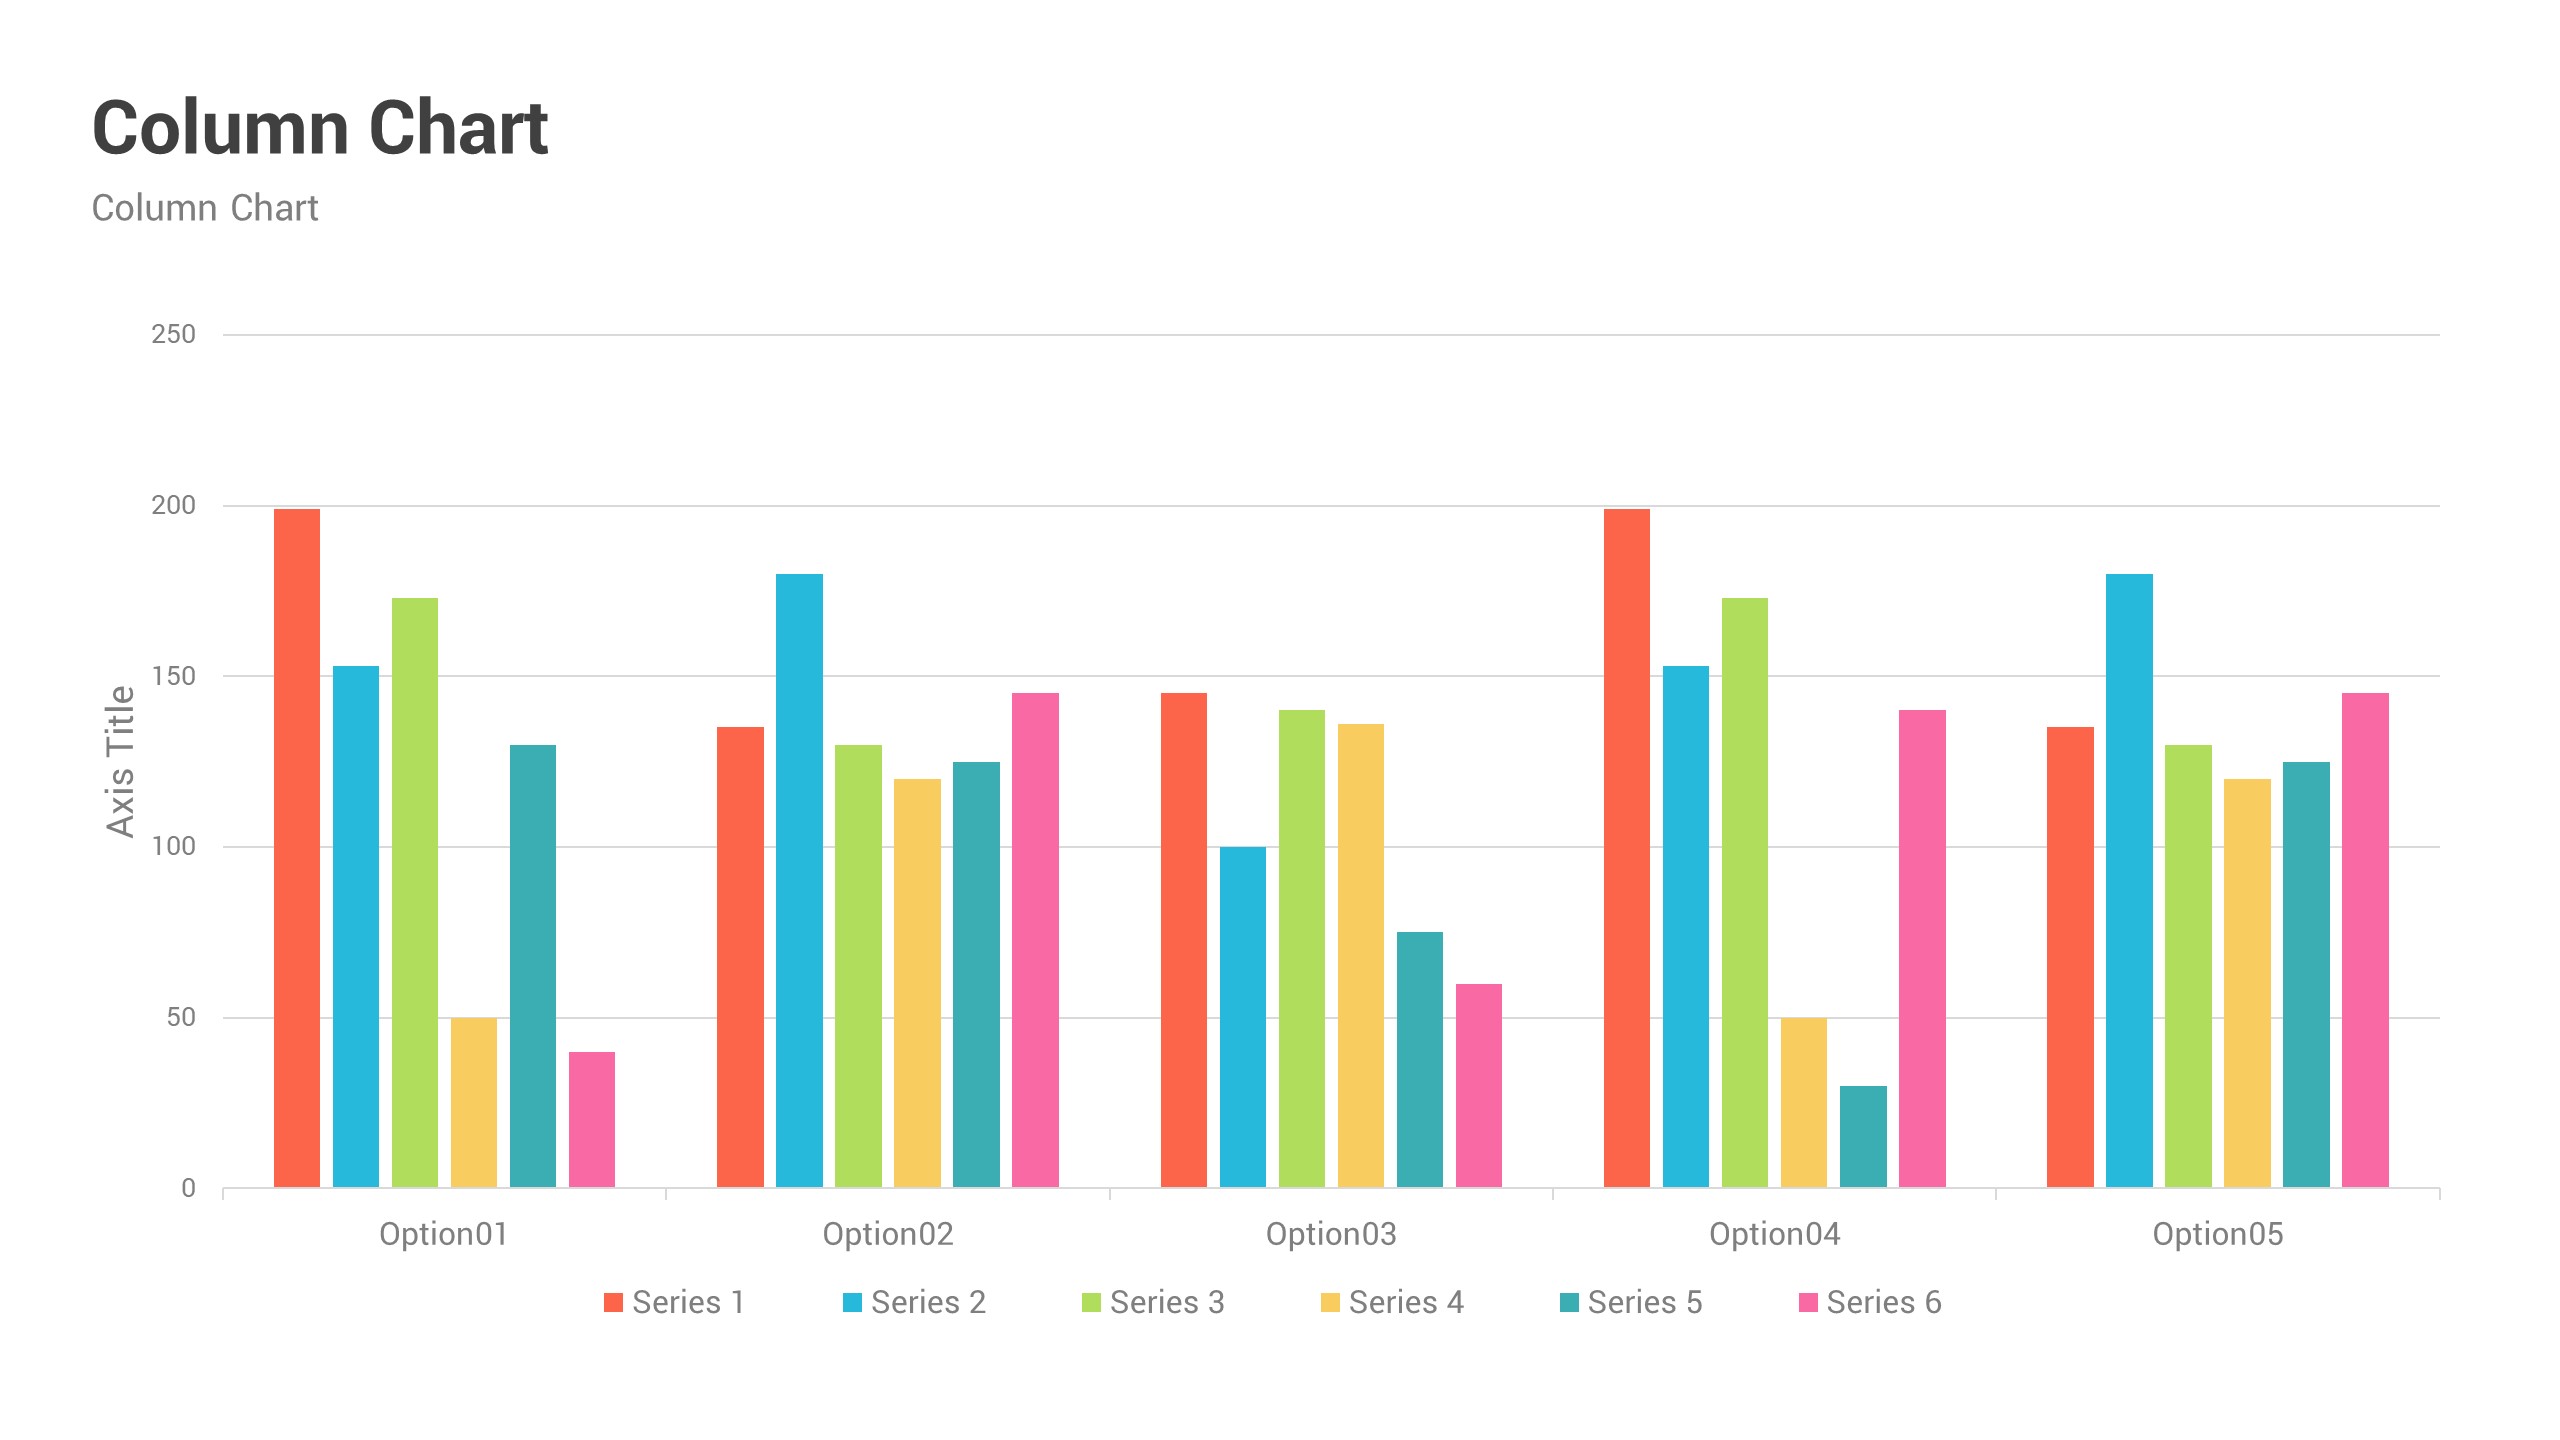
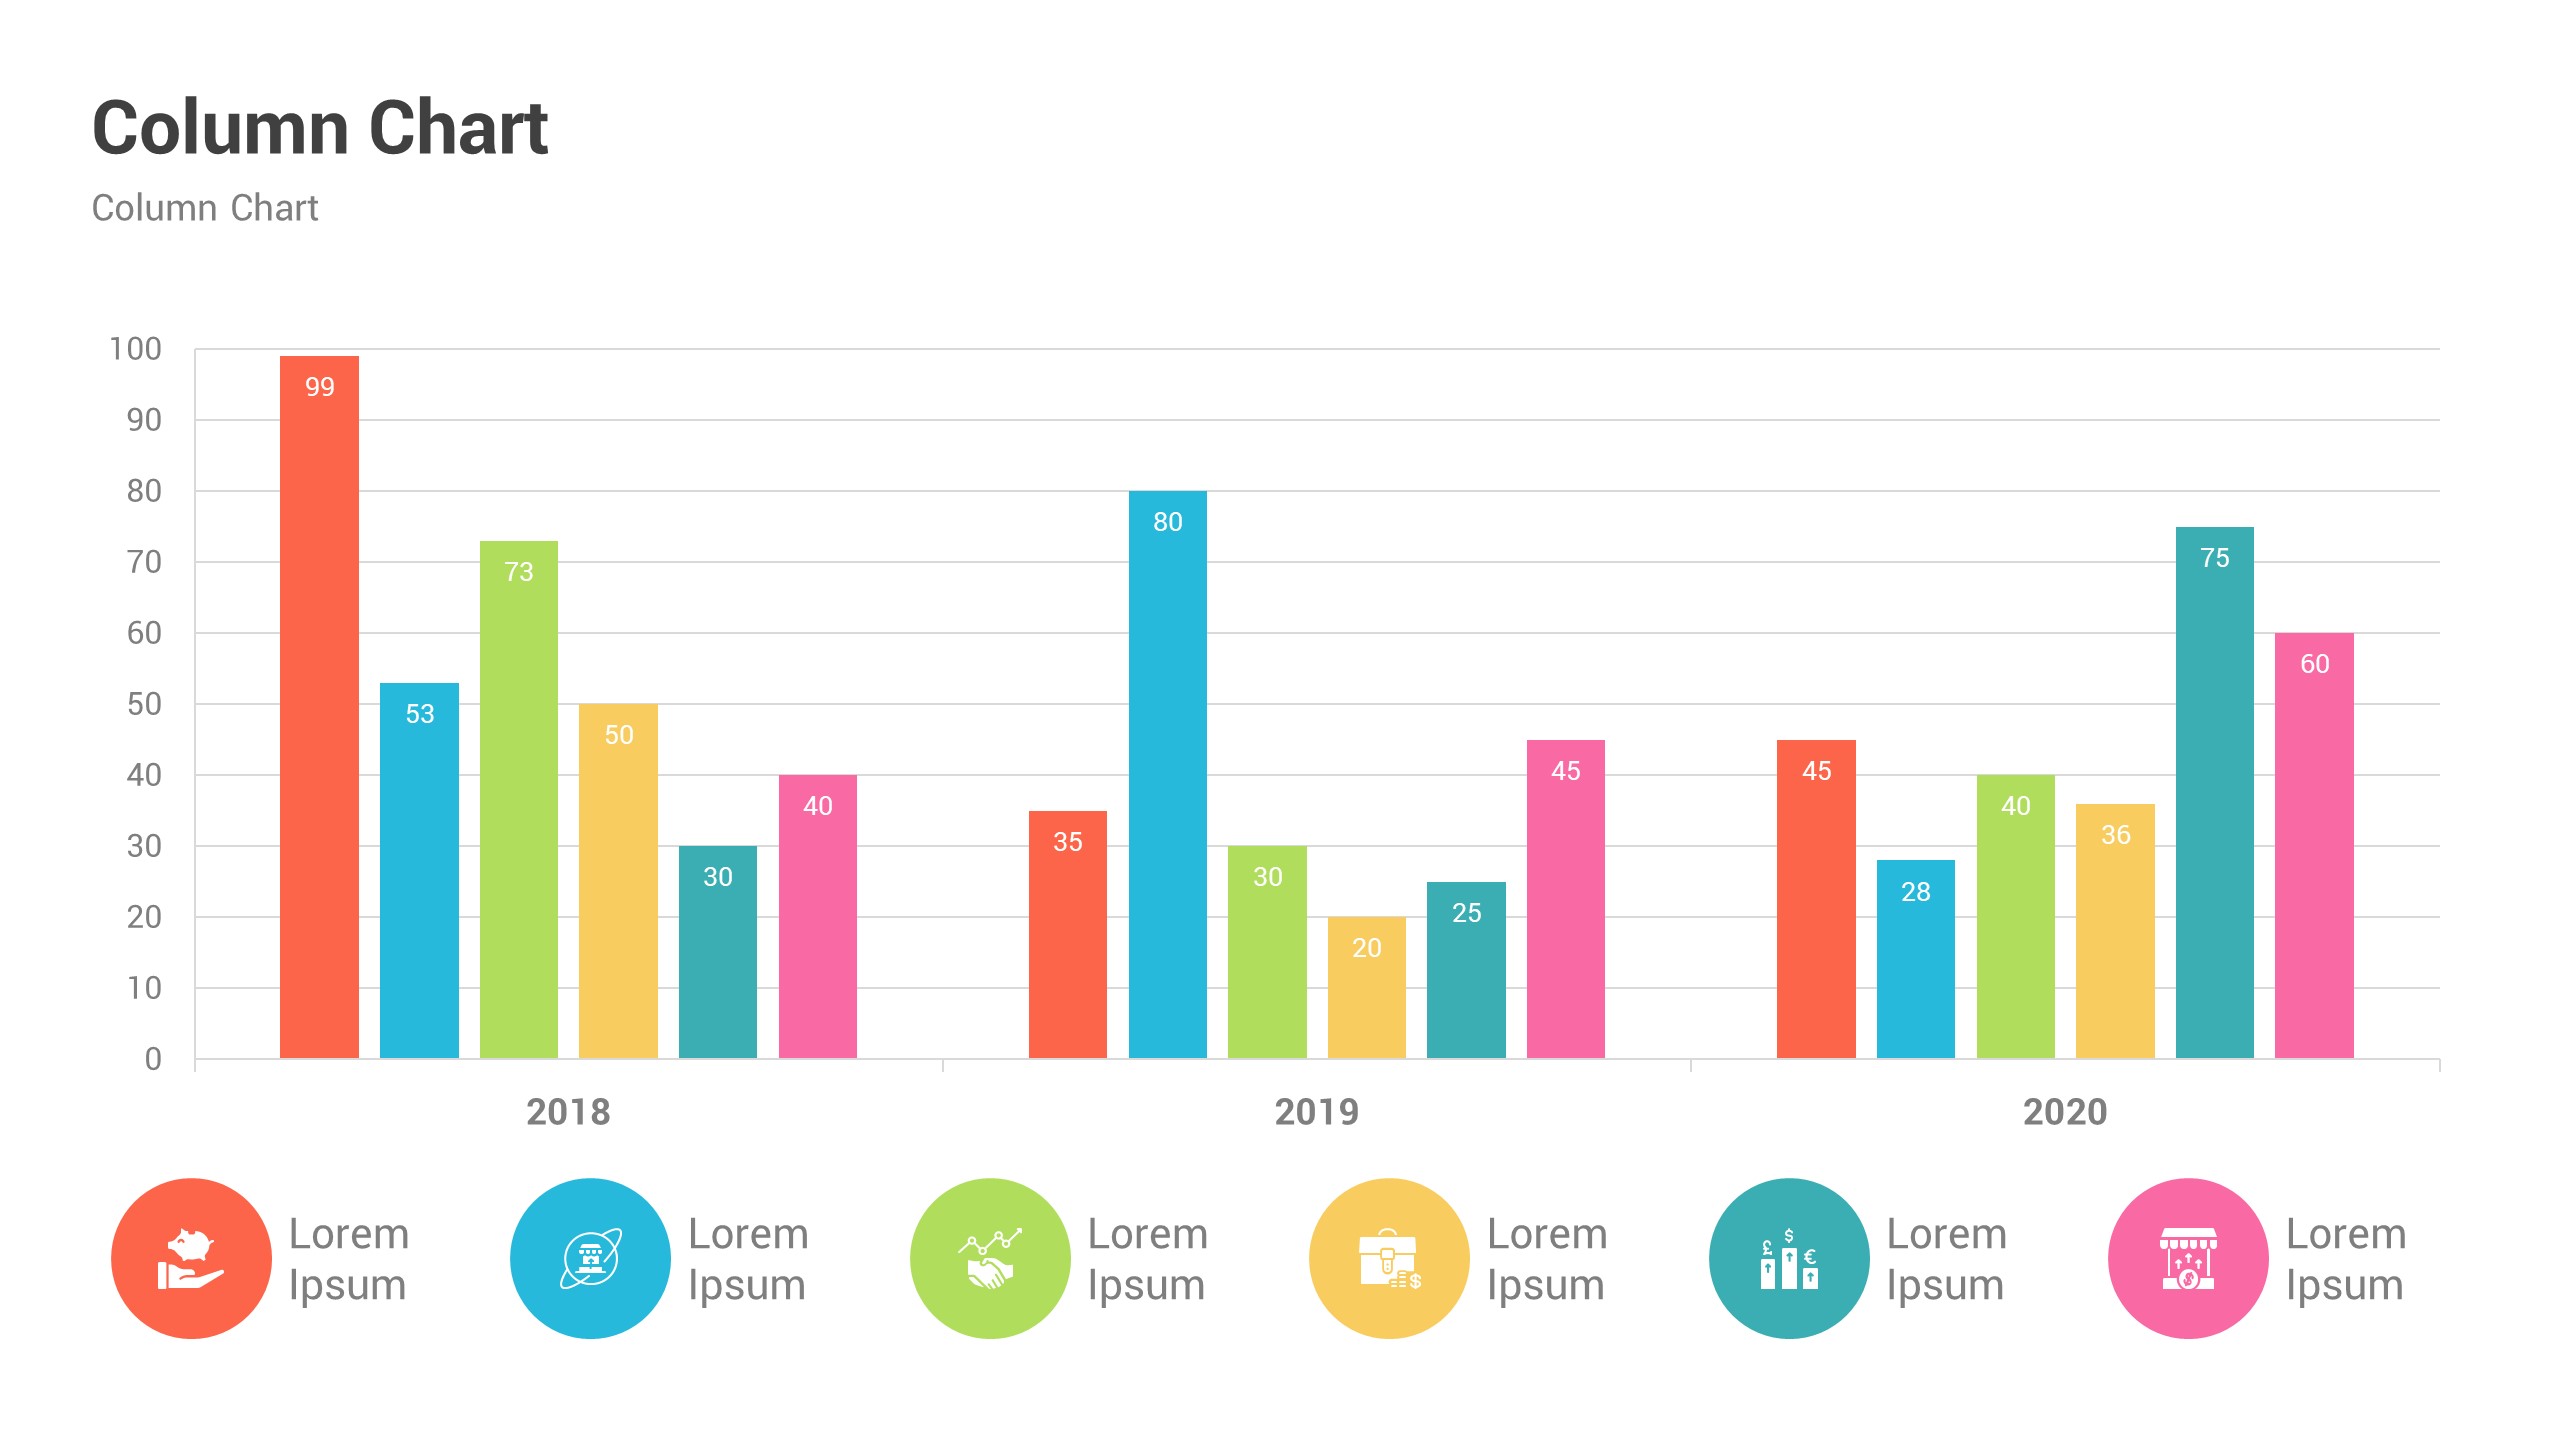
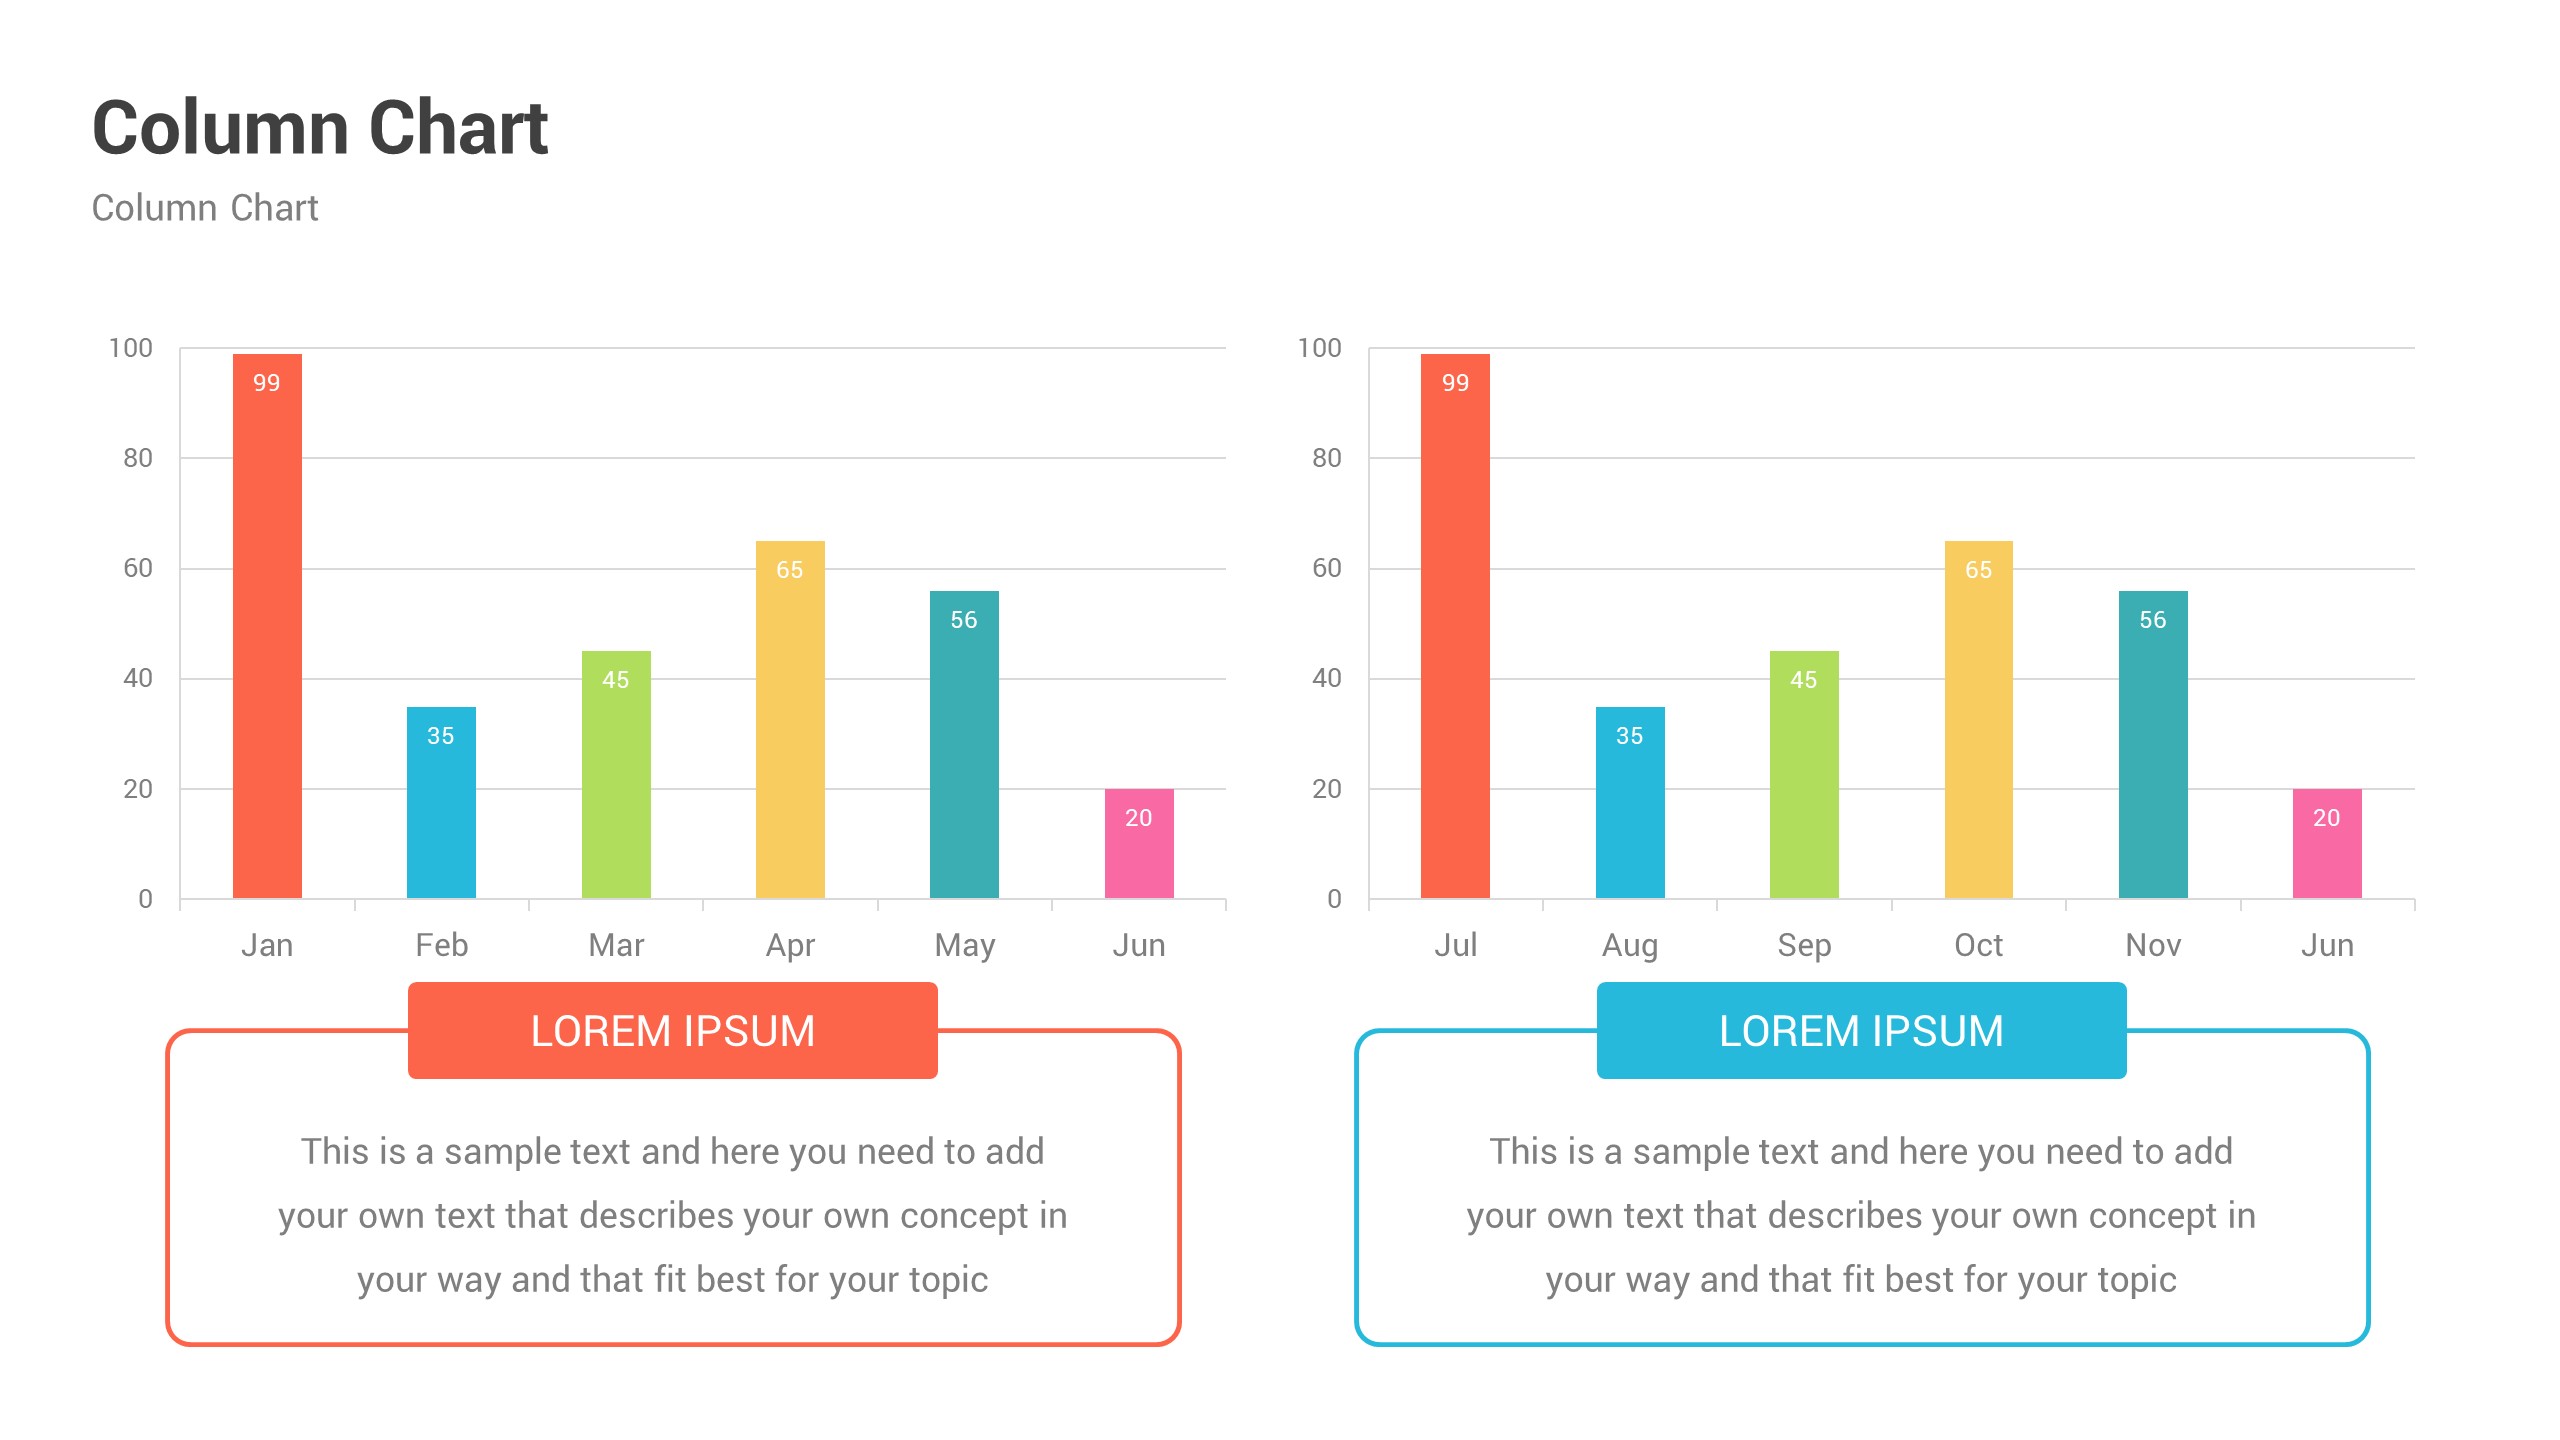
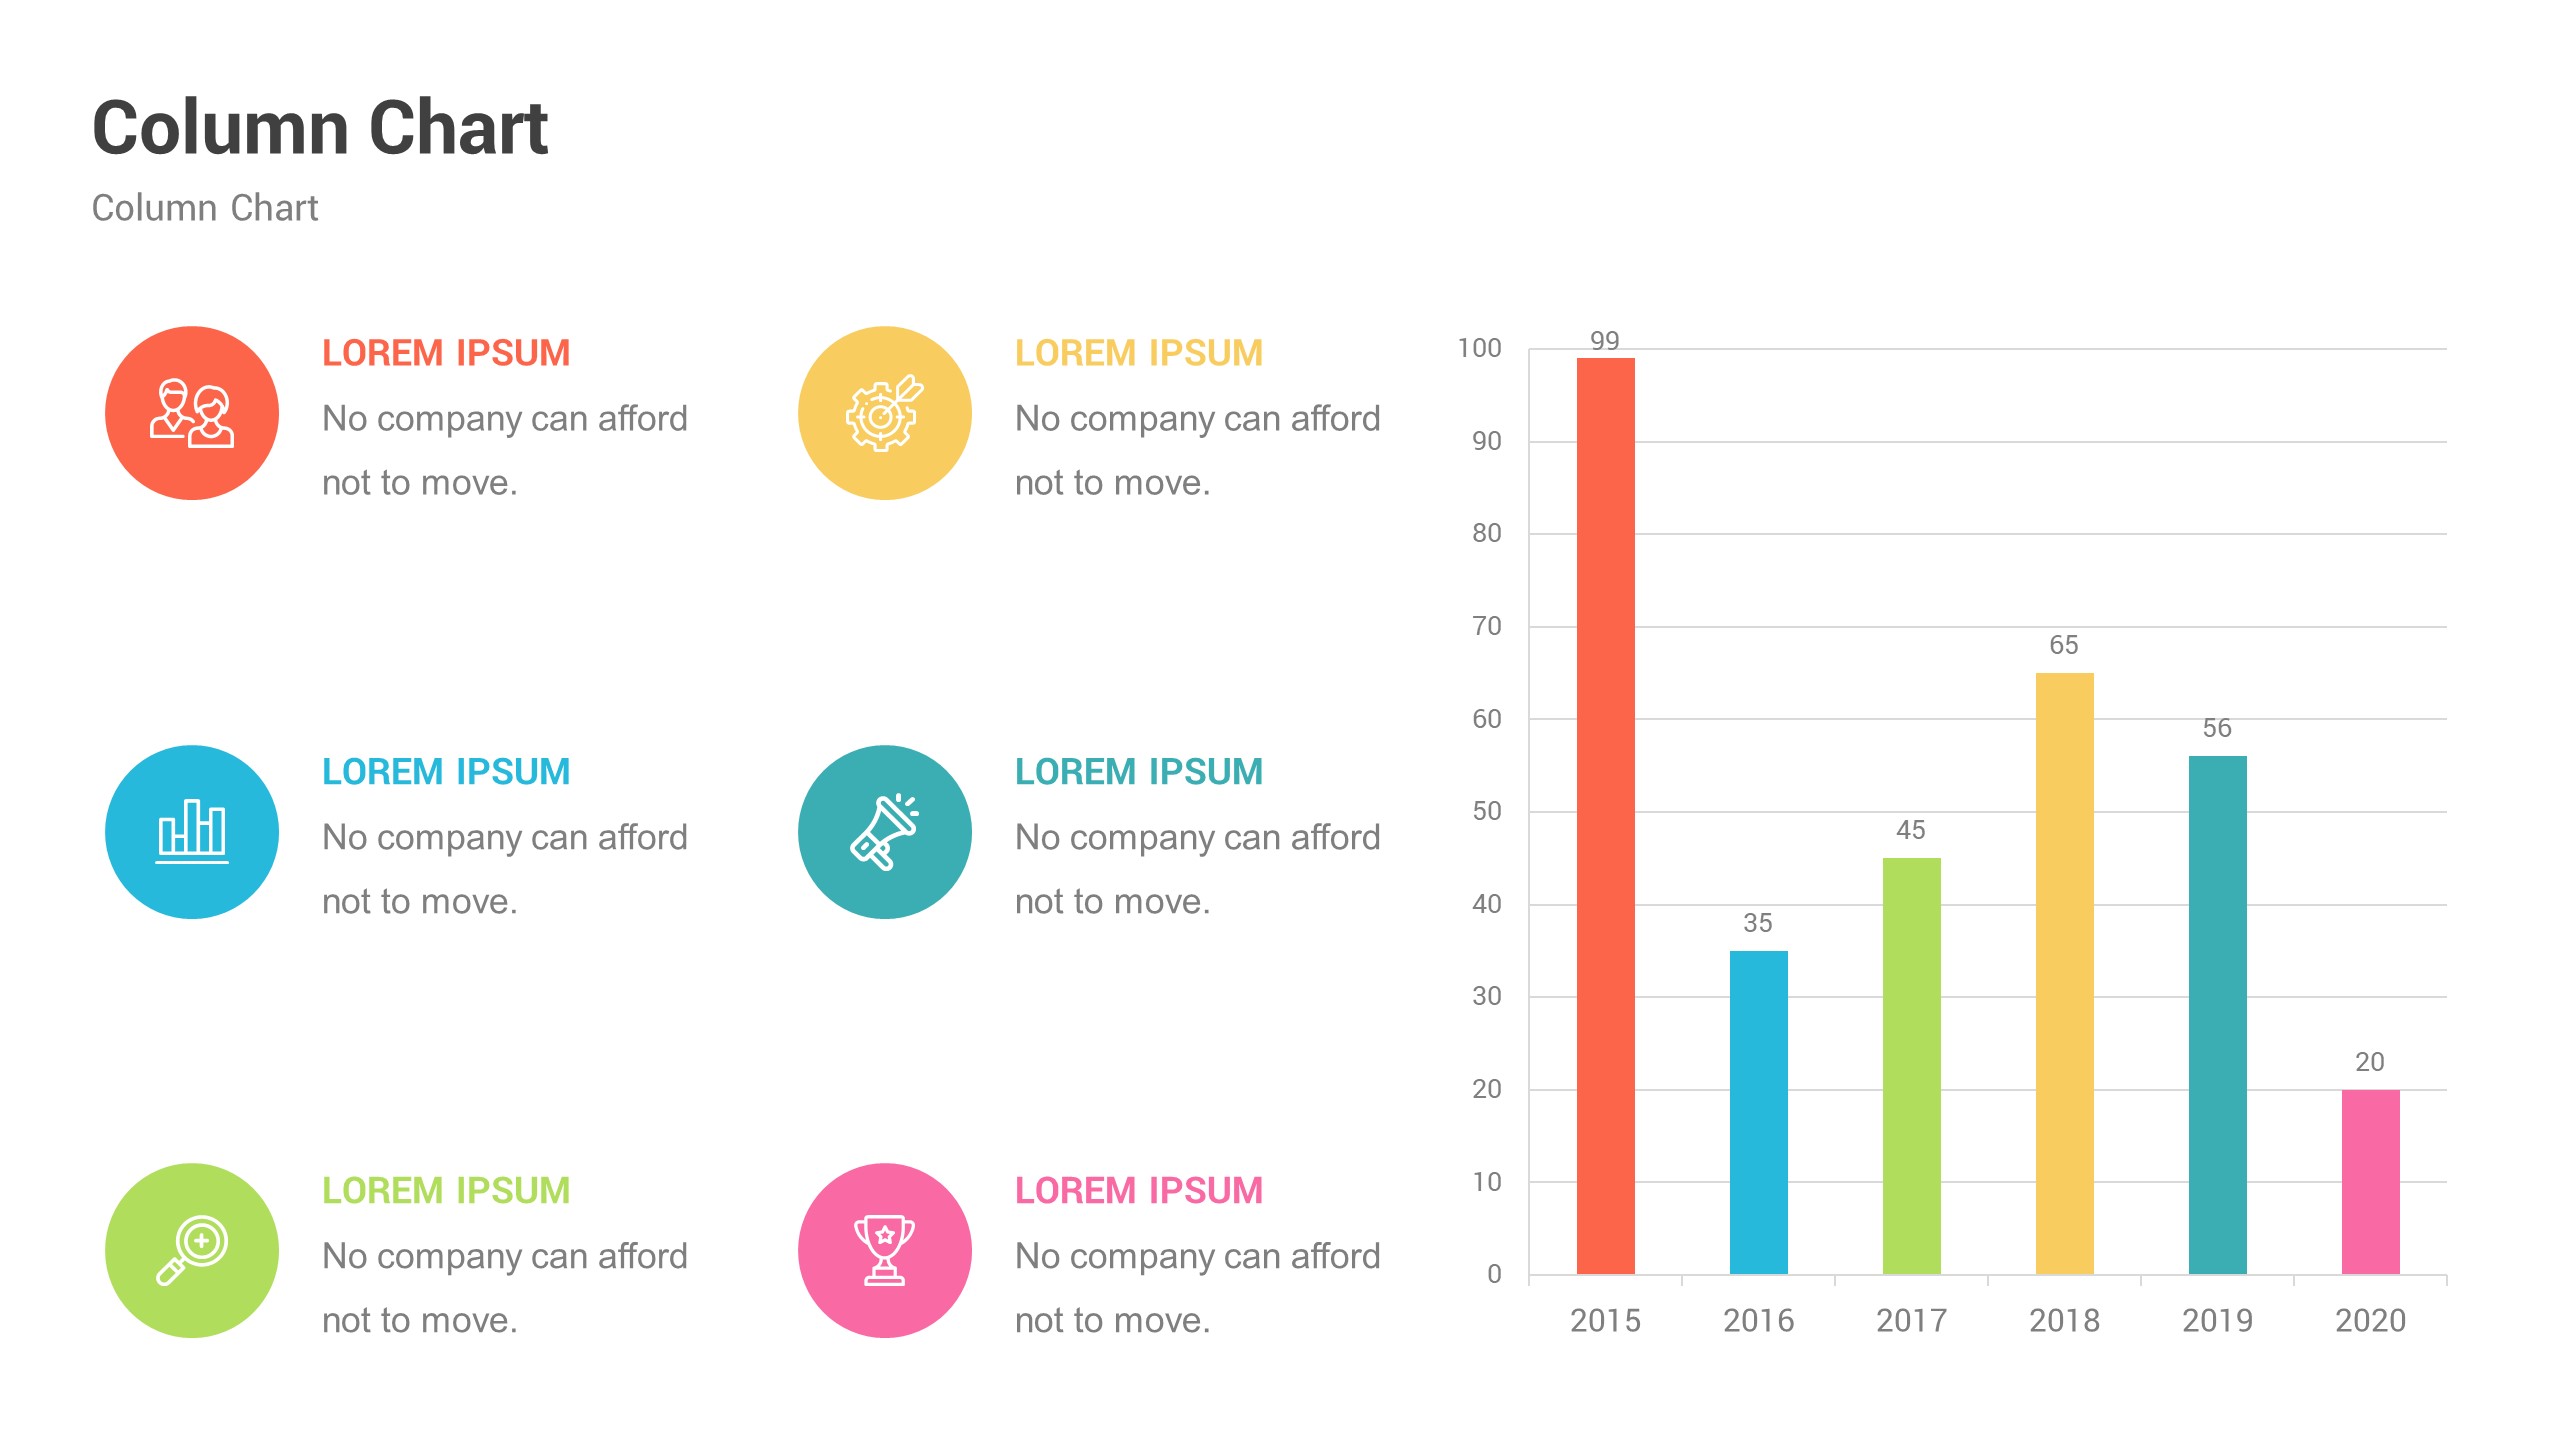
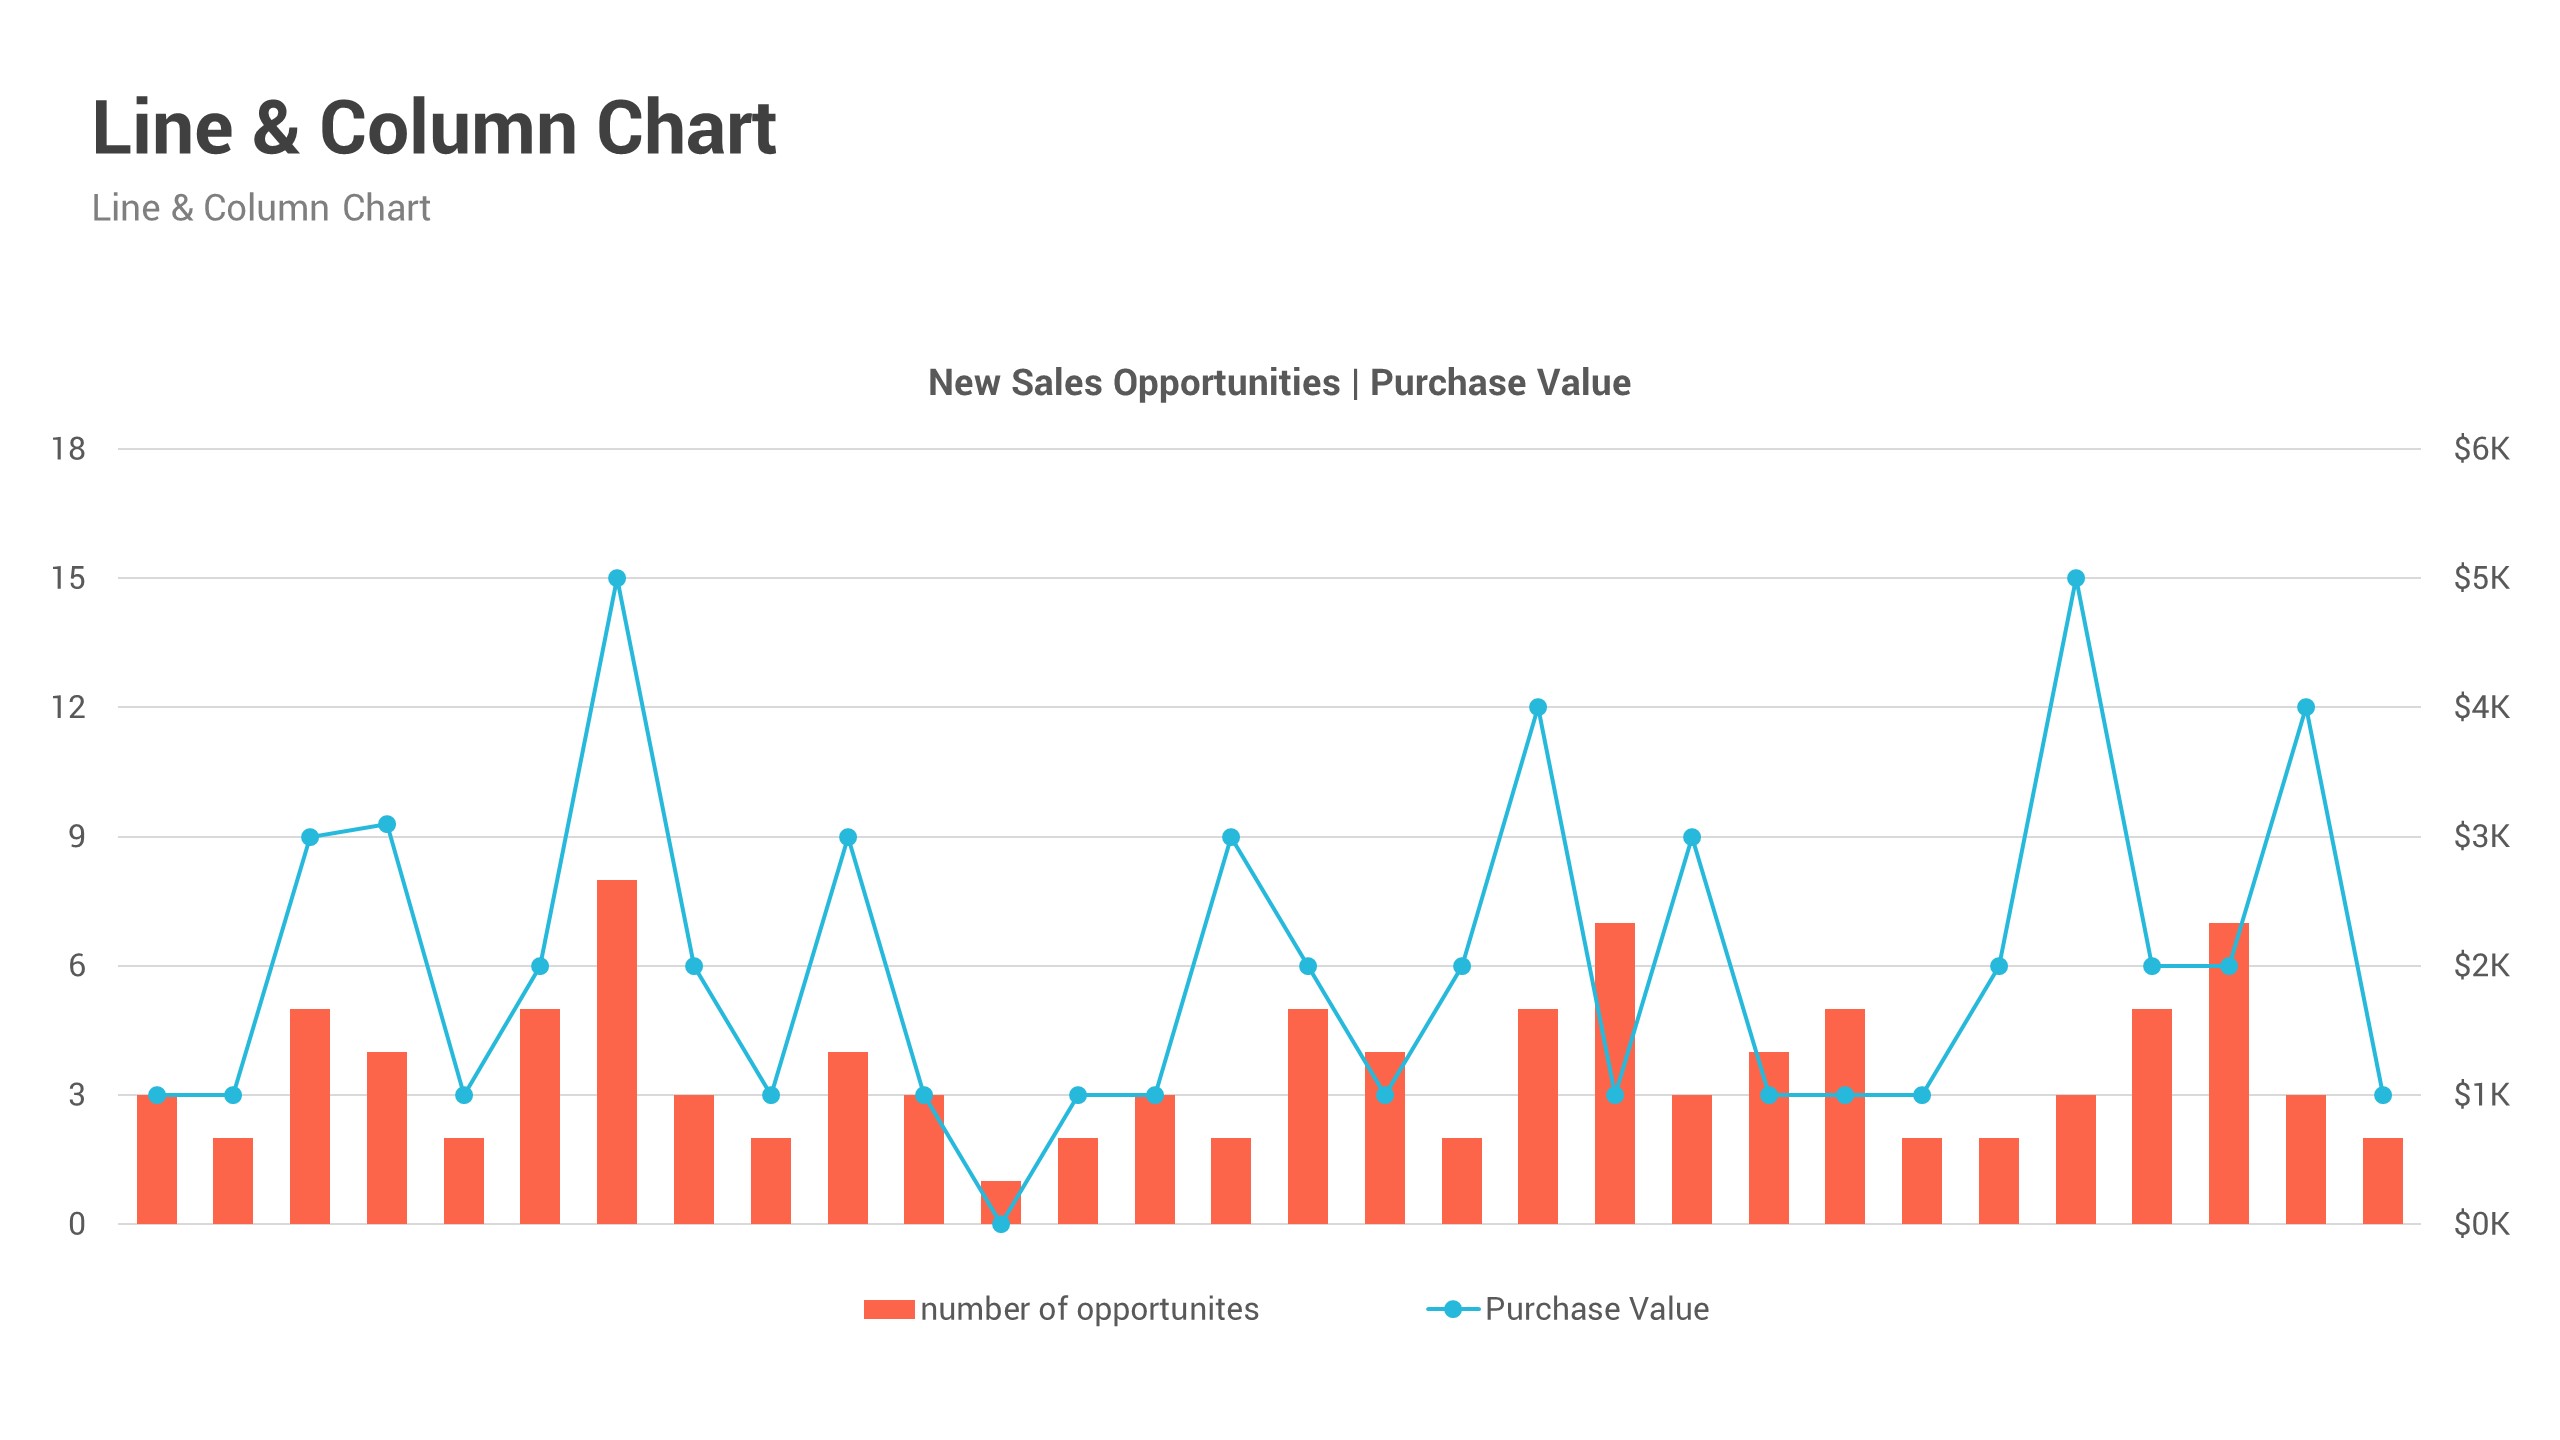
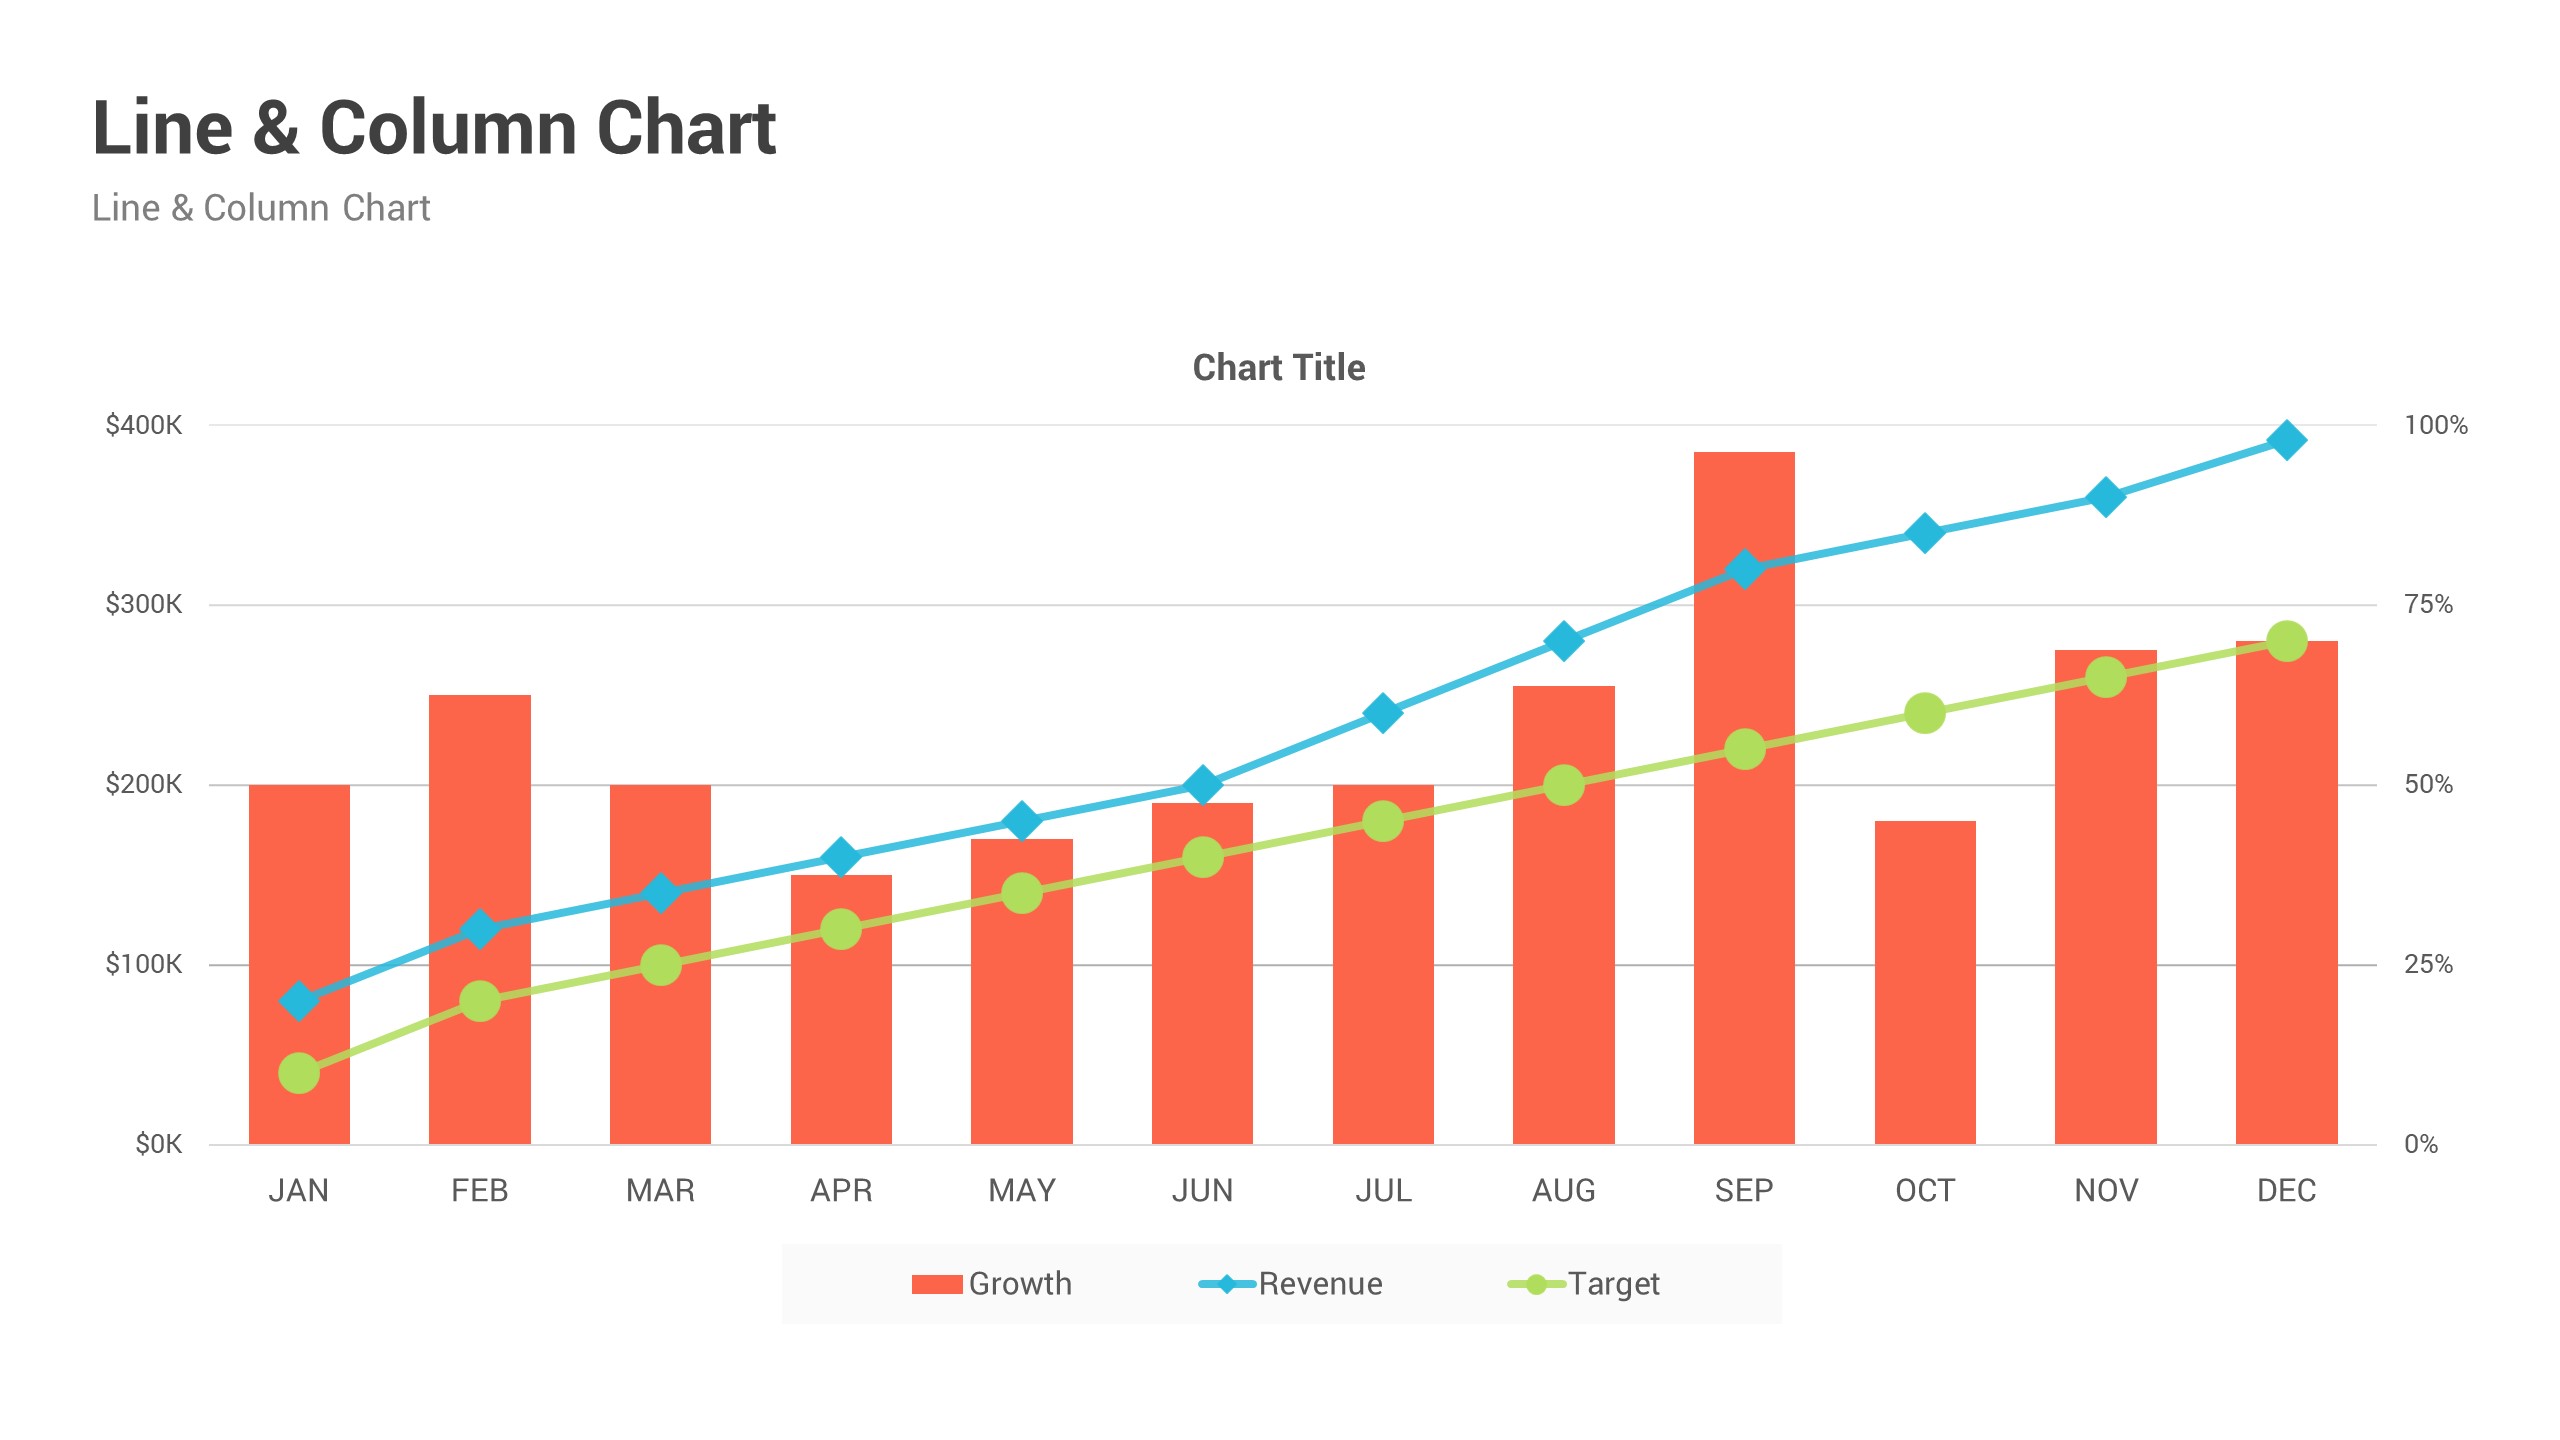
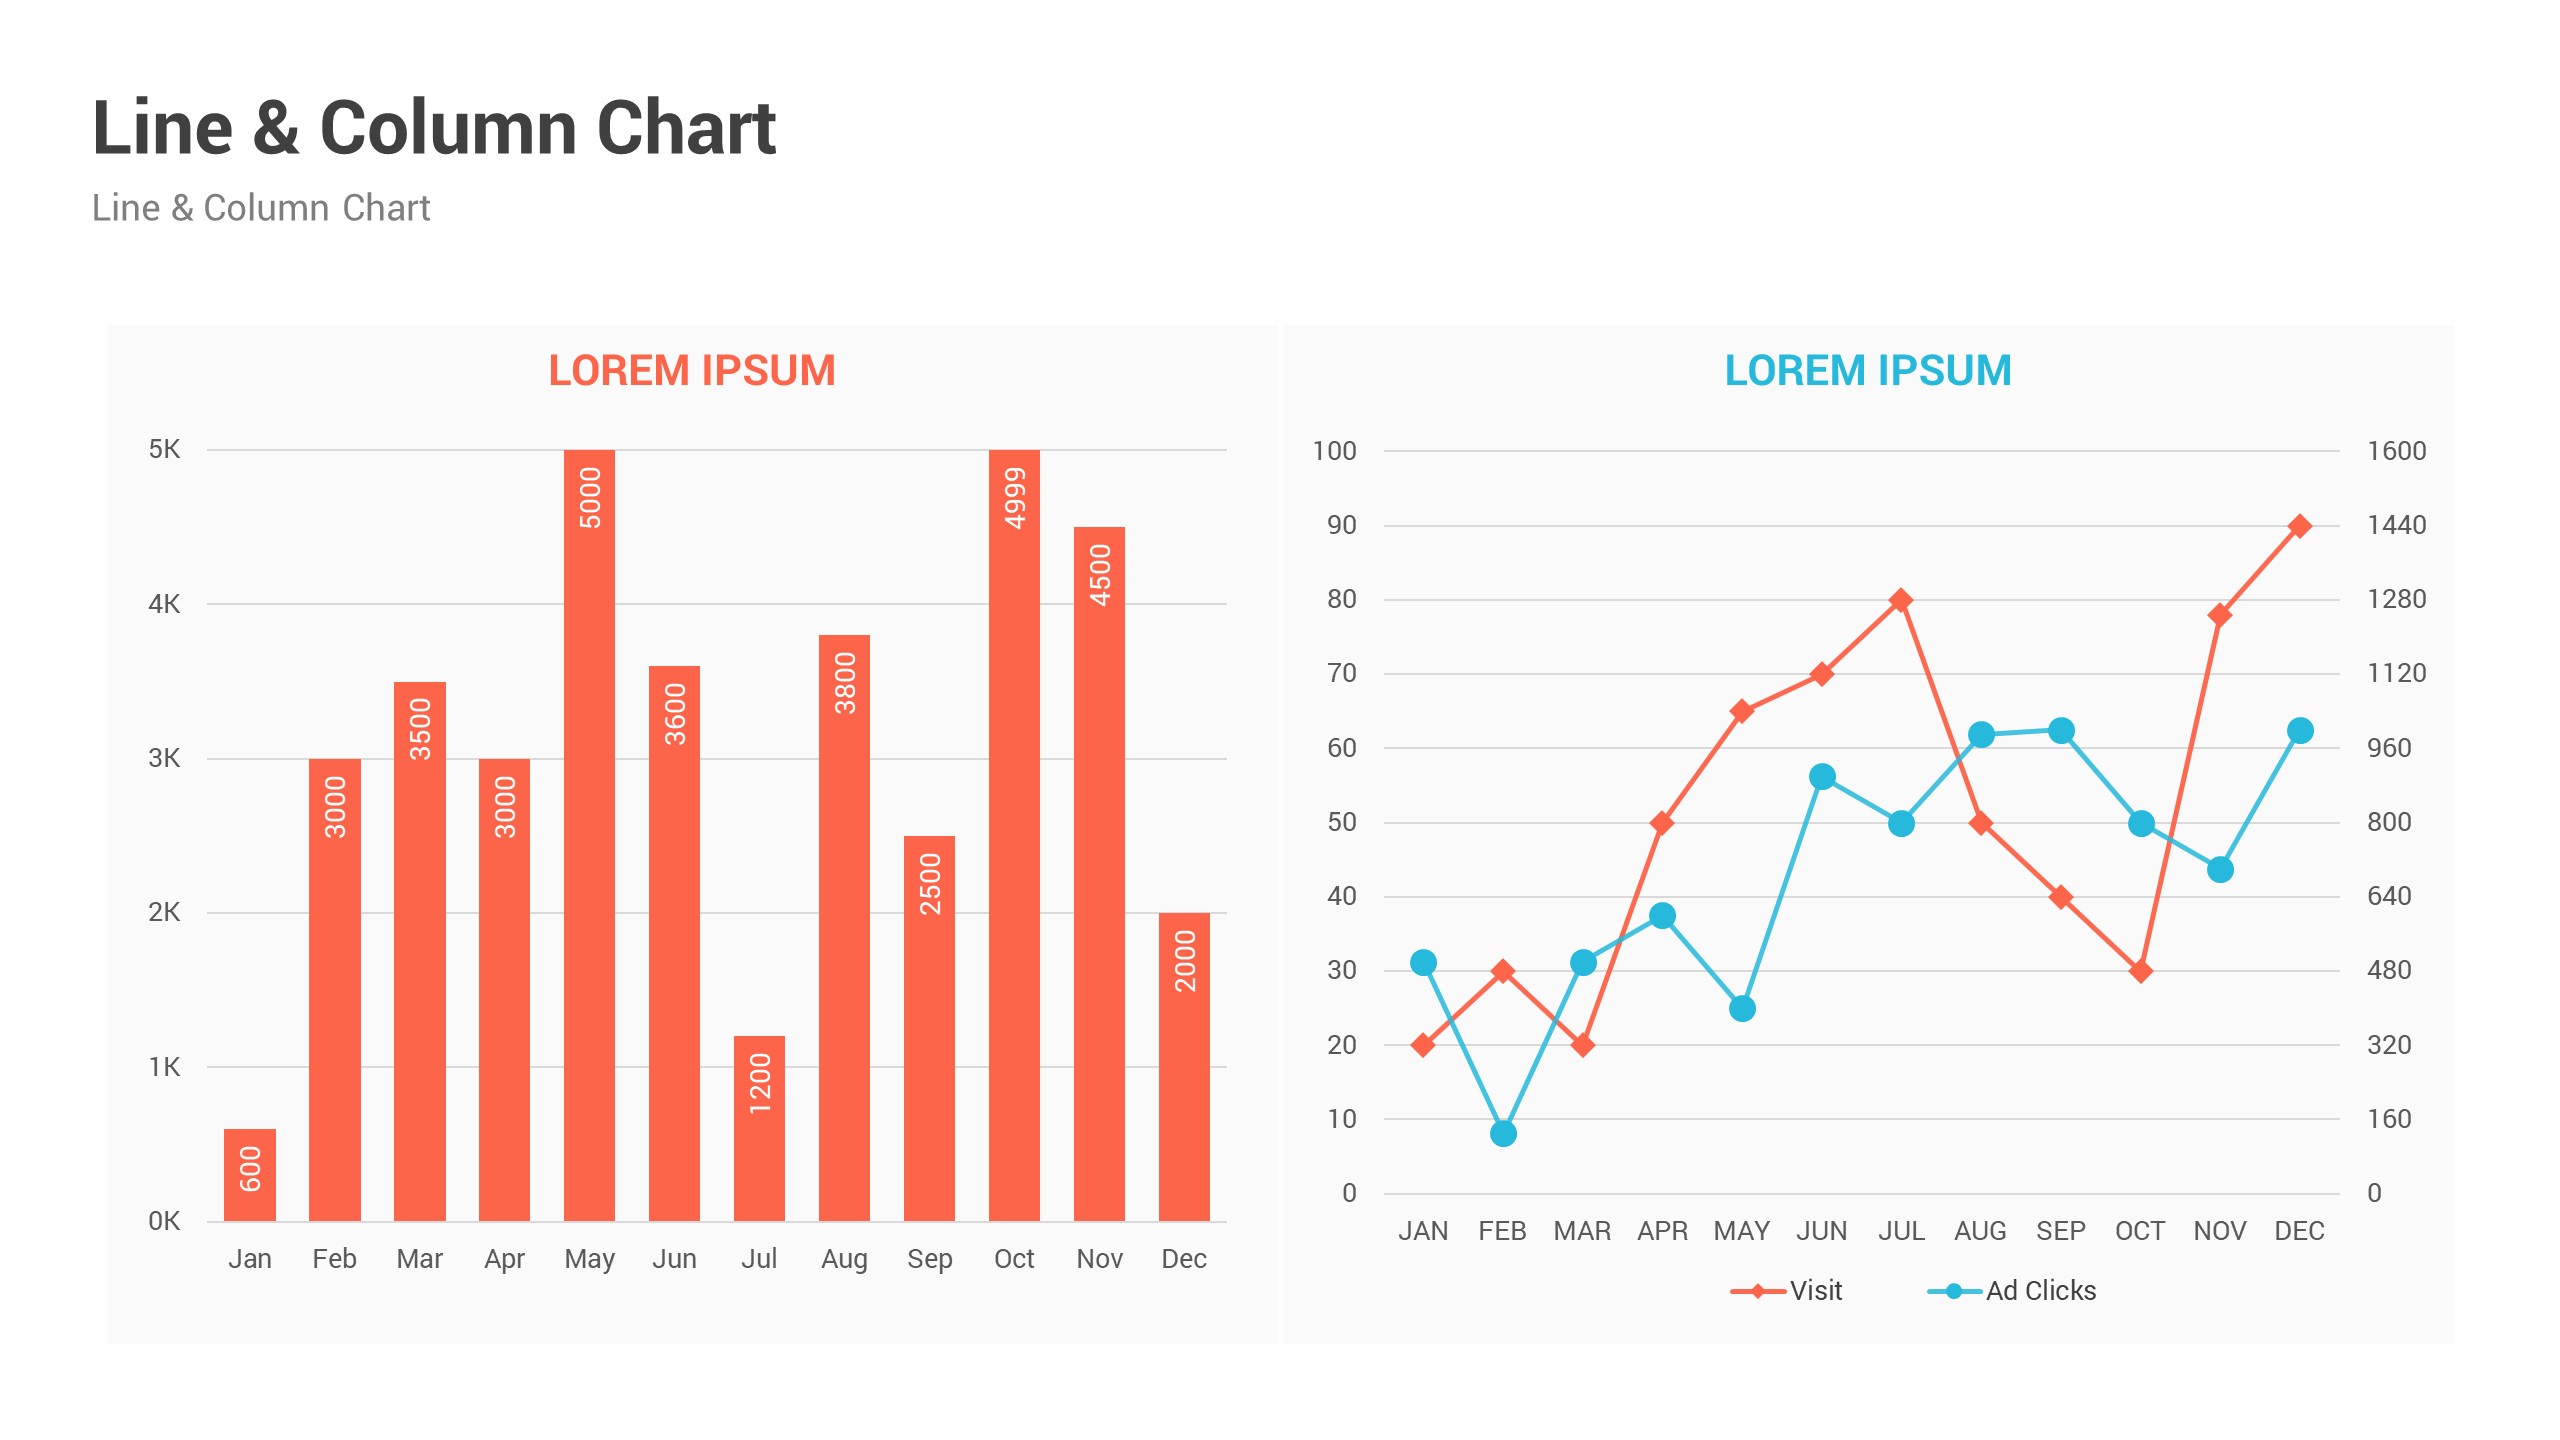
- Column Charts
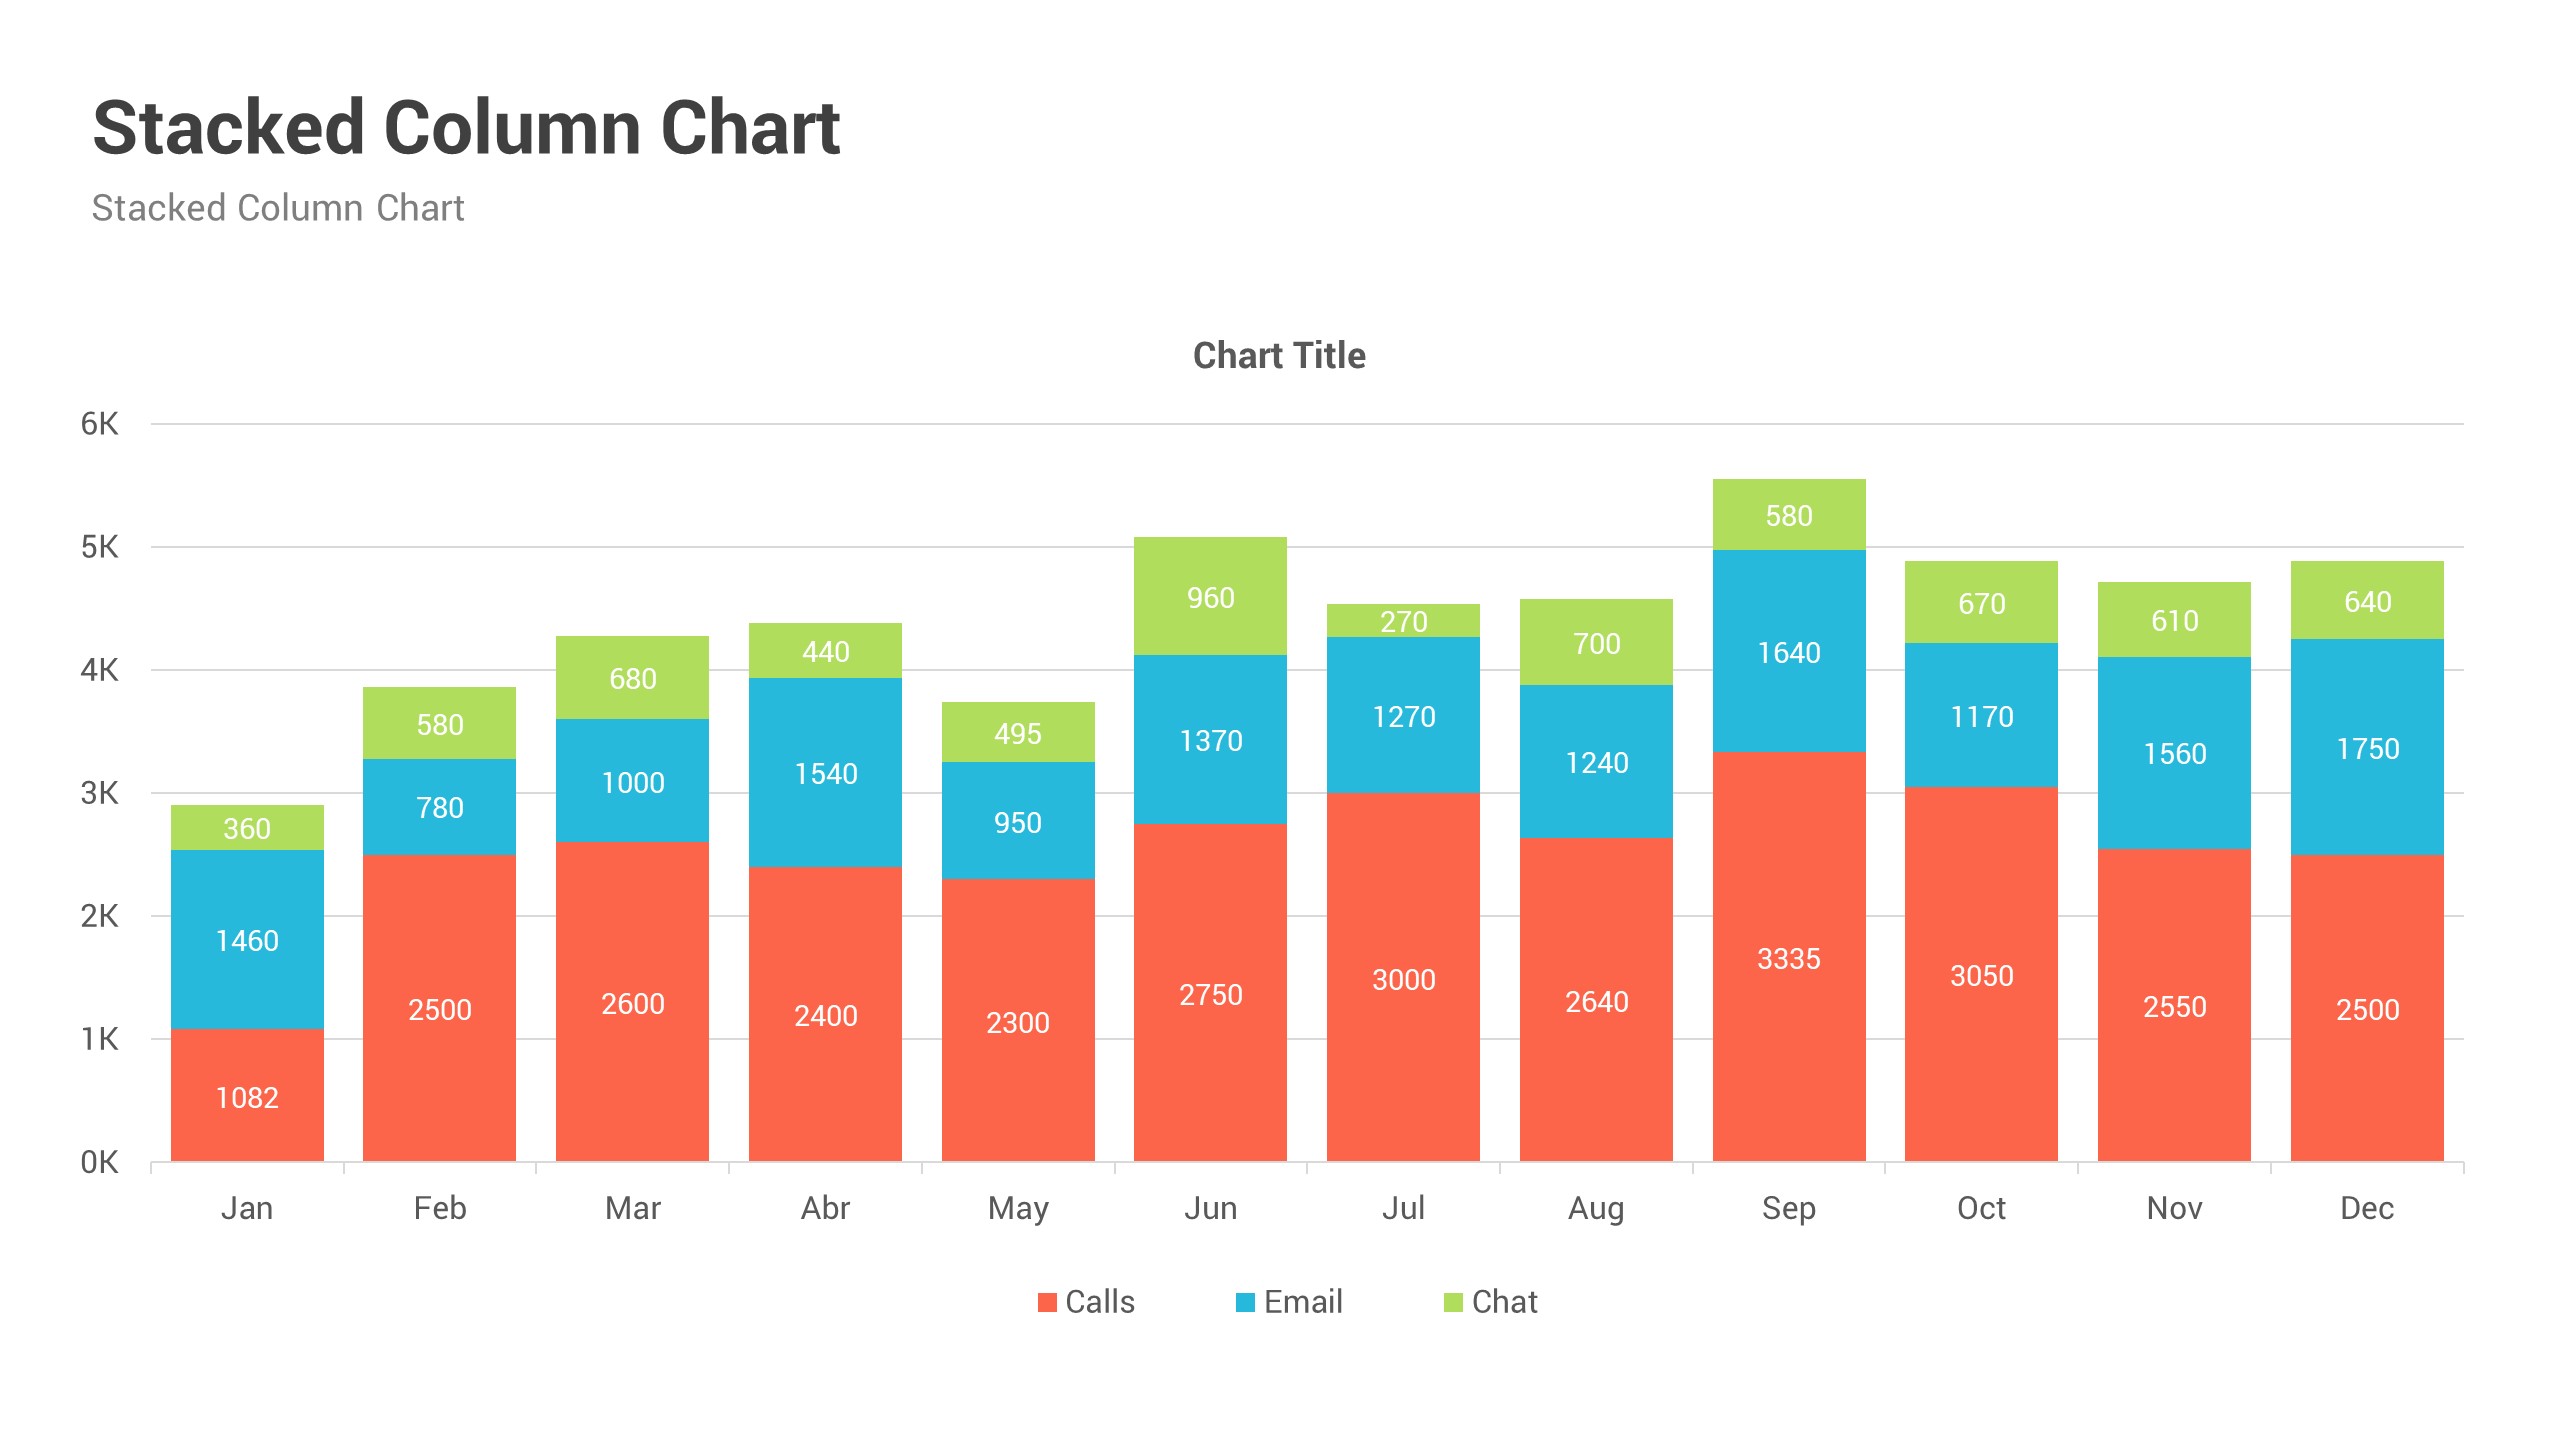
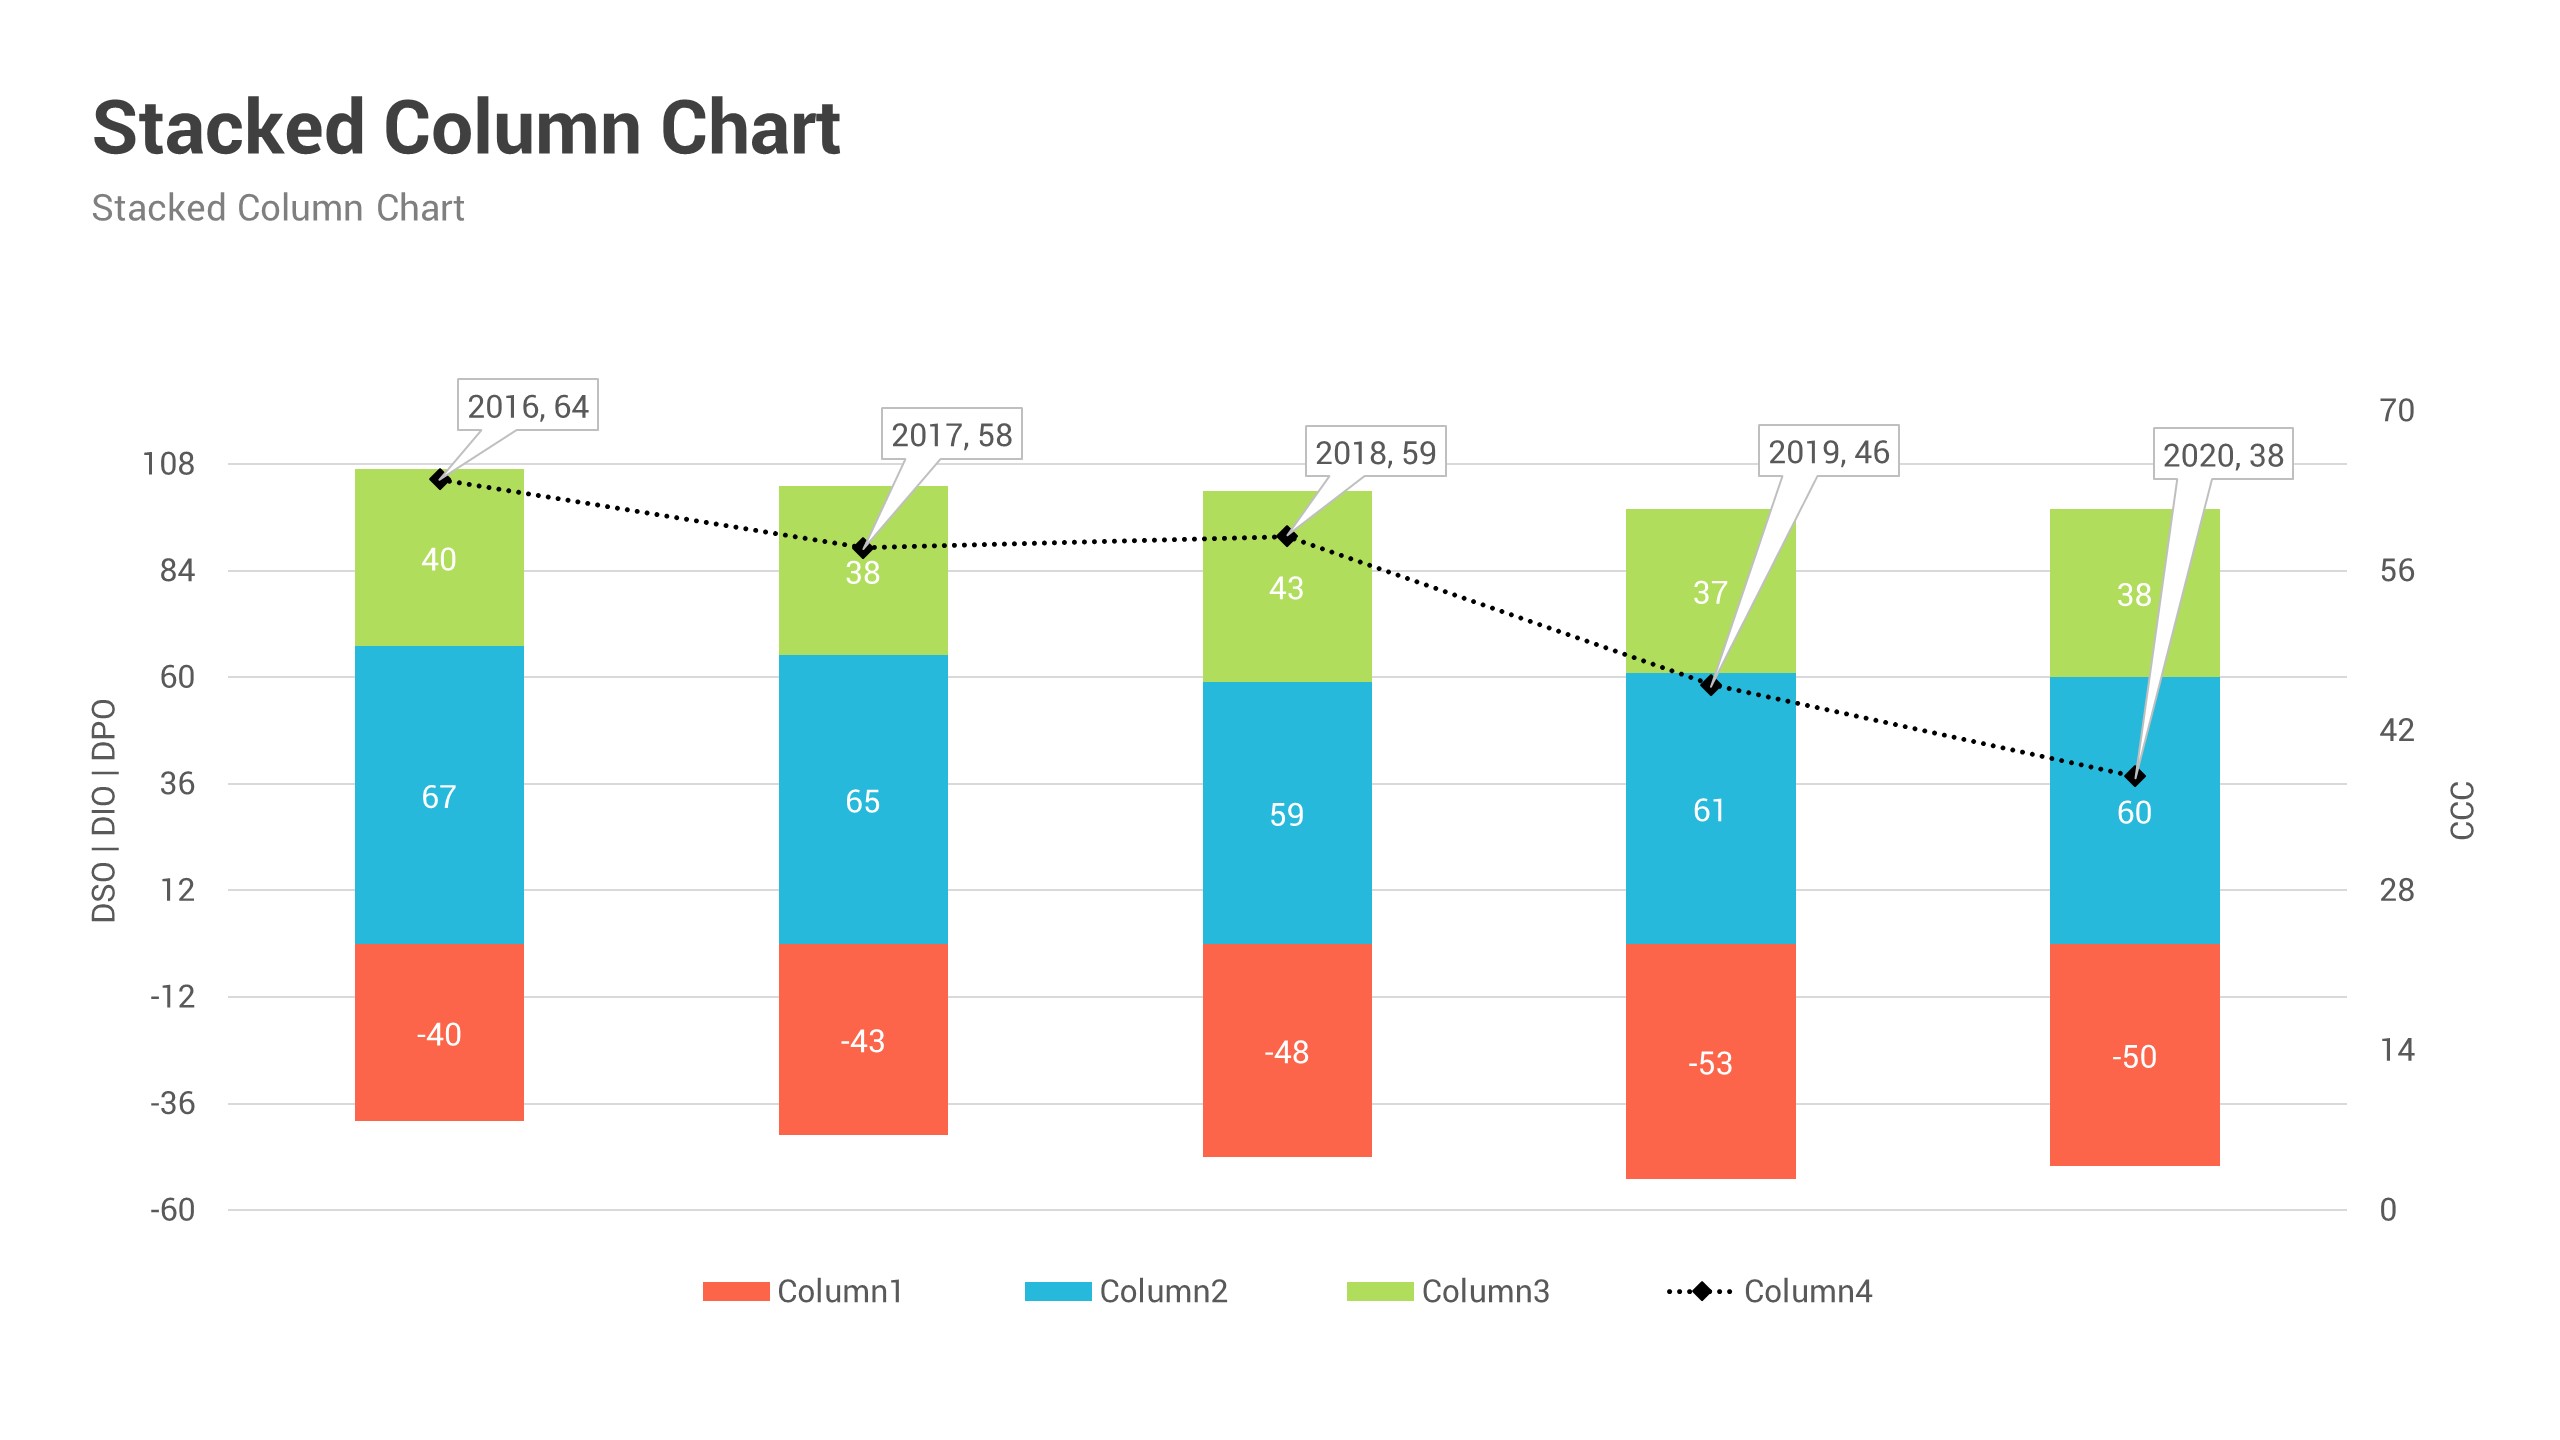
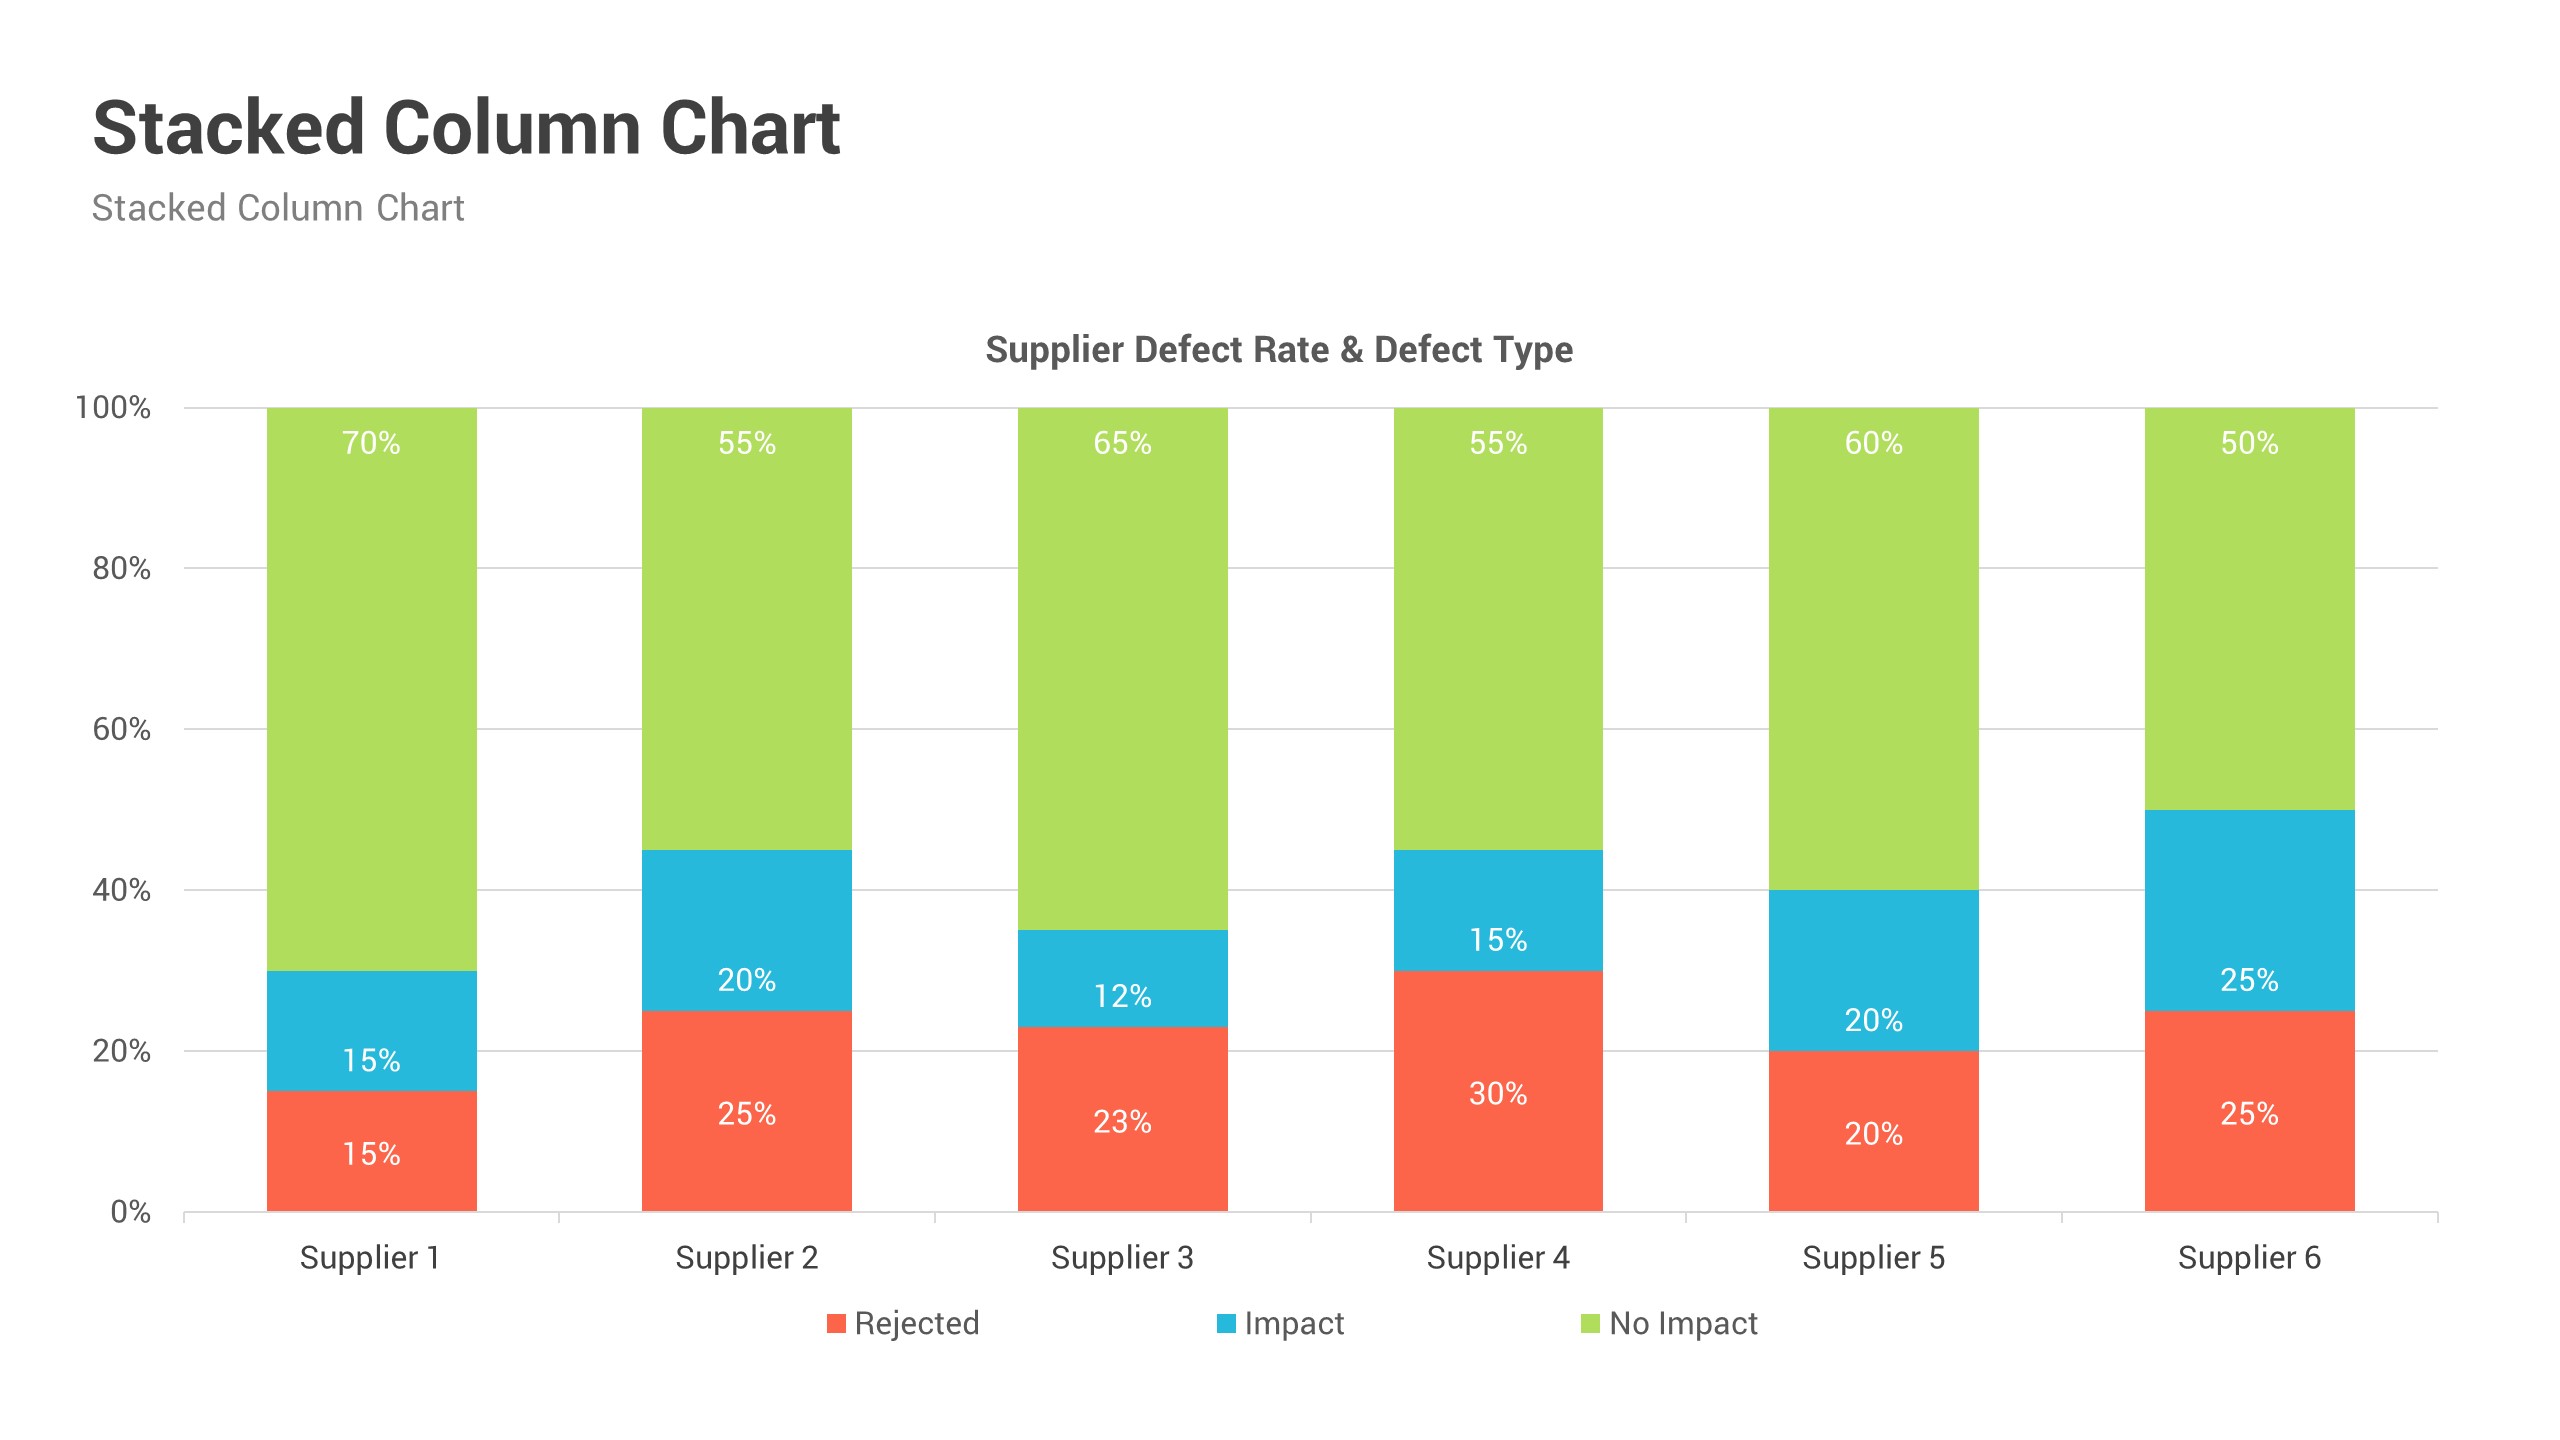
- Stacked Column Charts
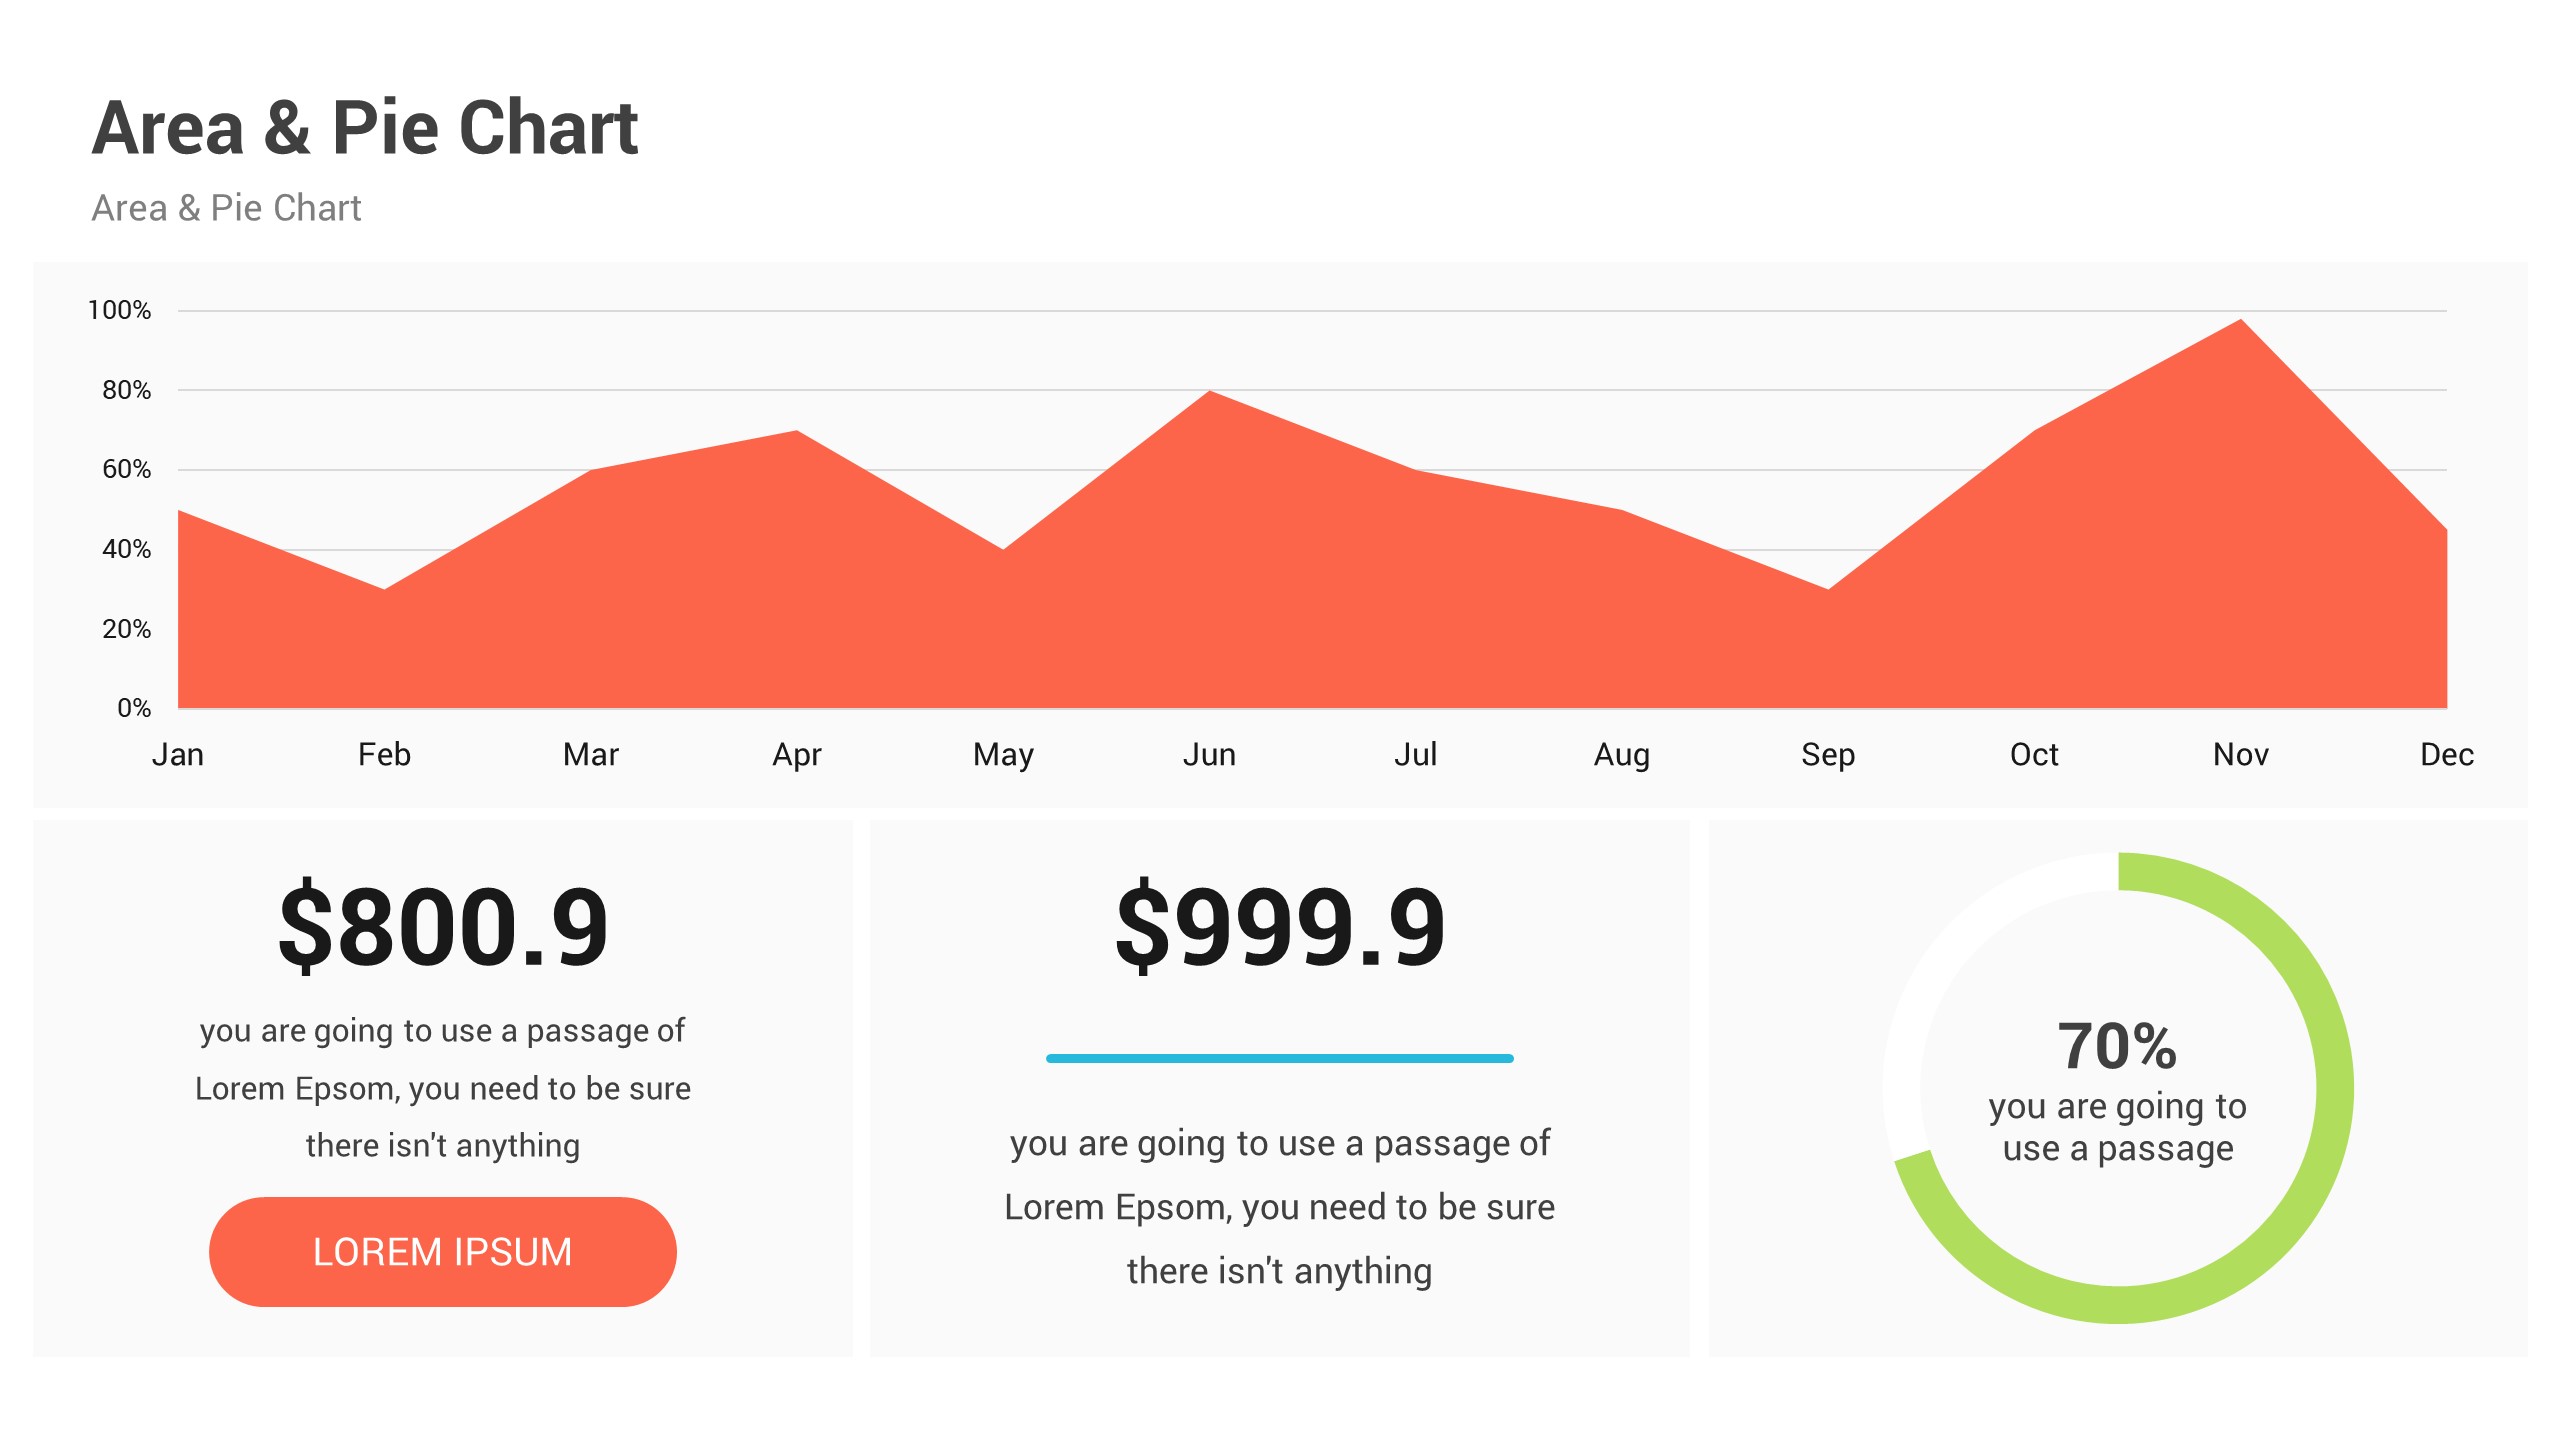
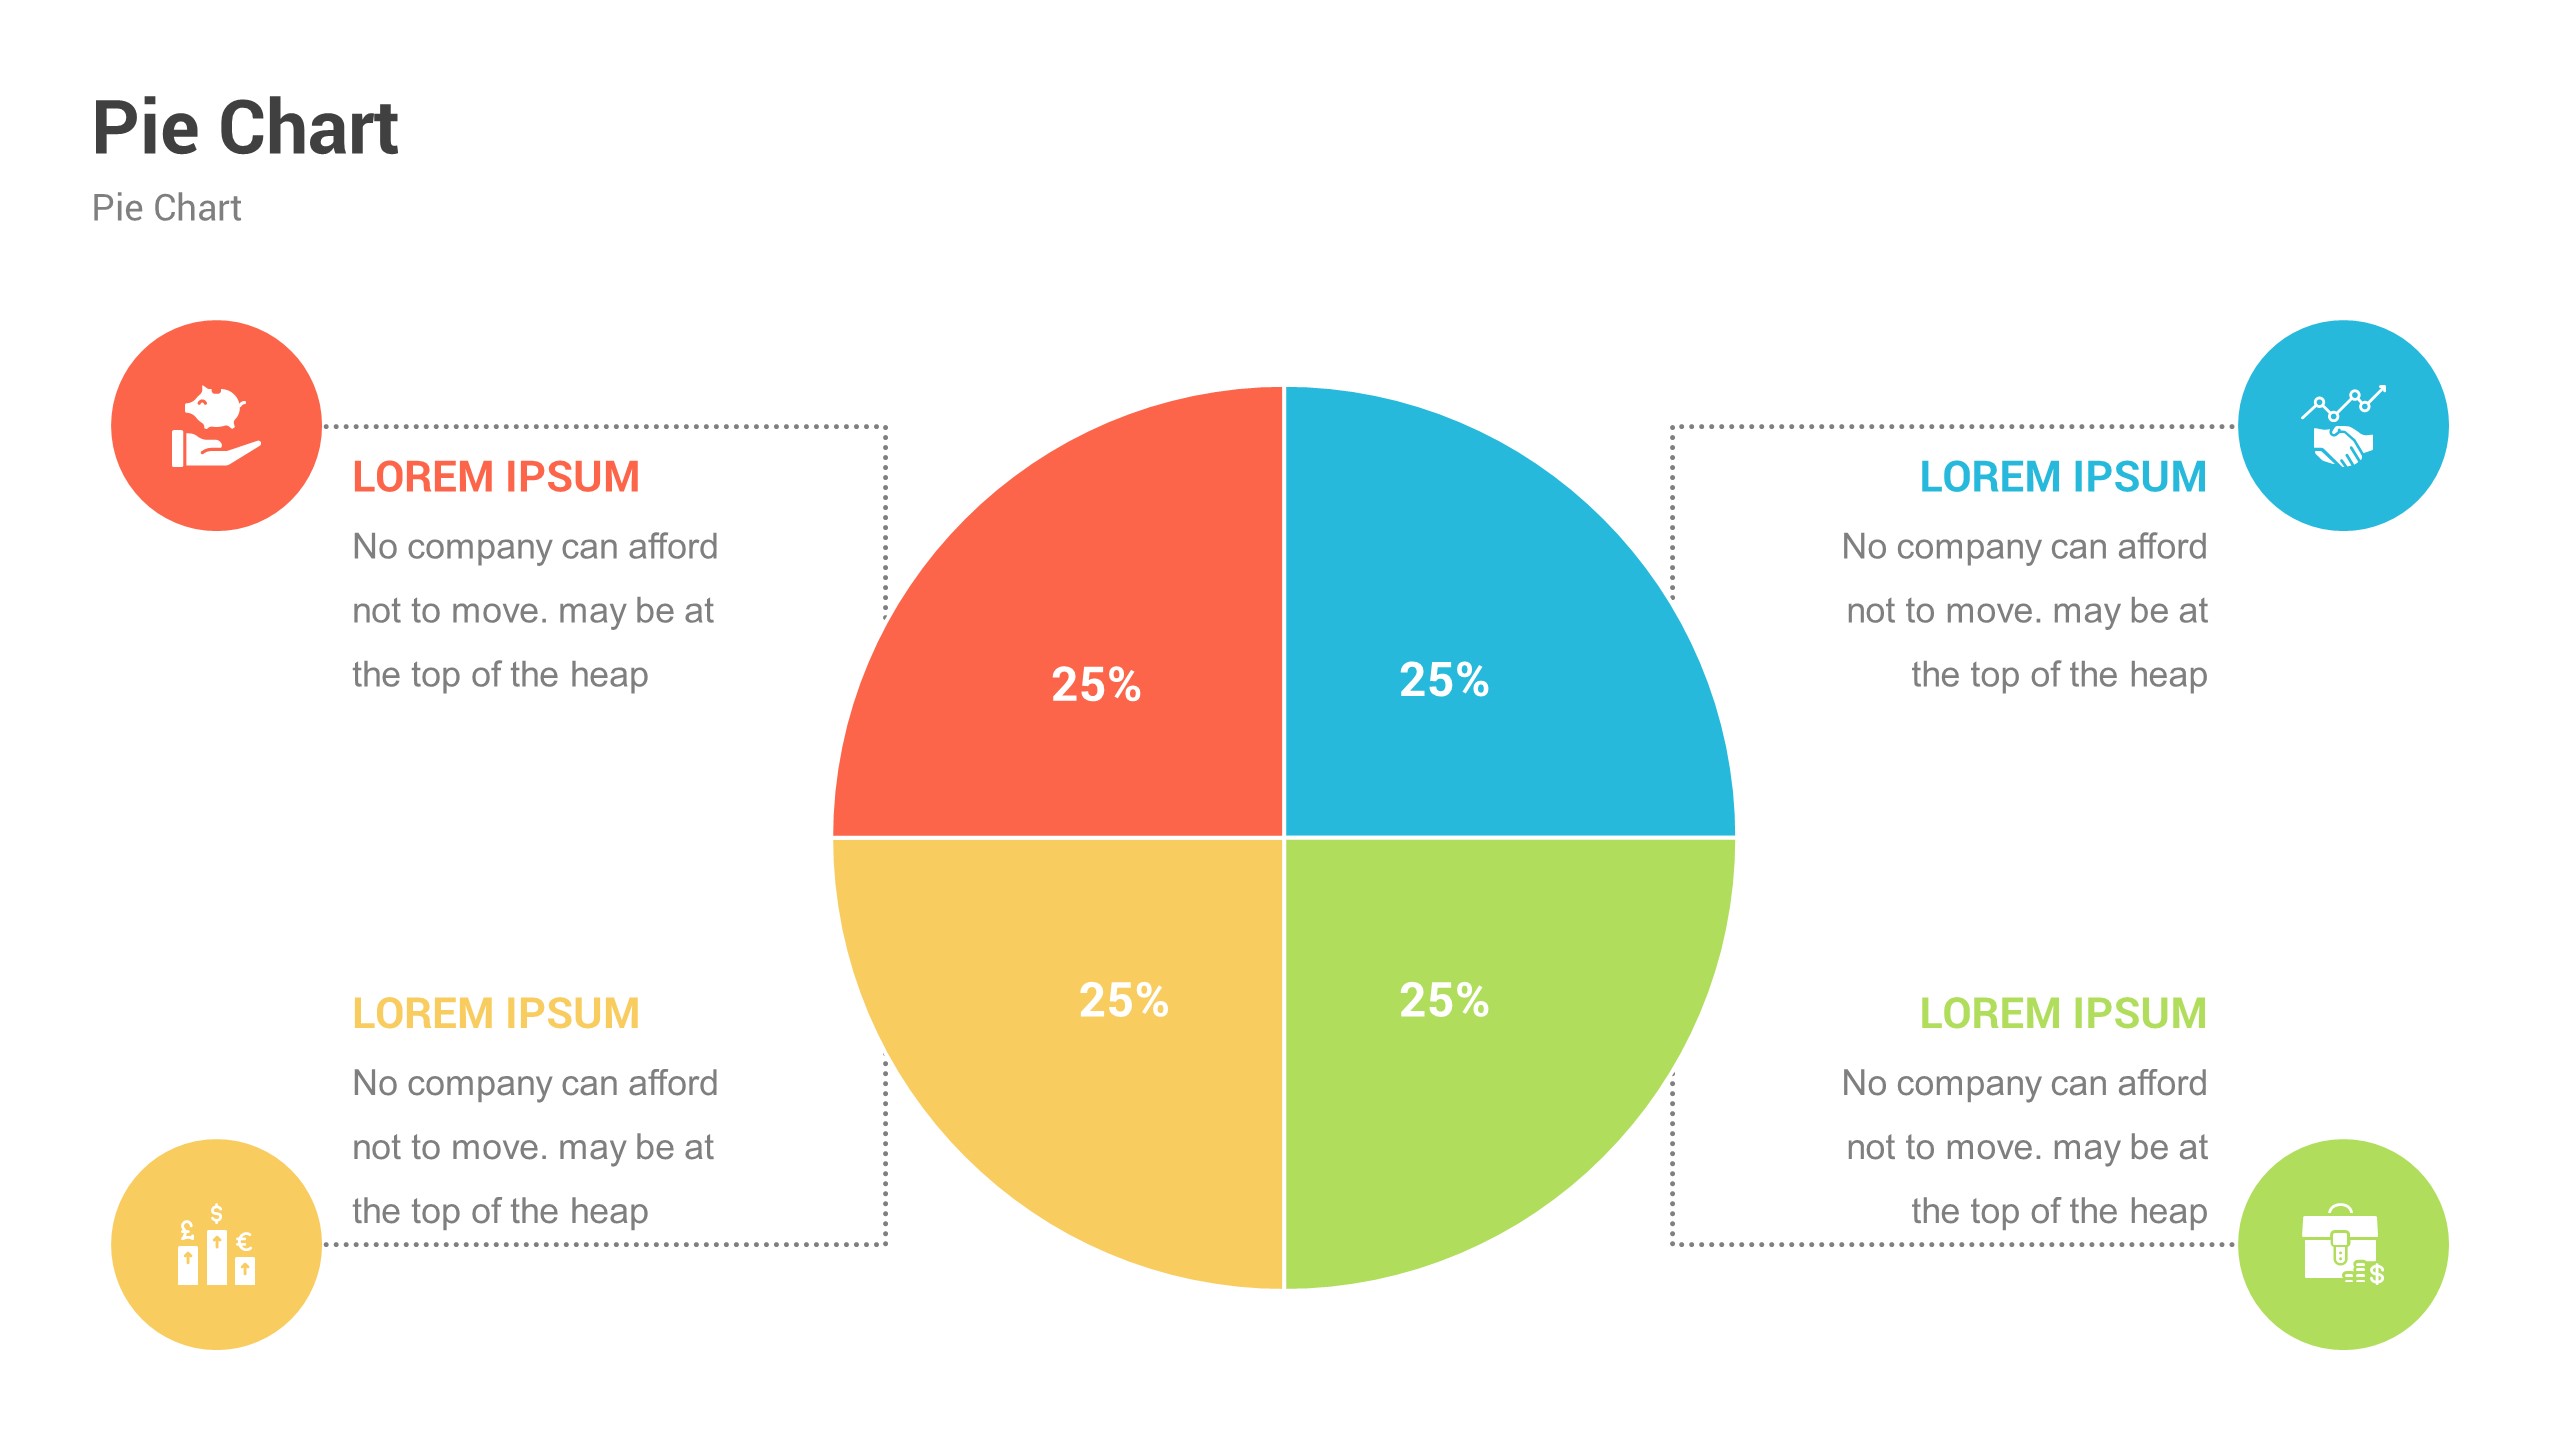
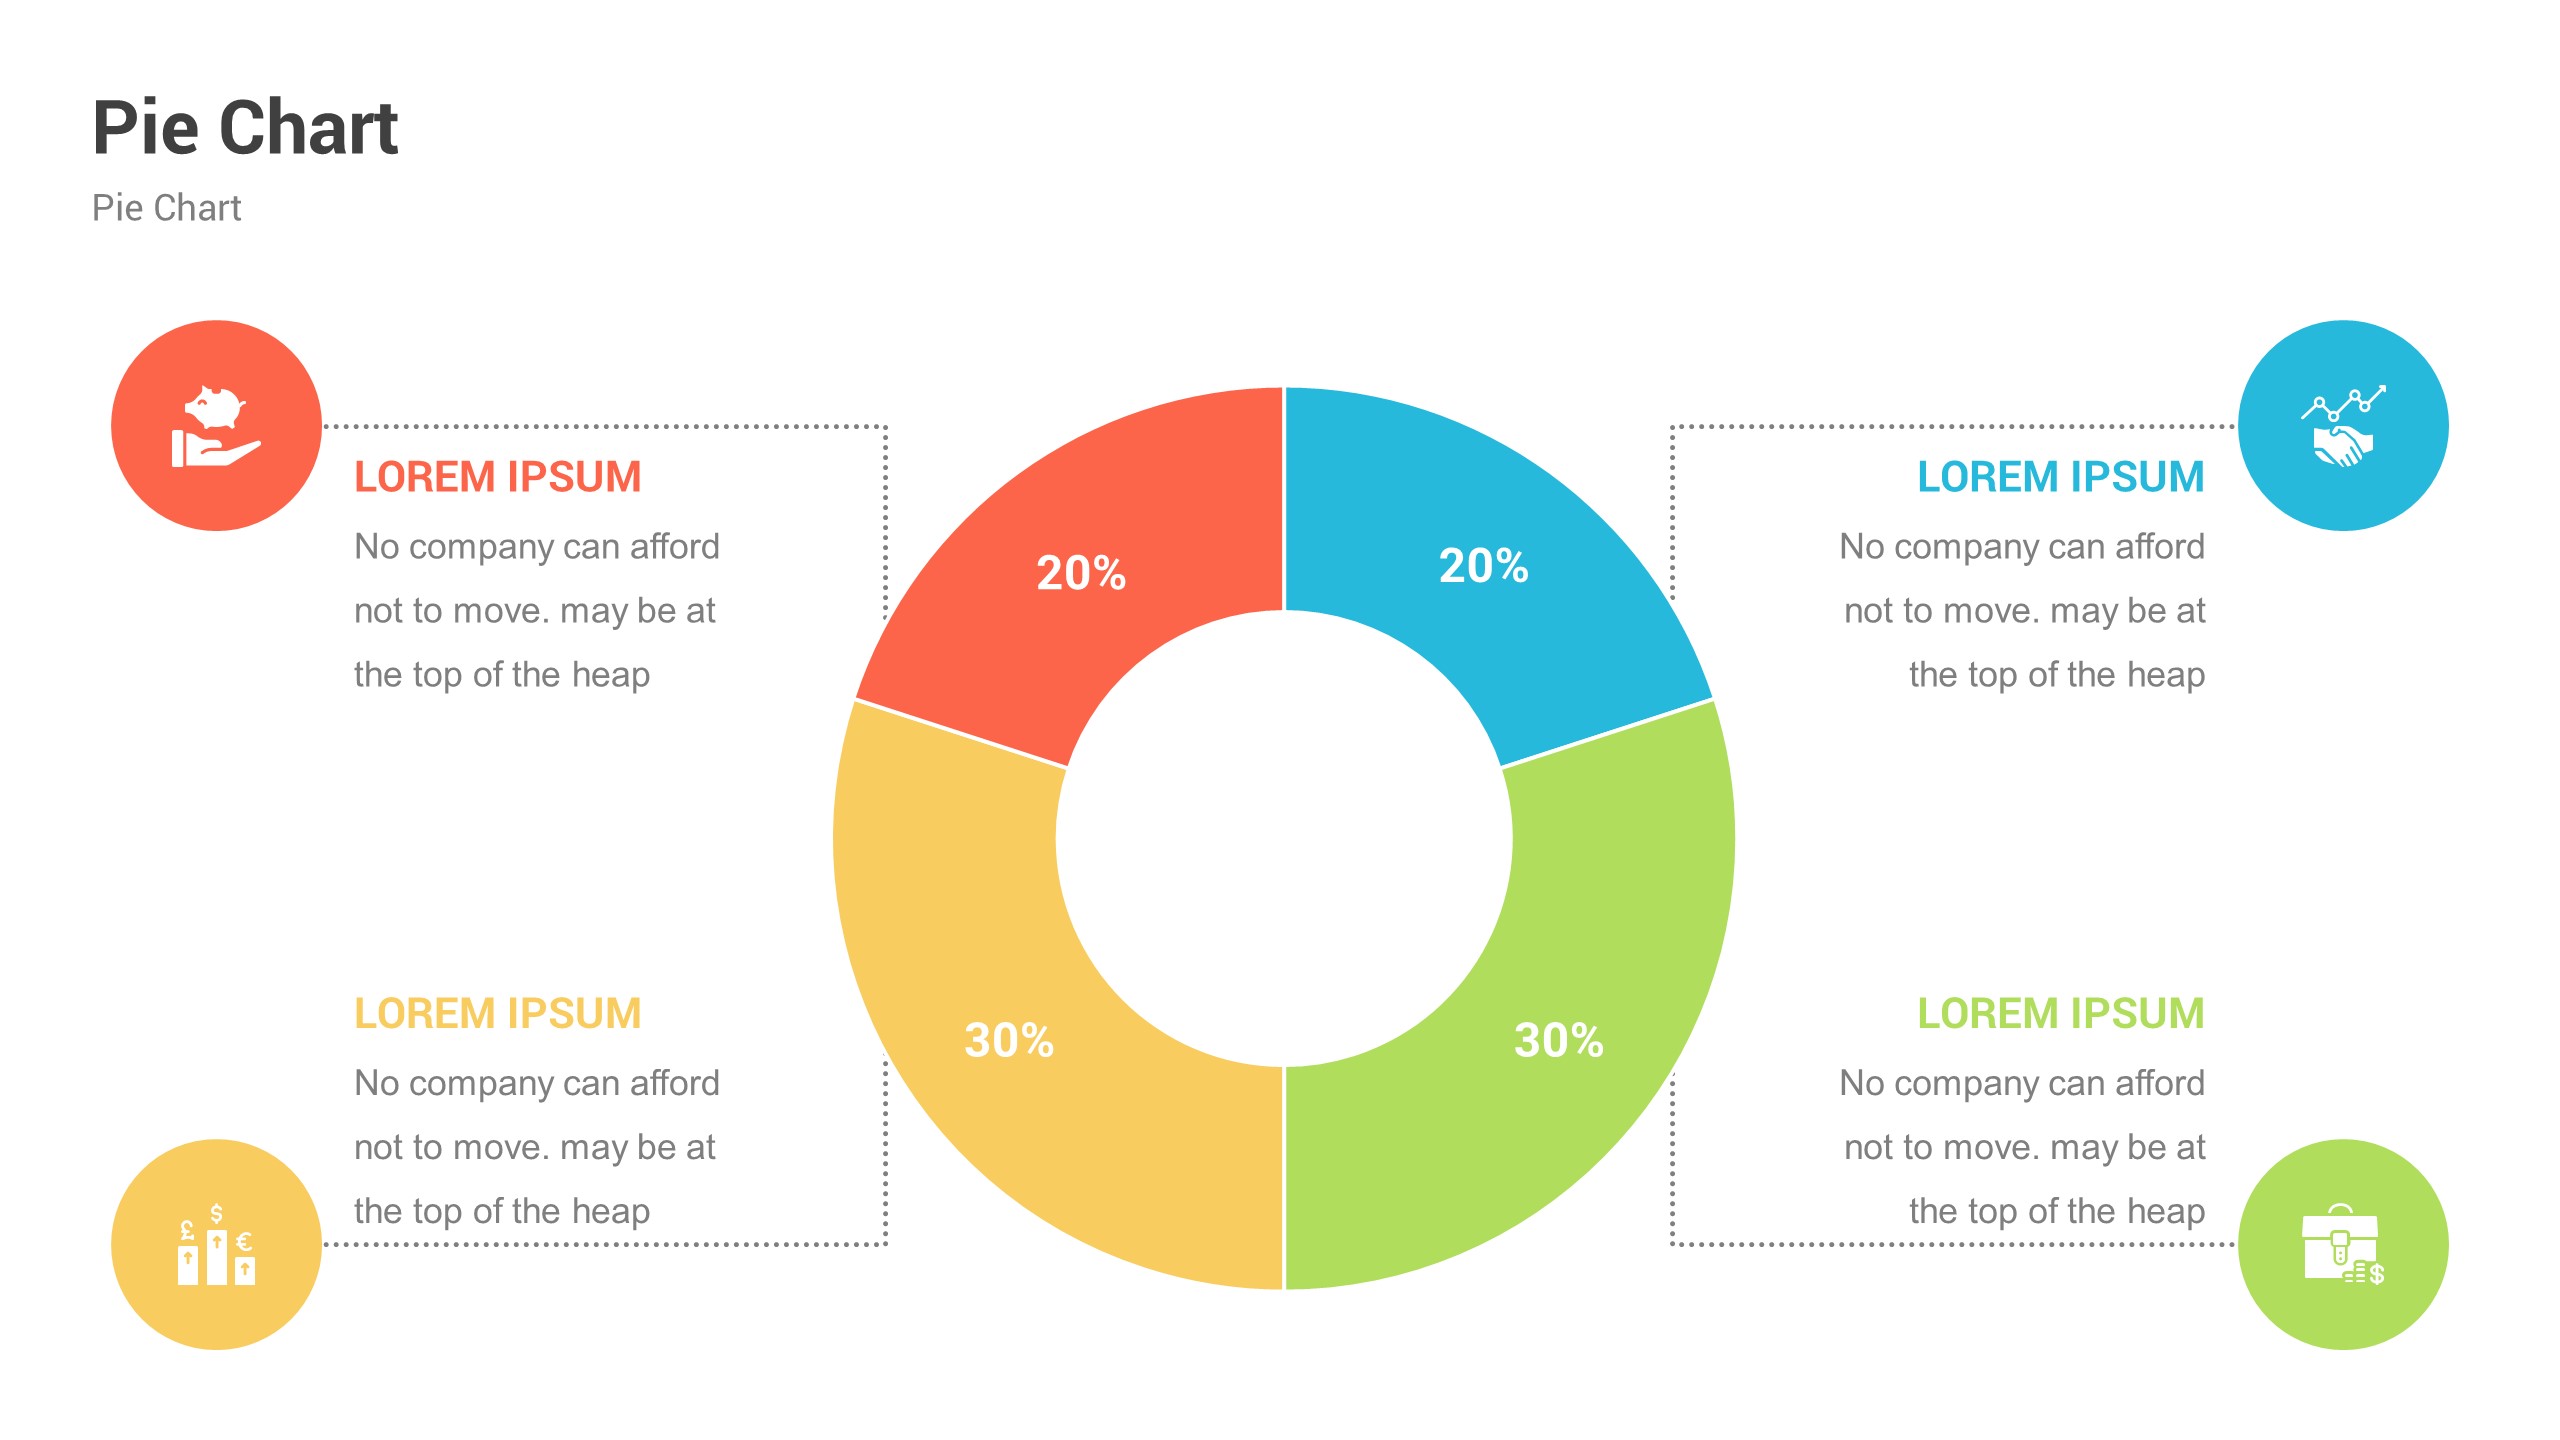
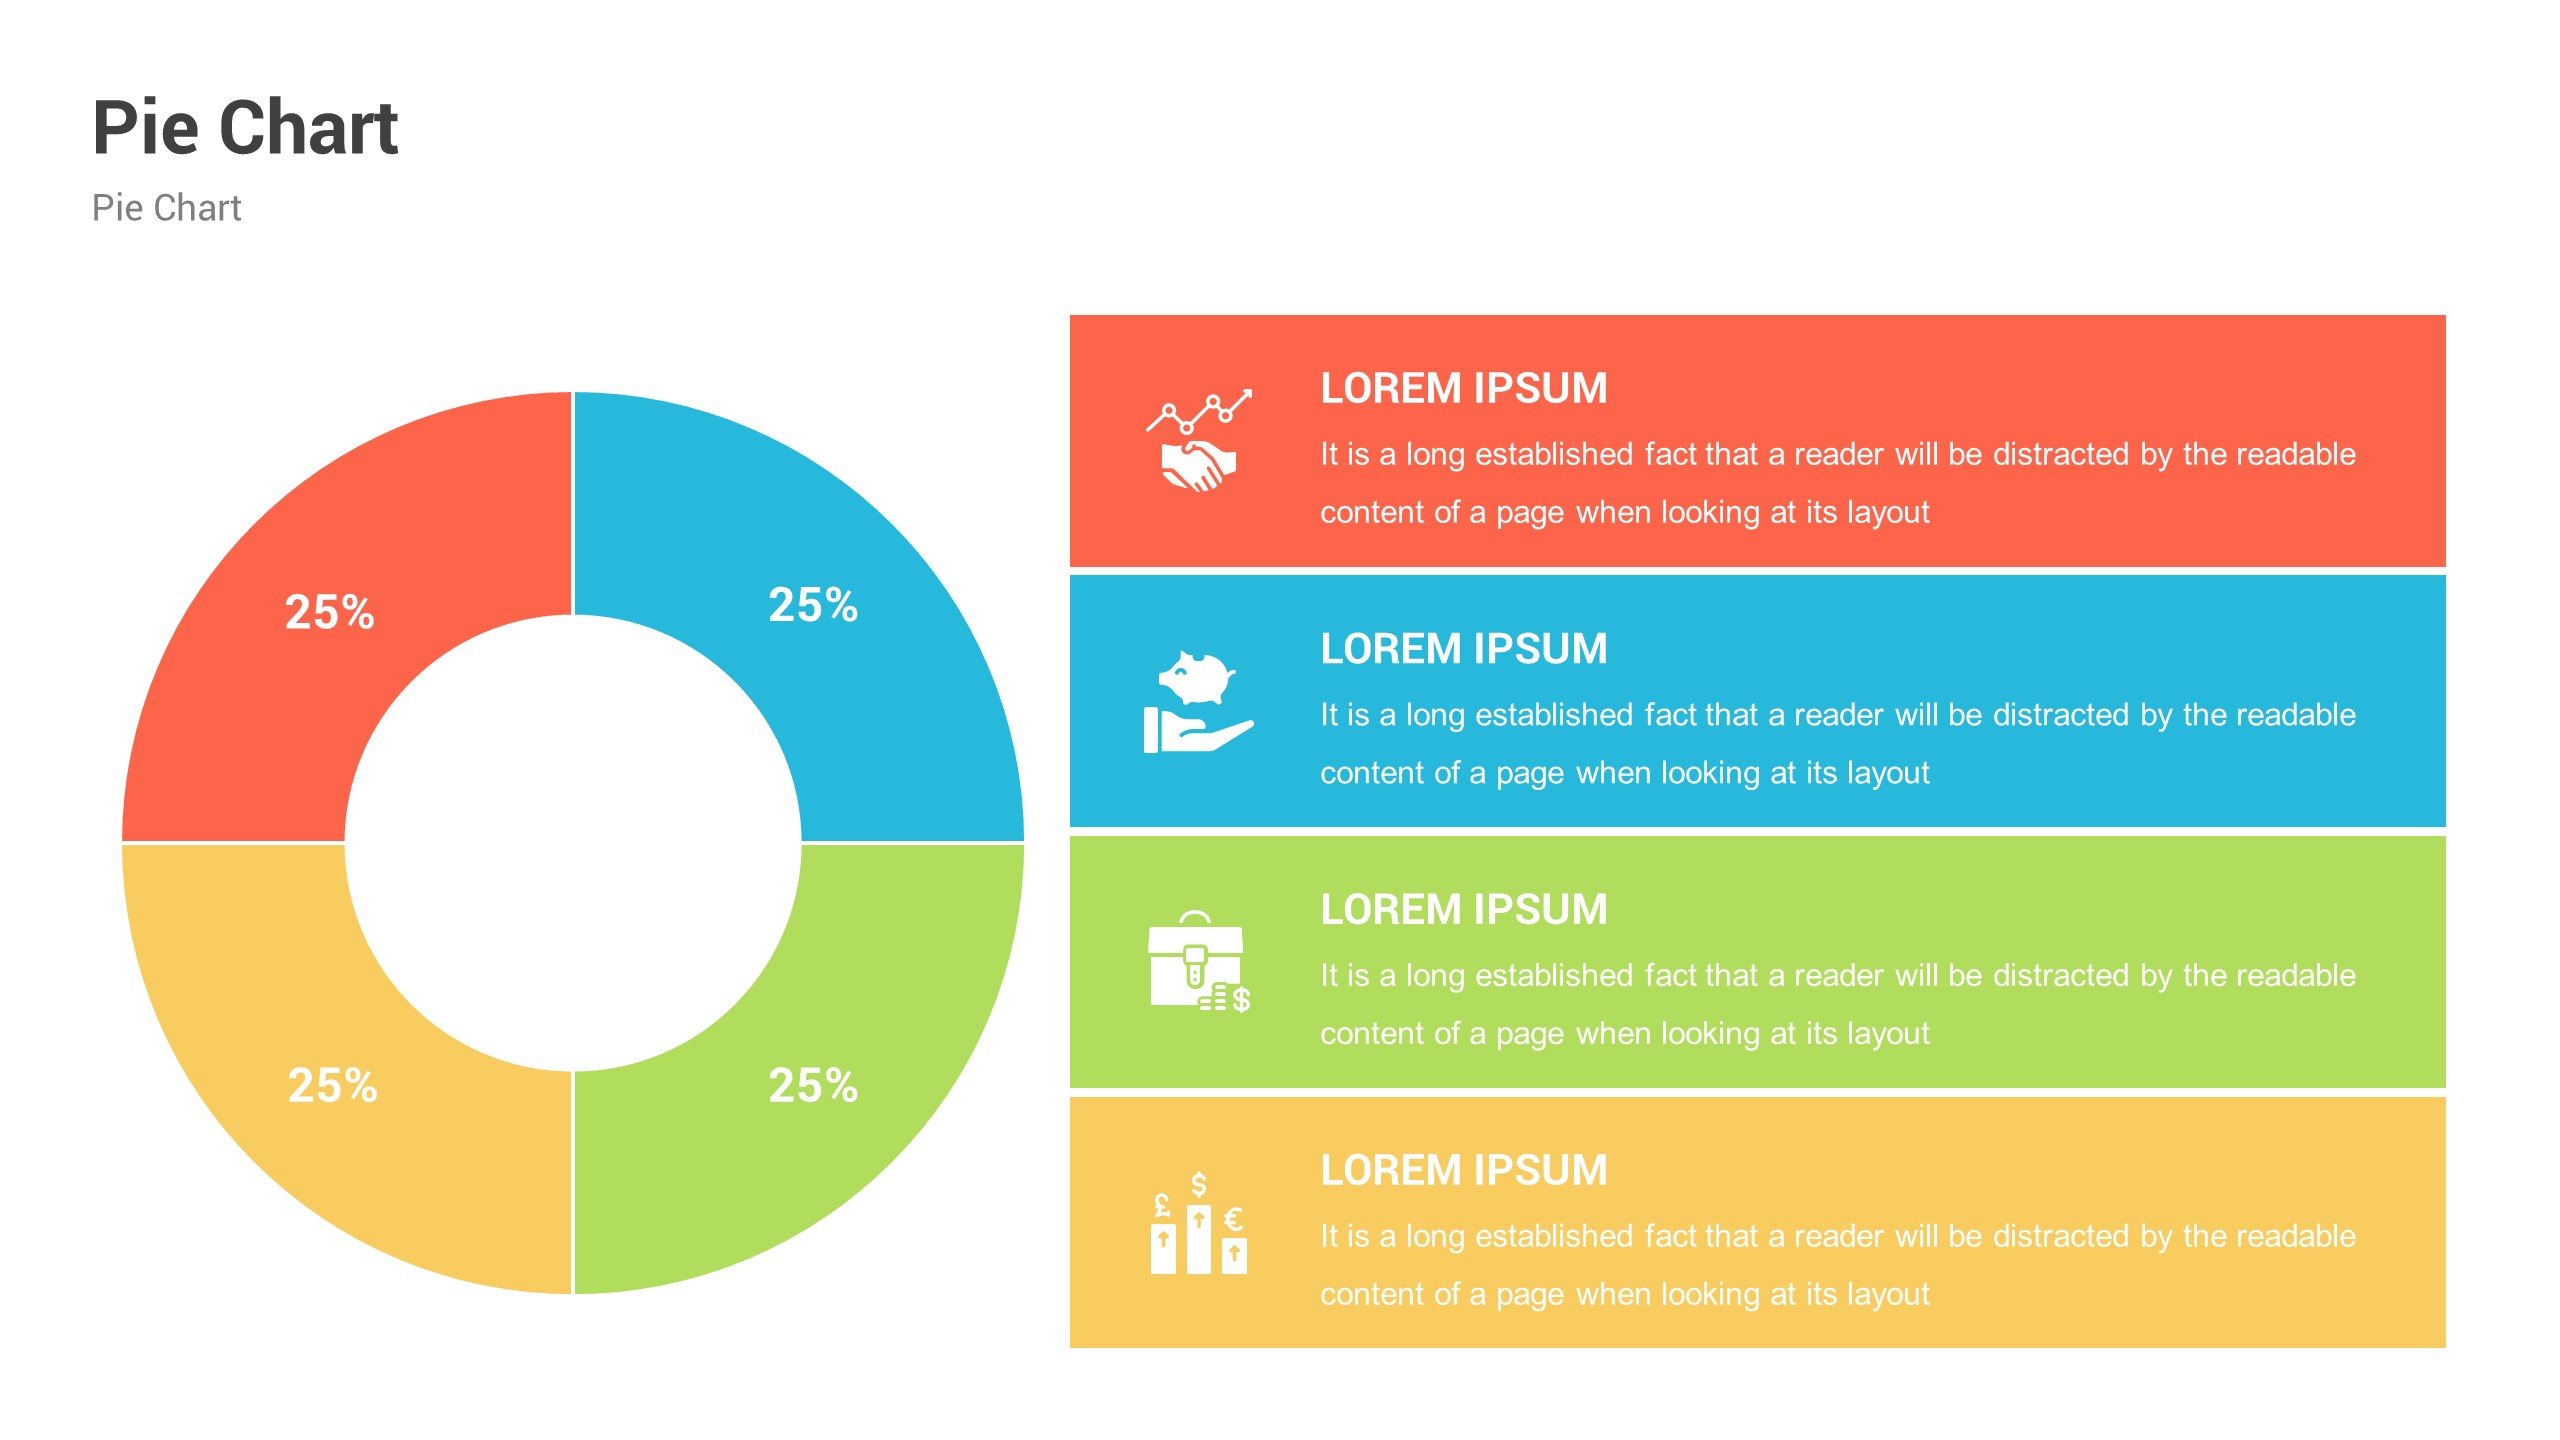
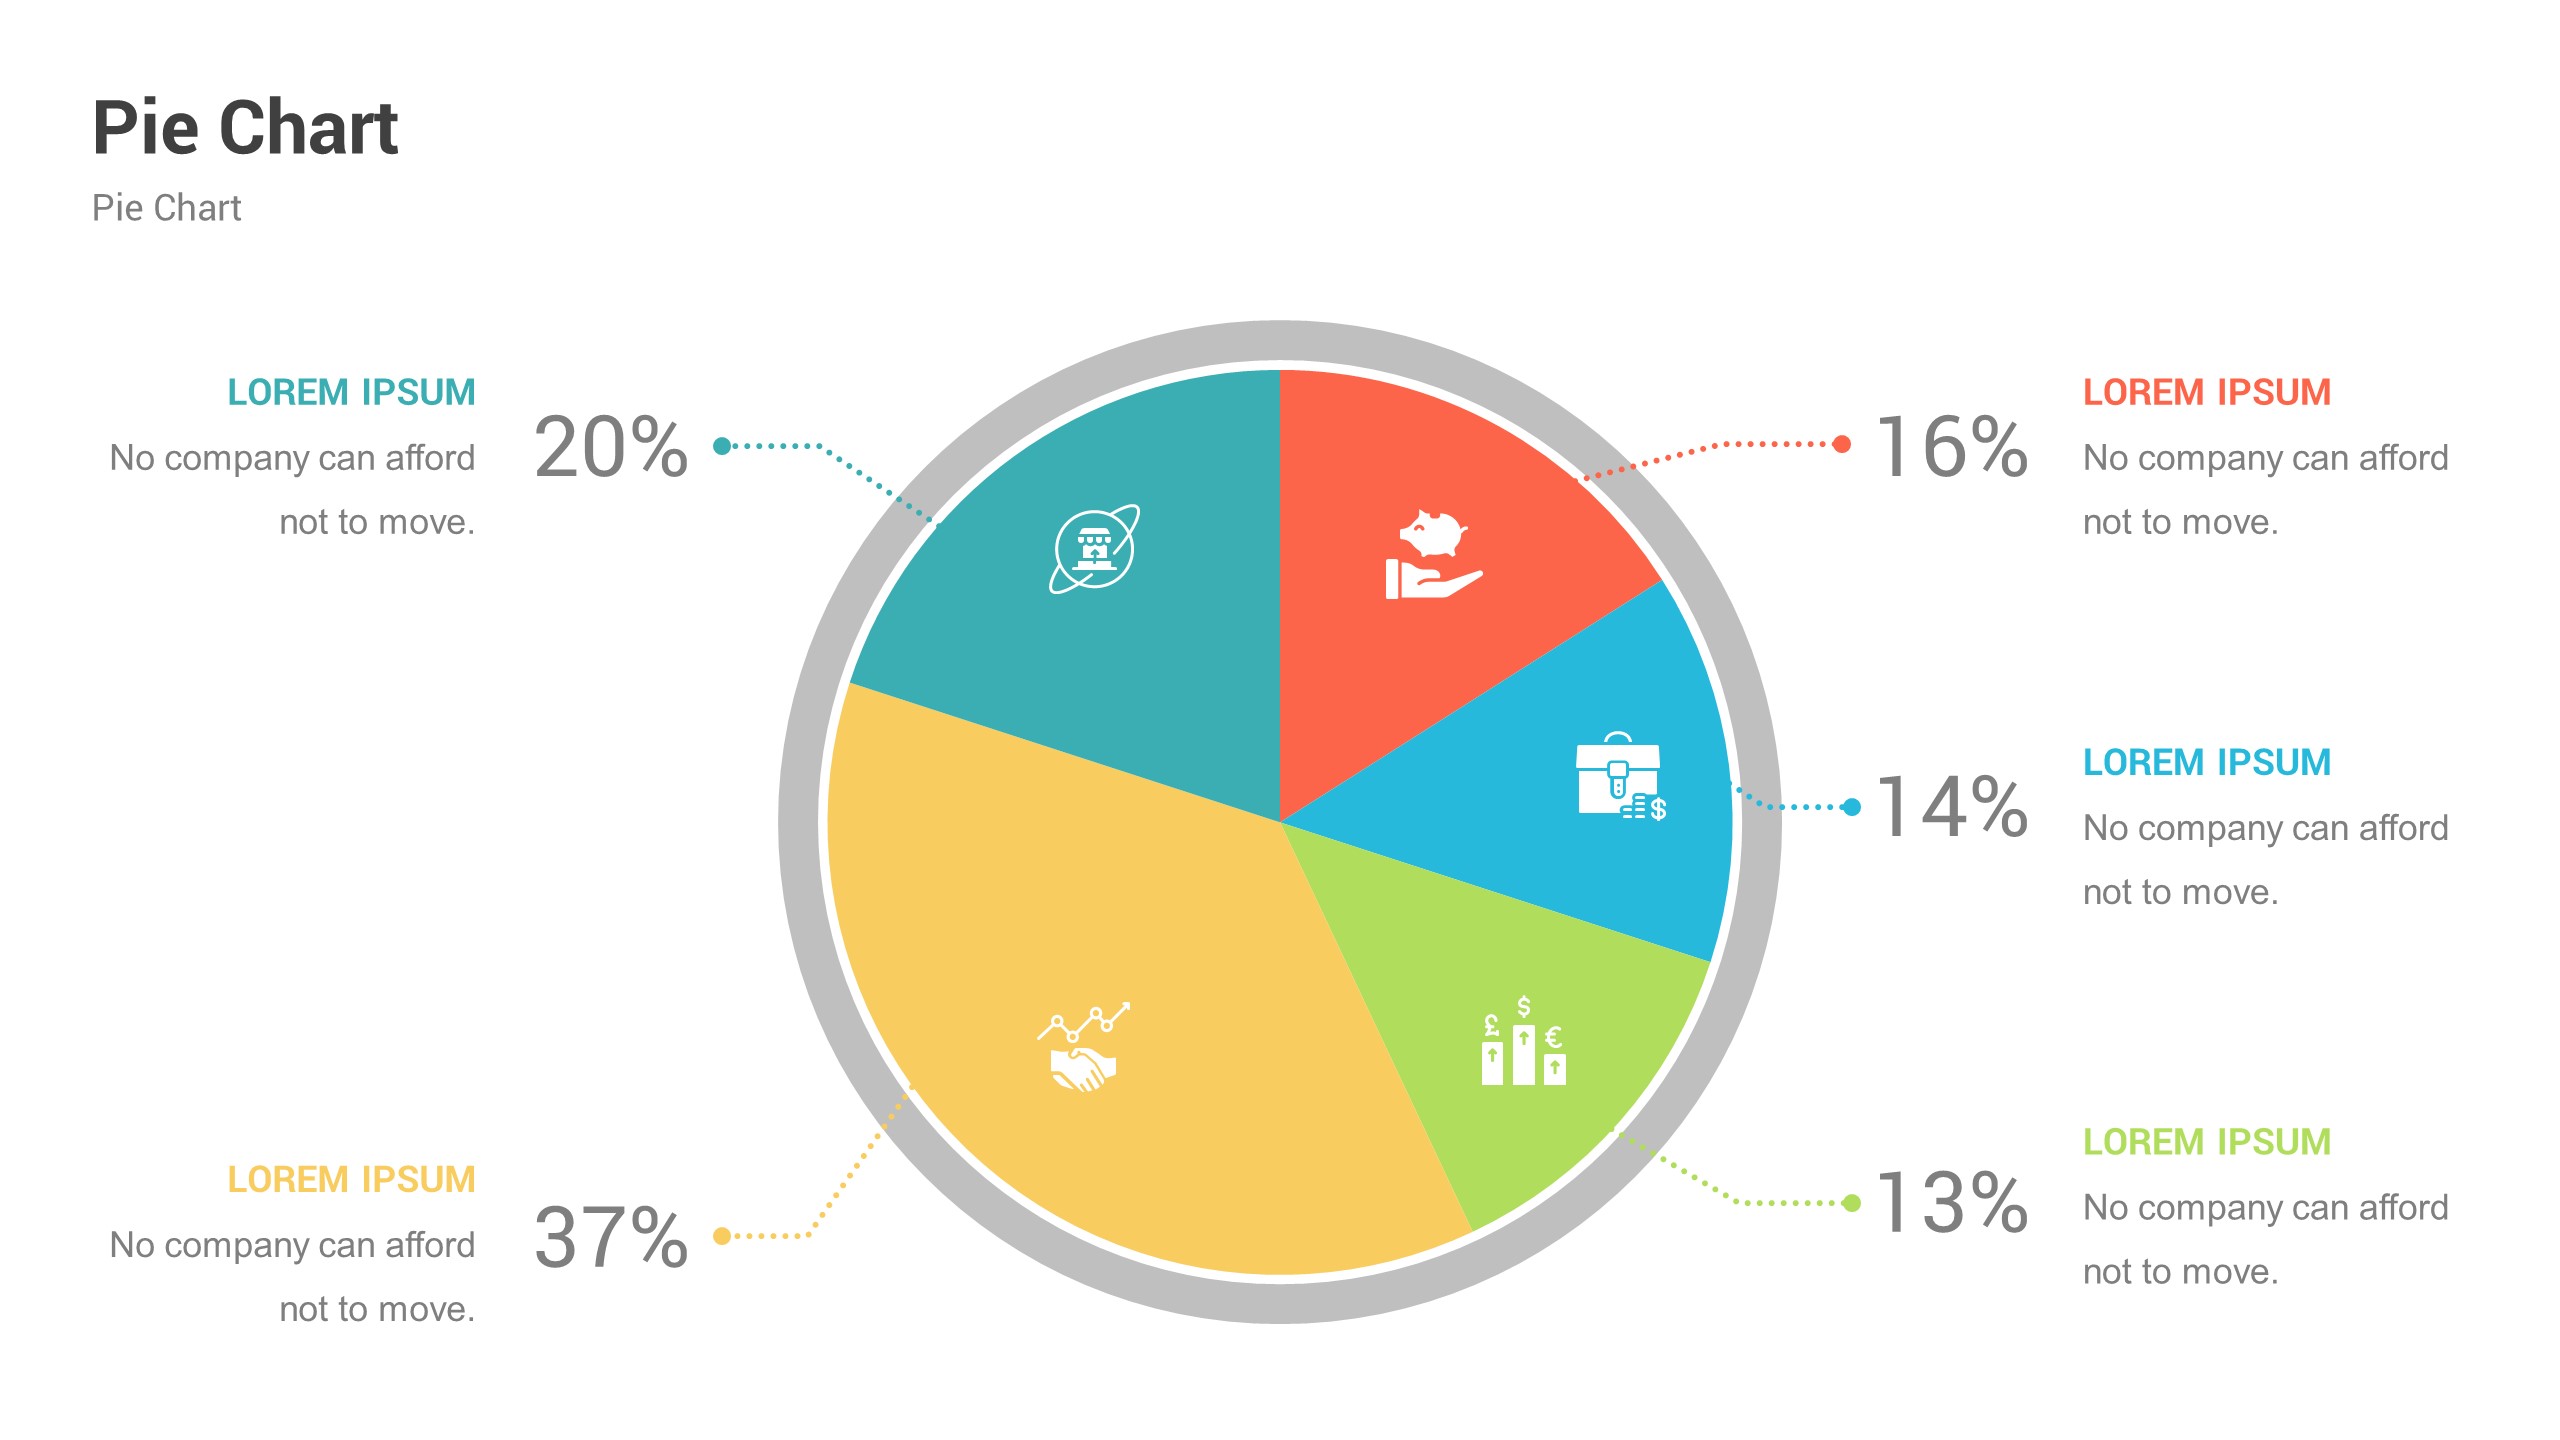
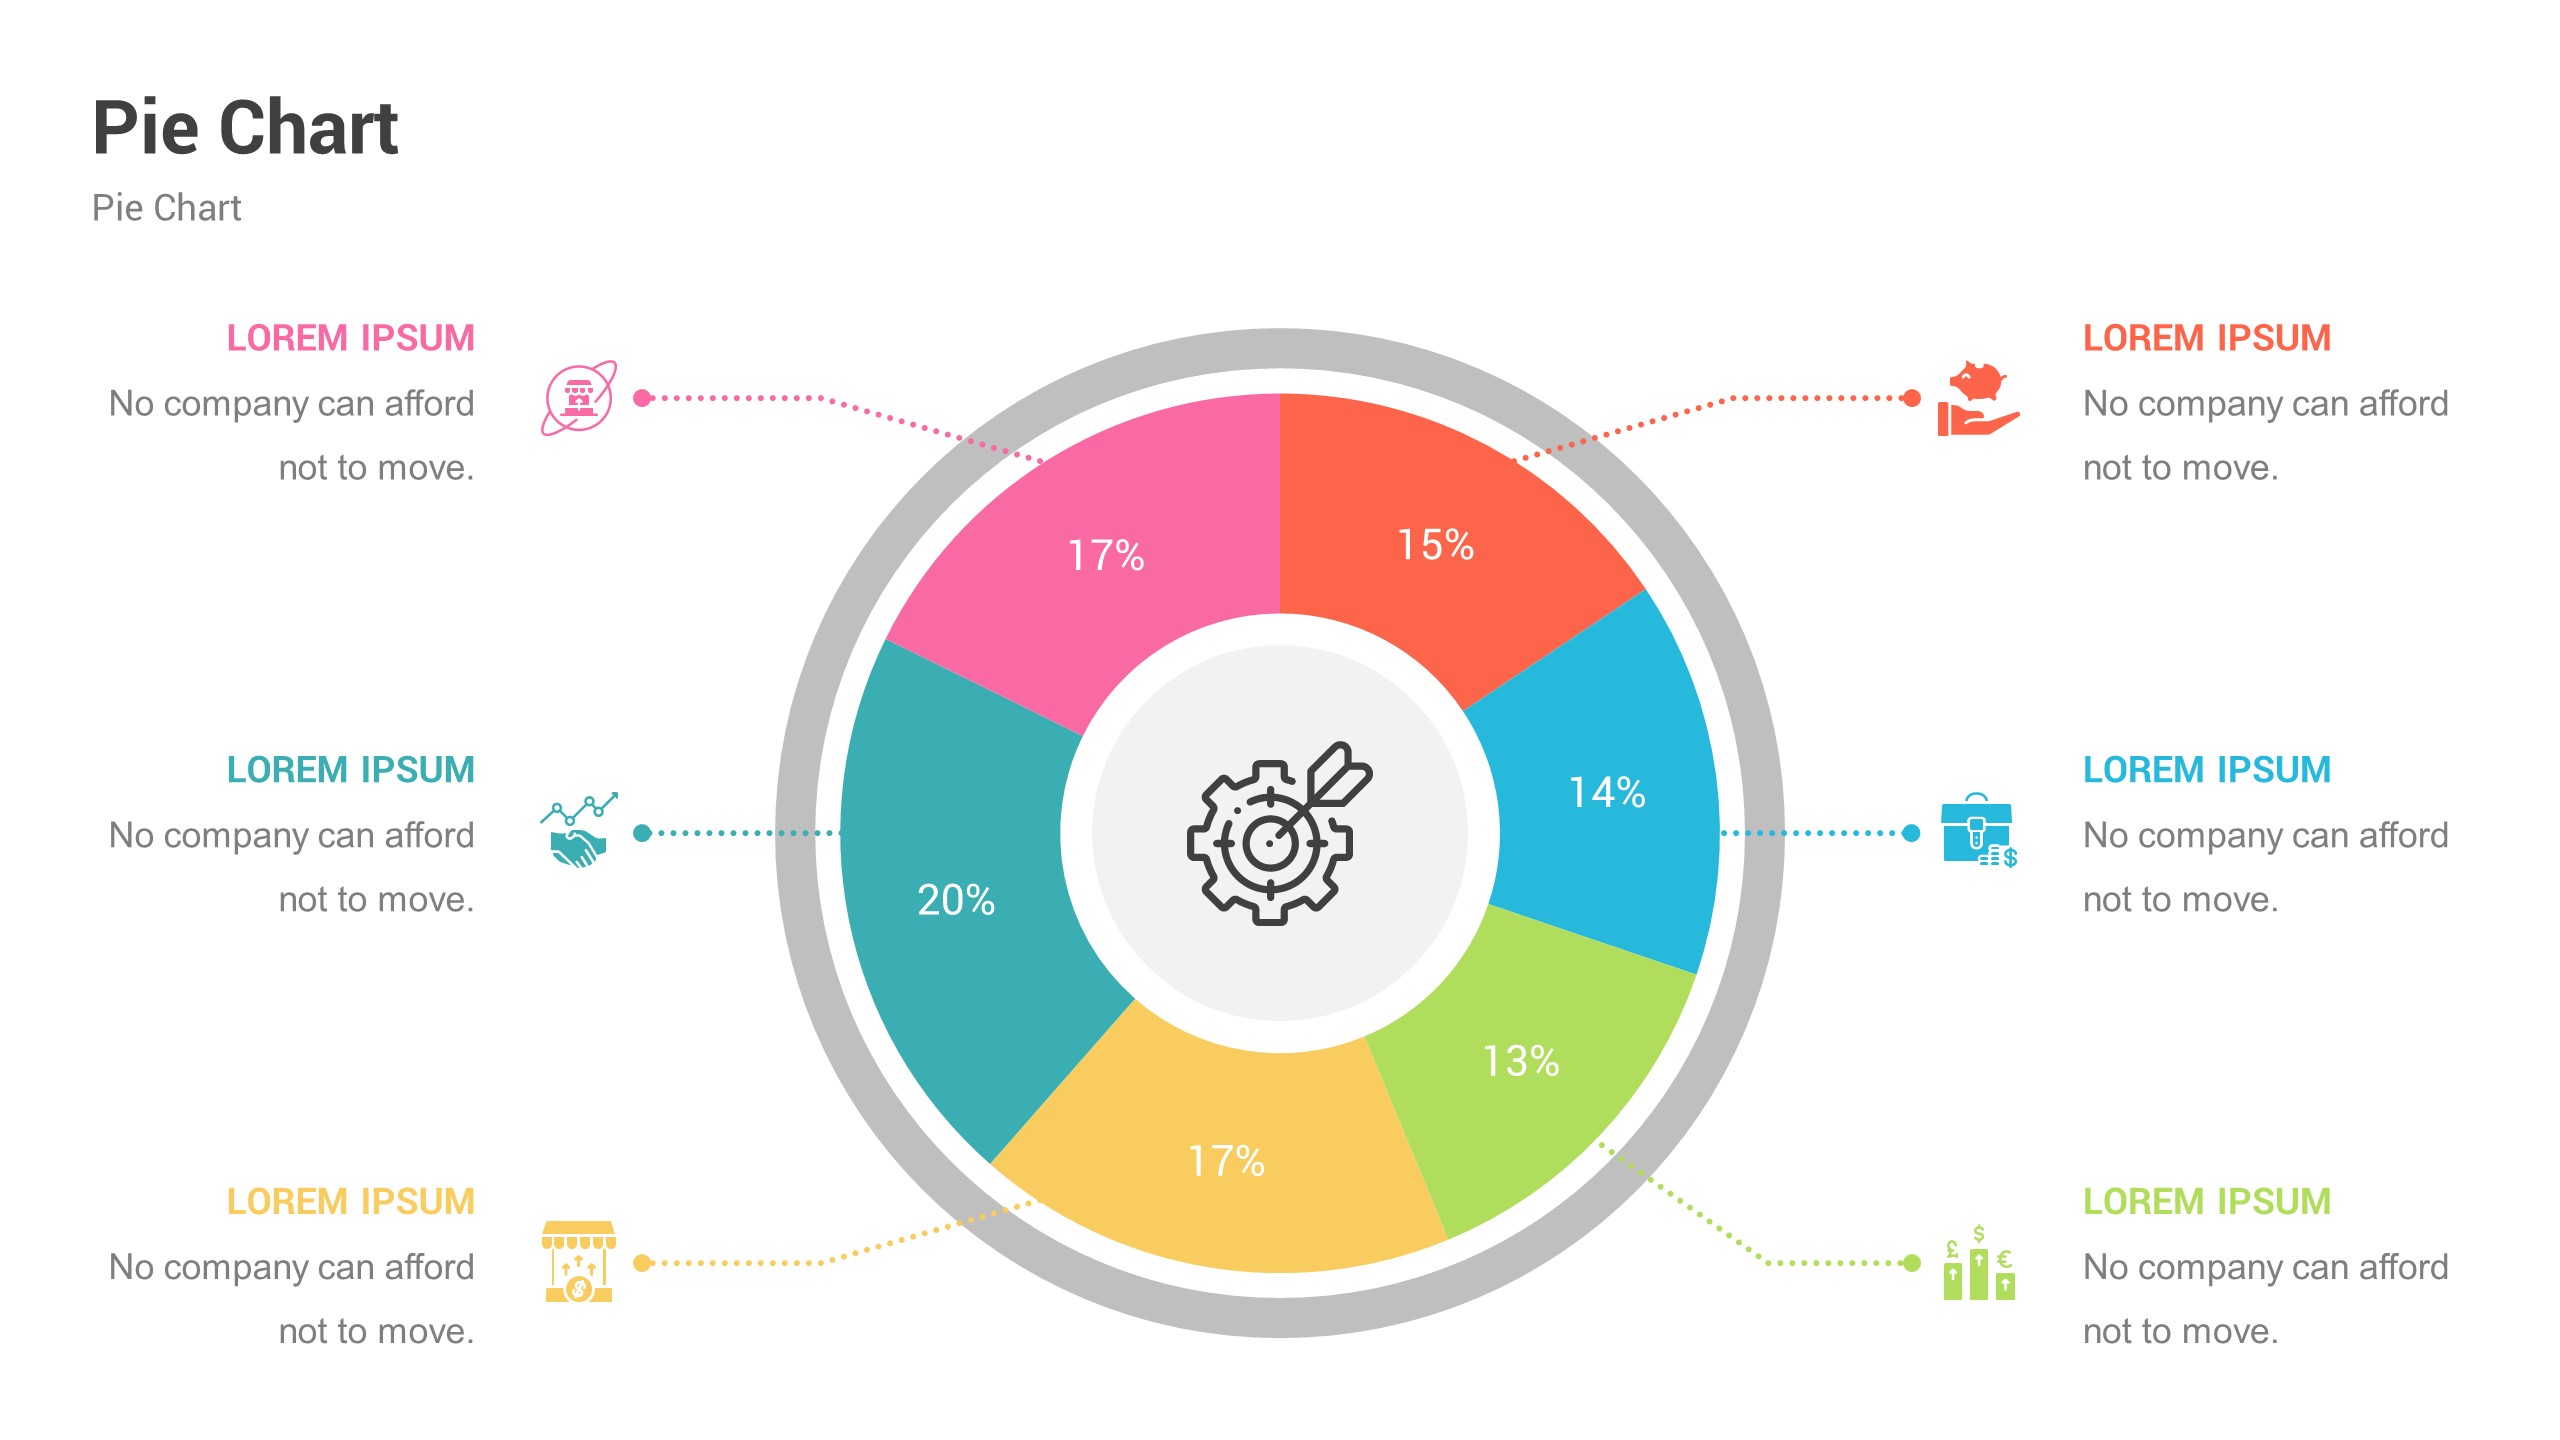
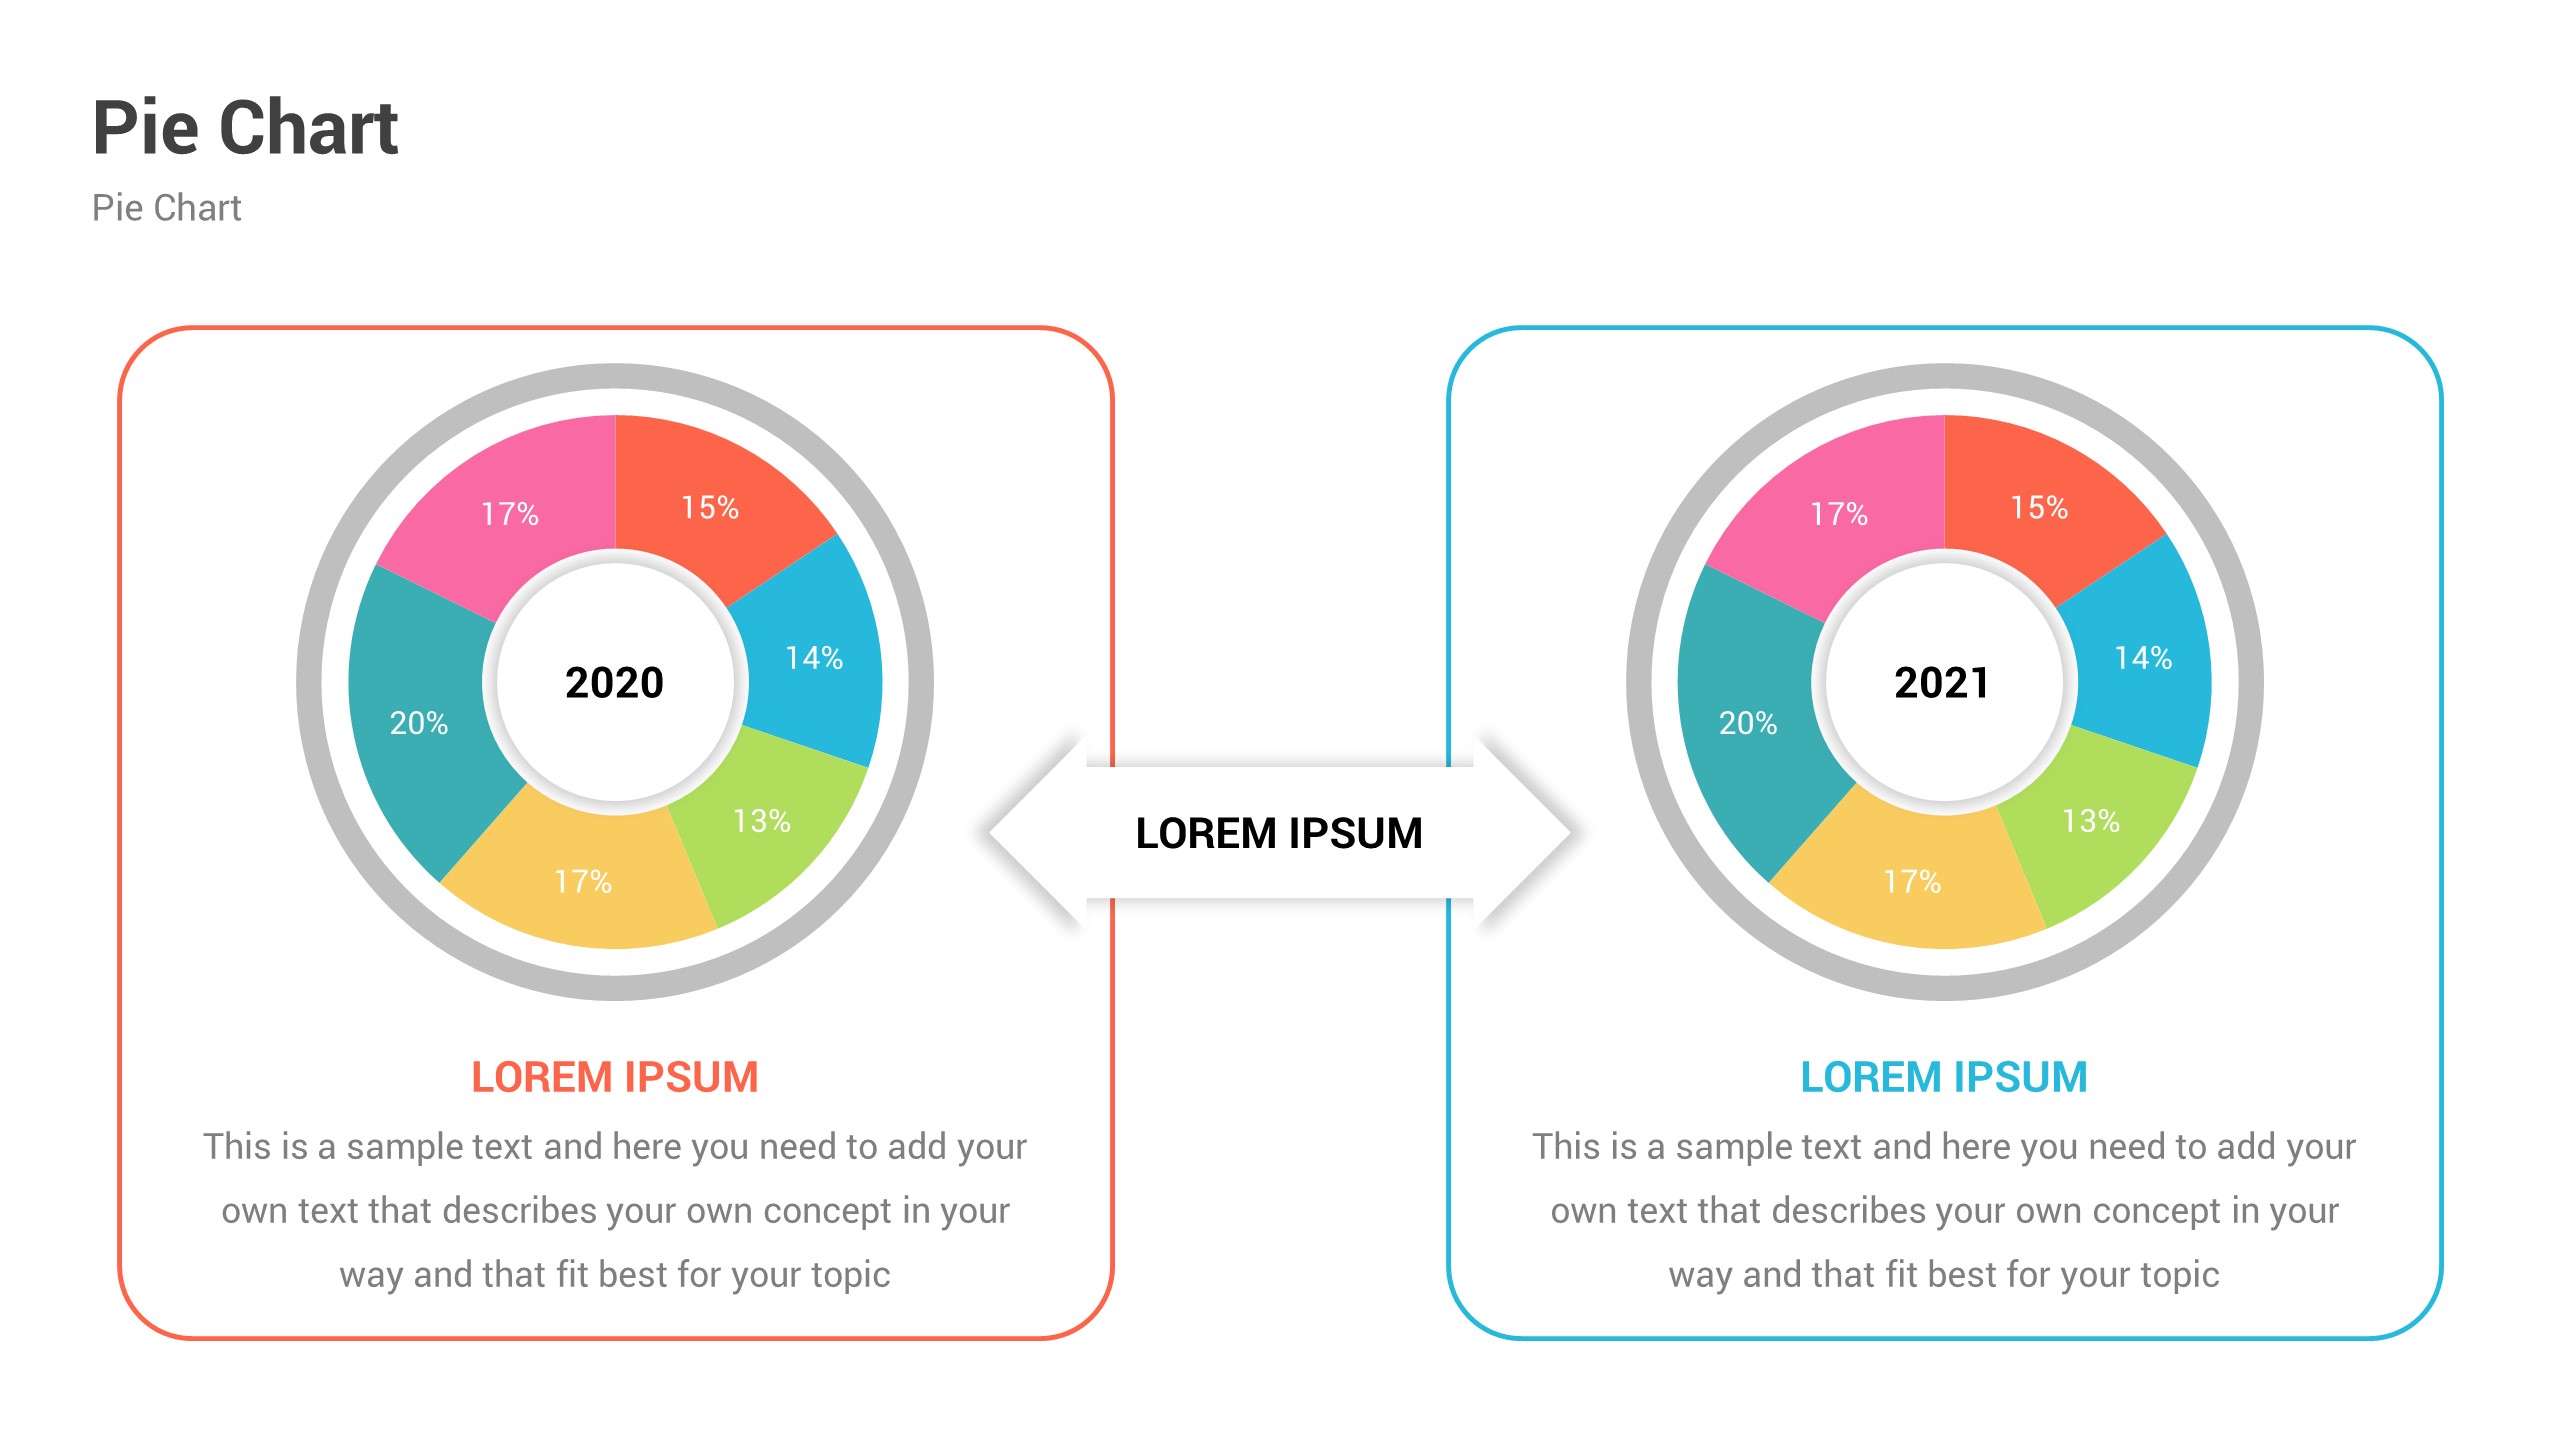
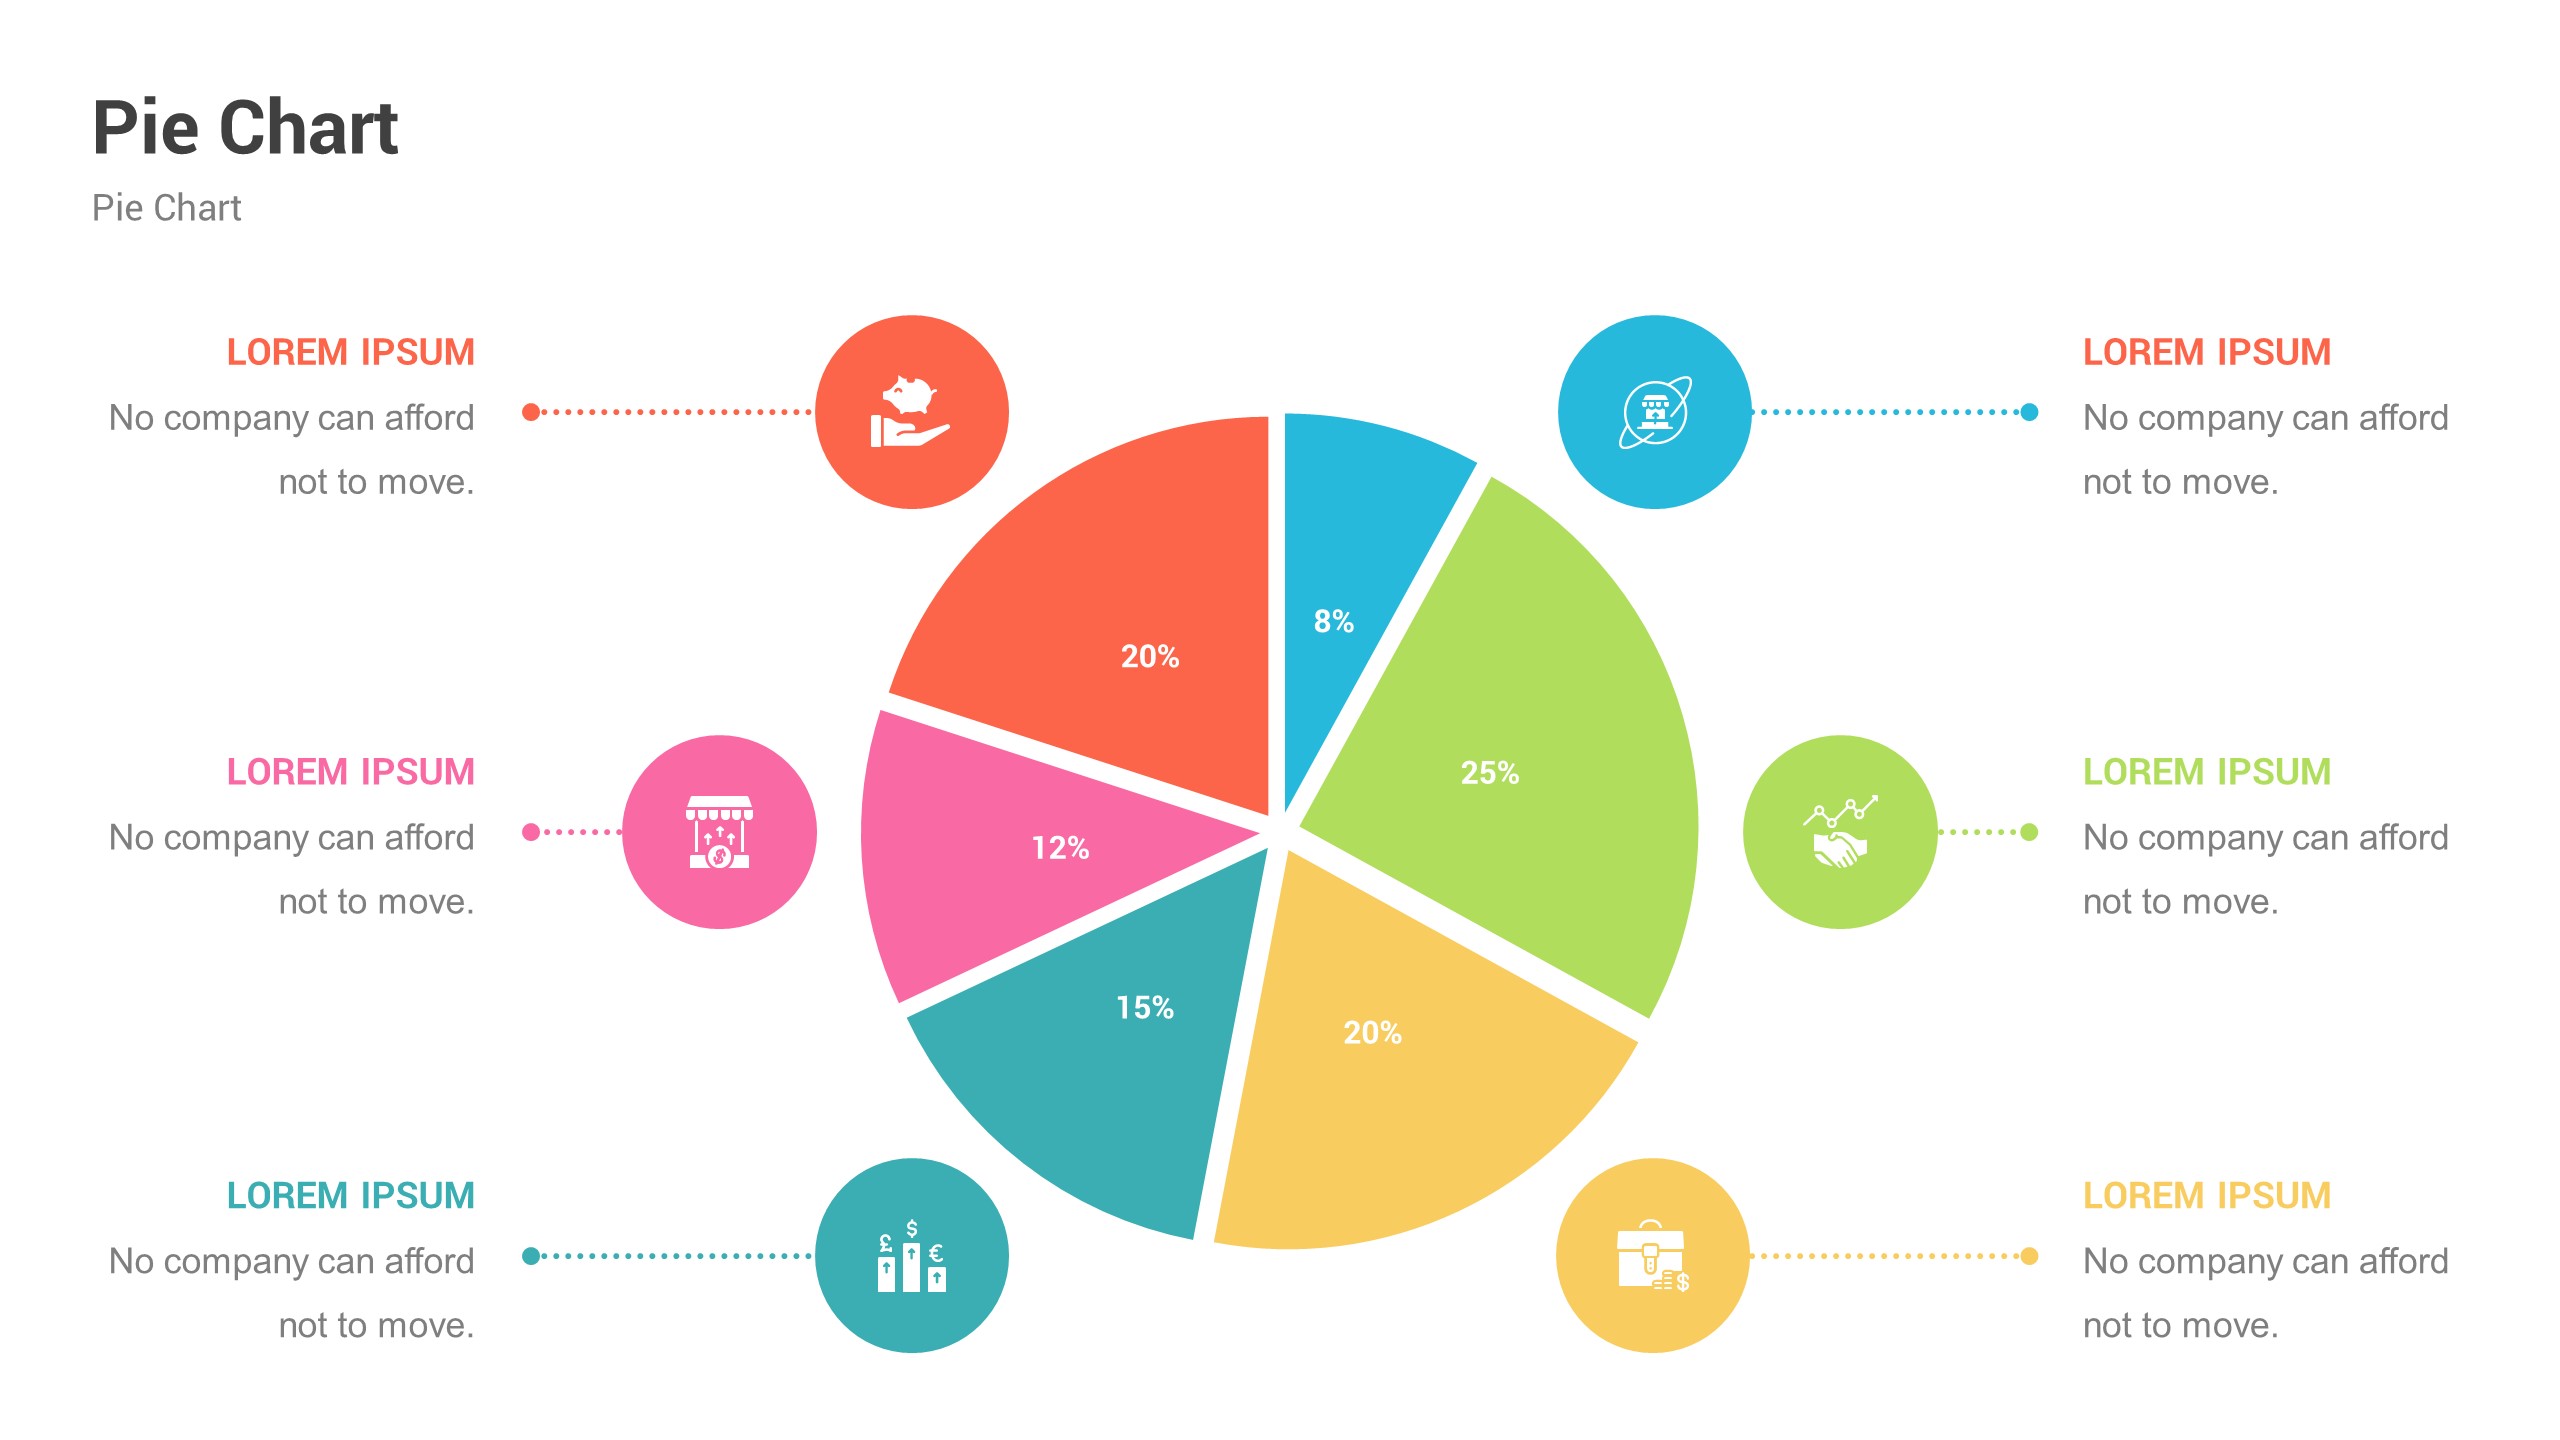
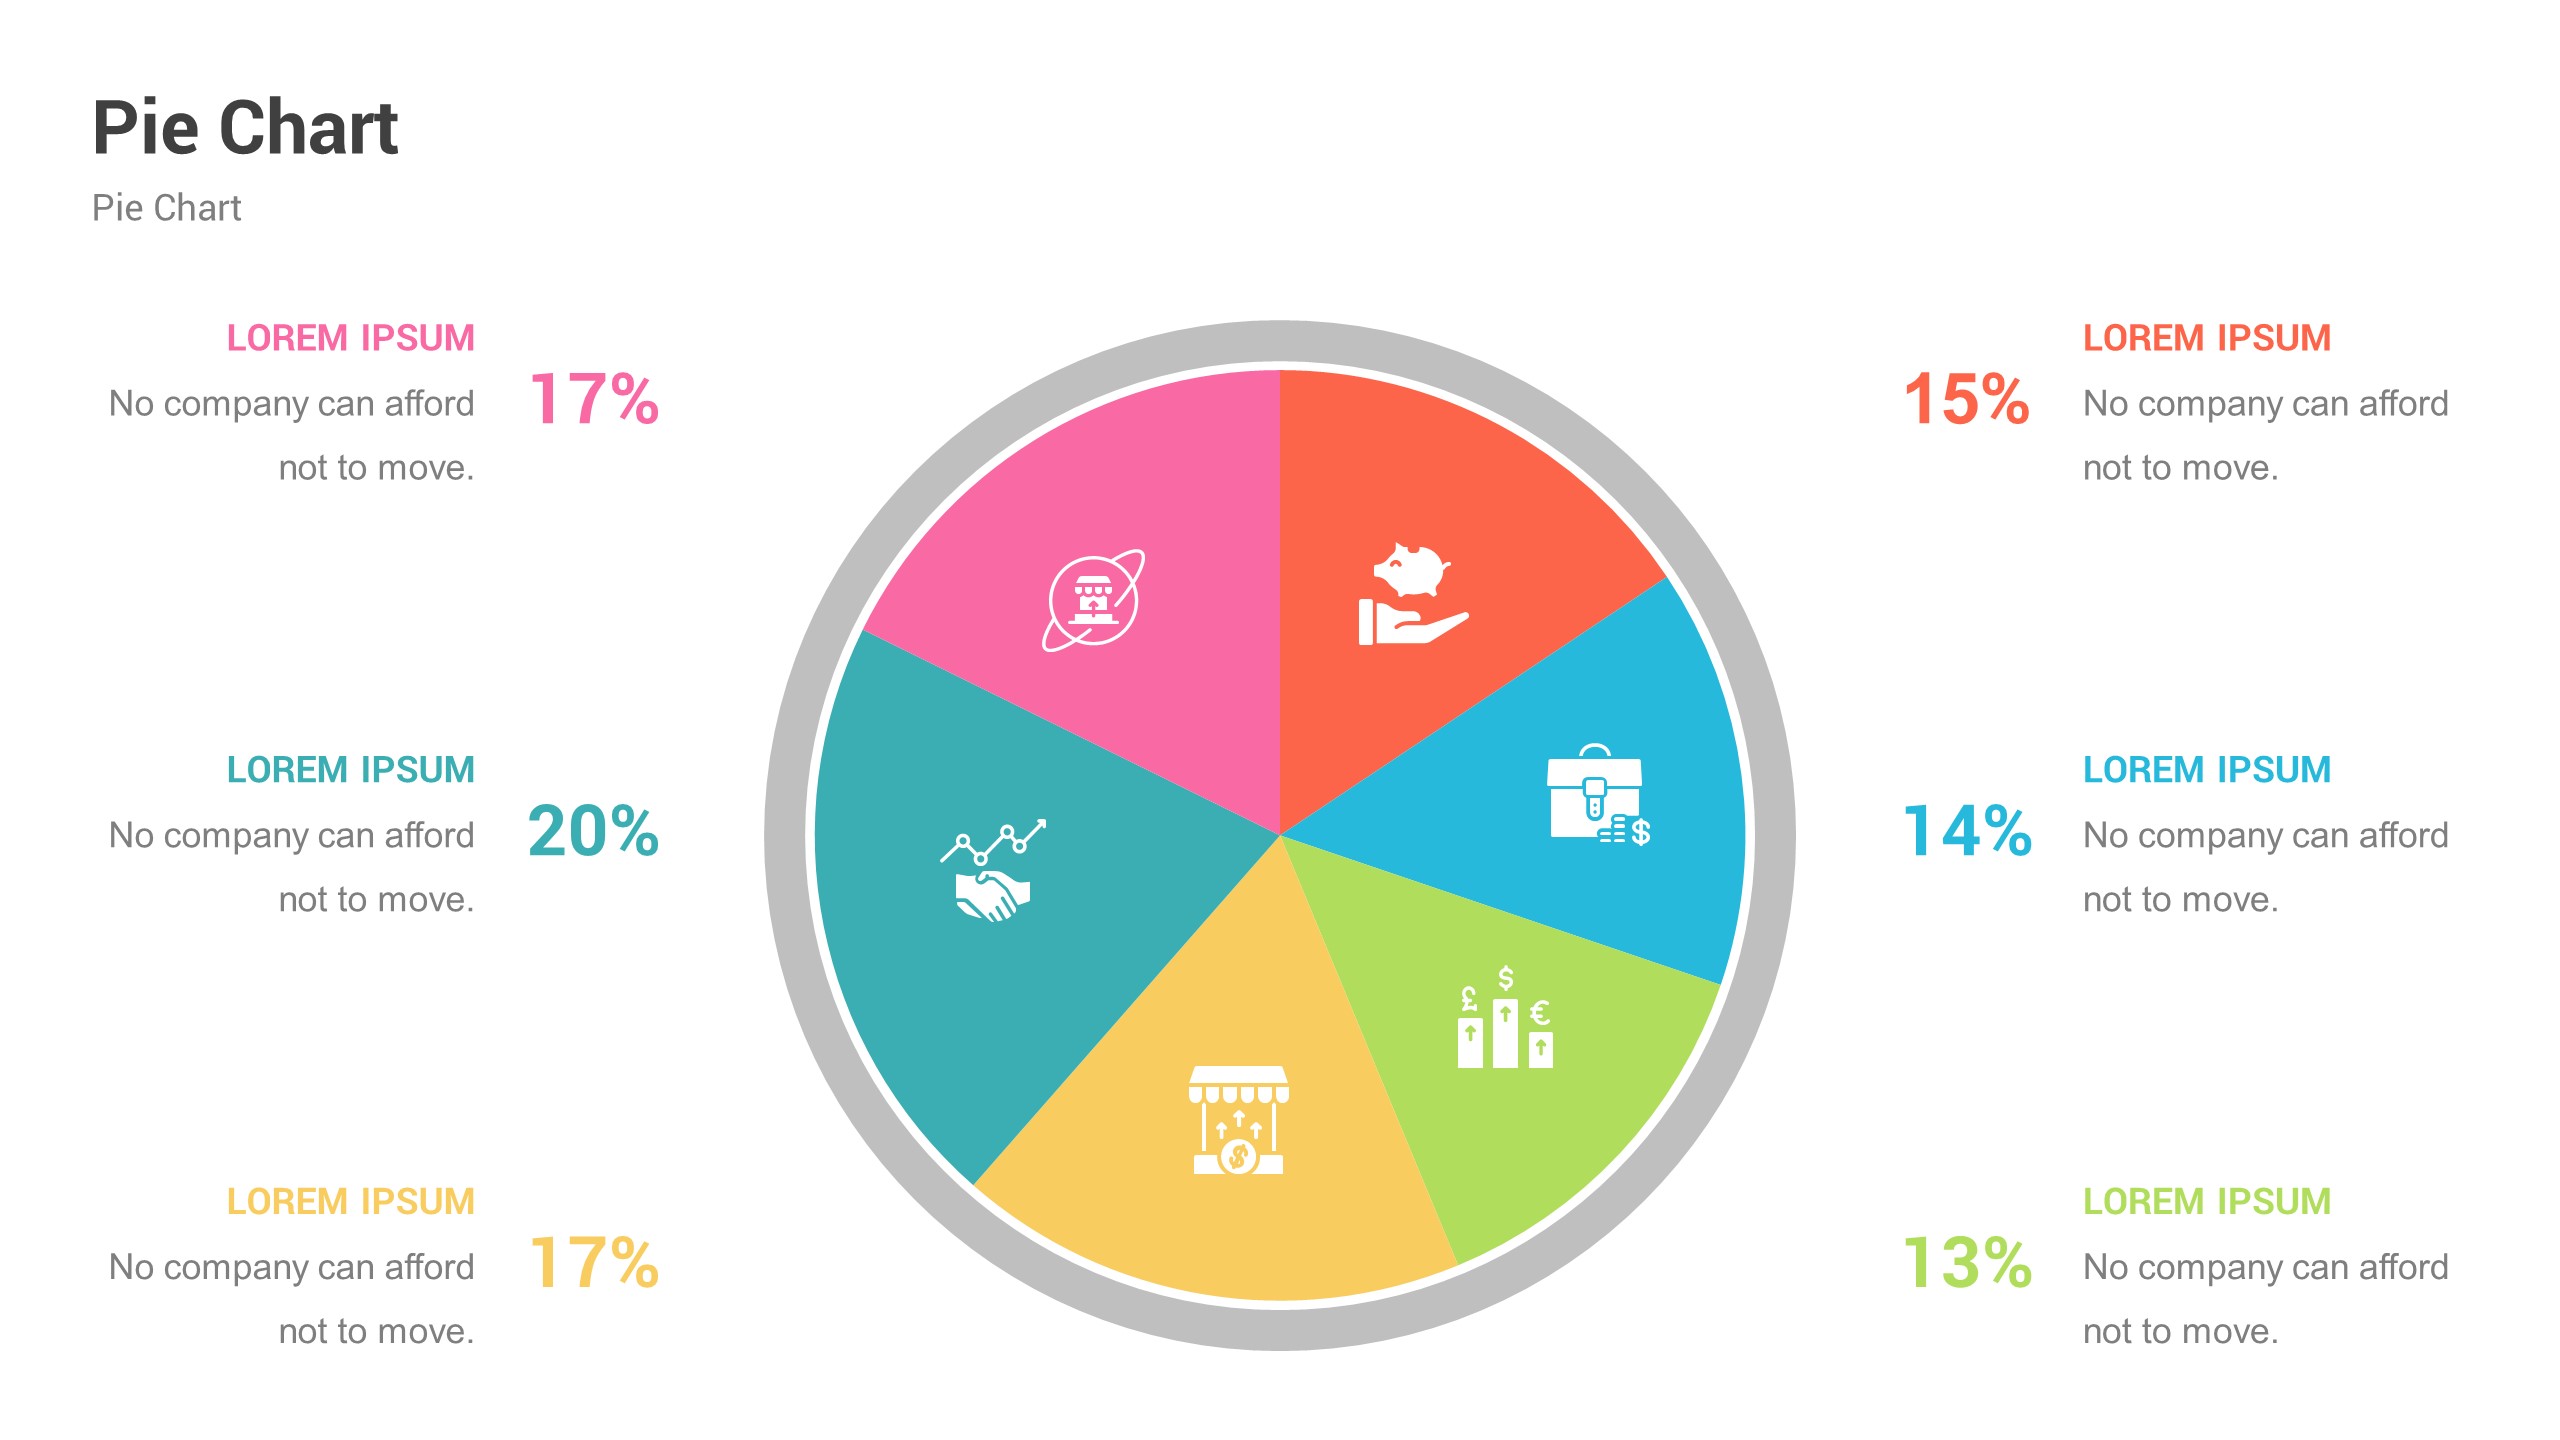
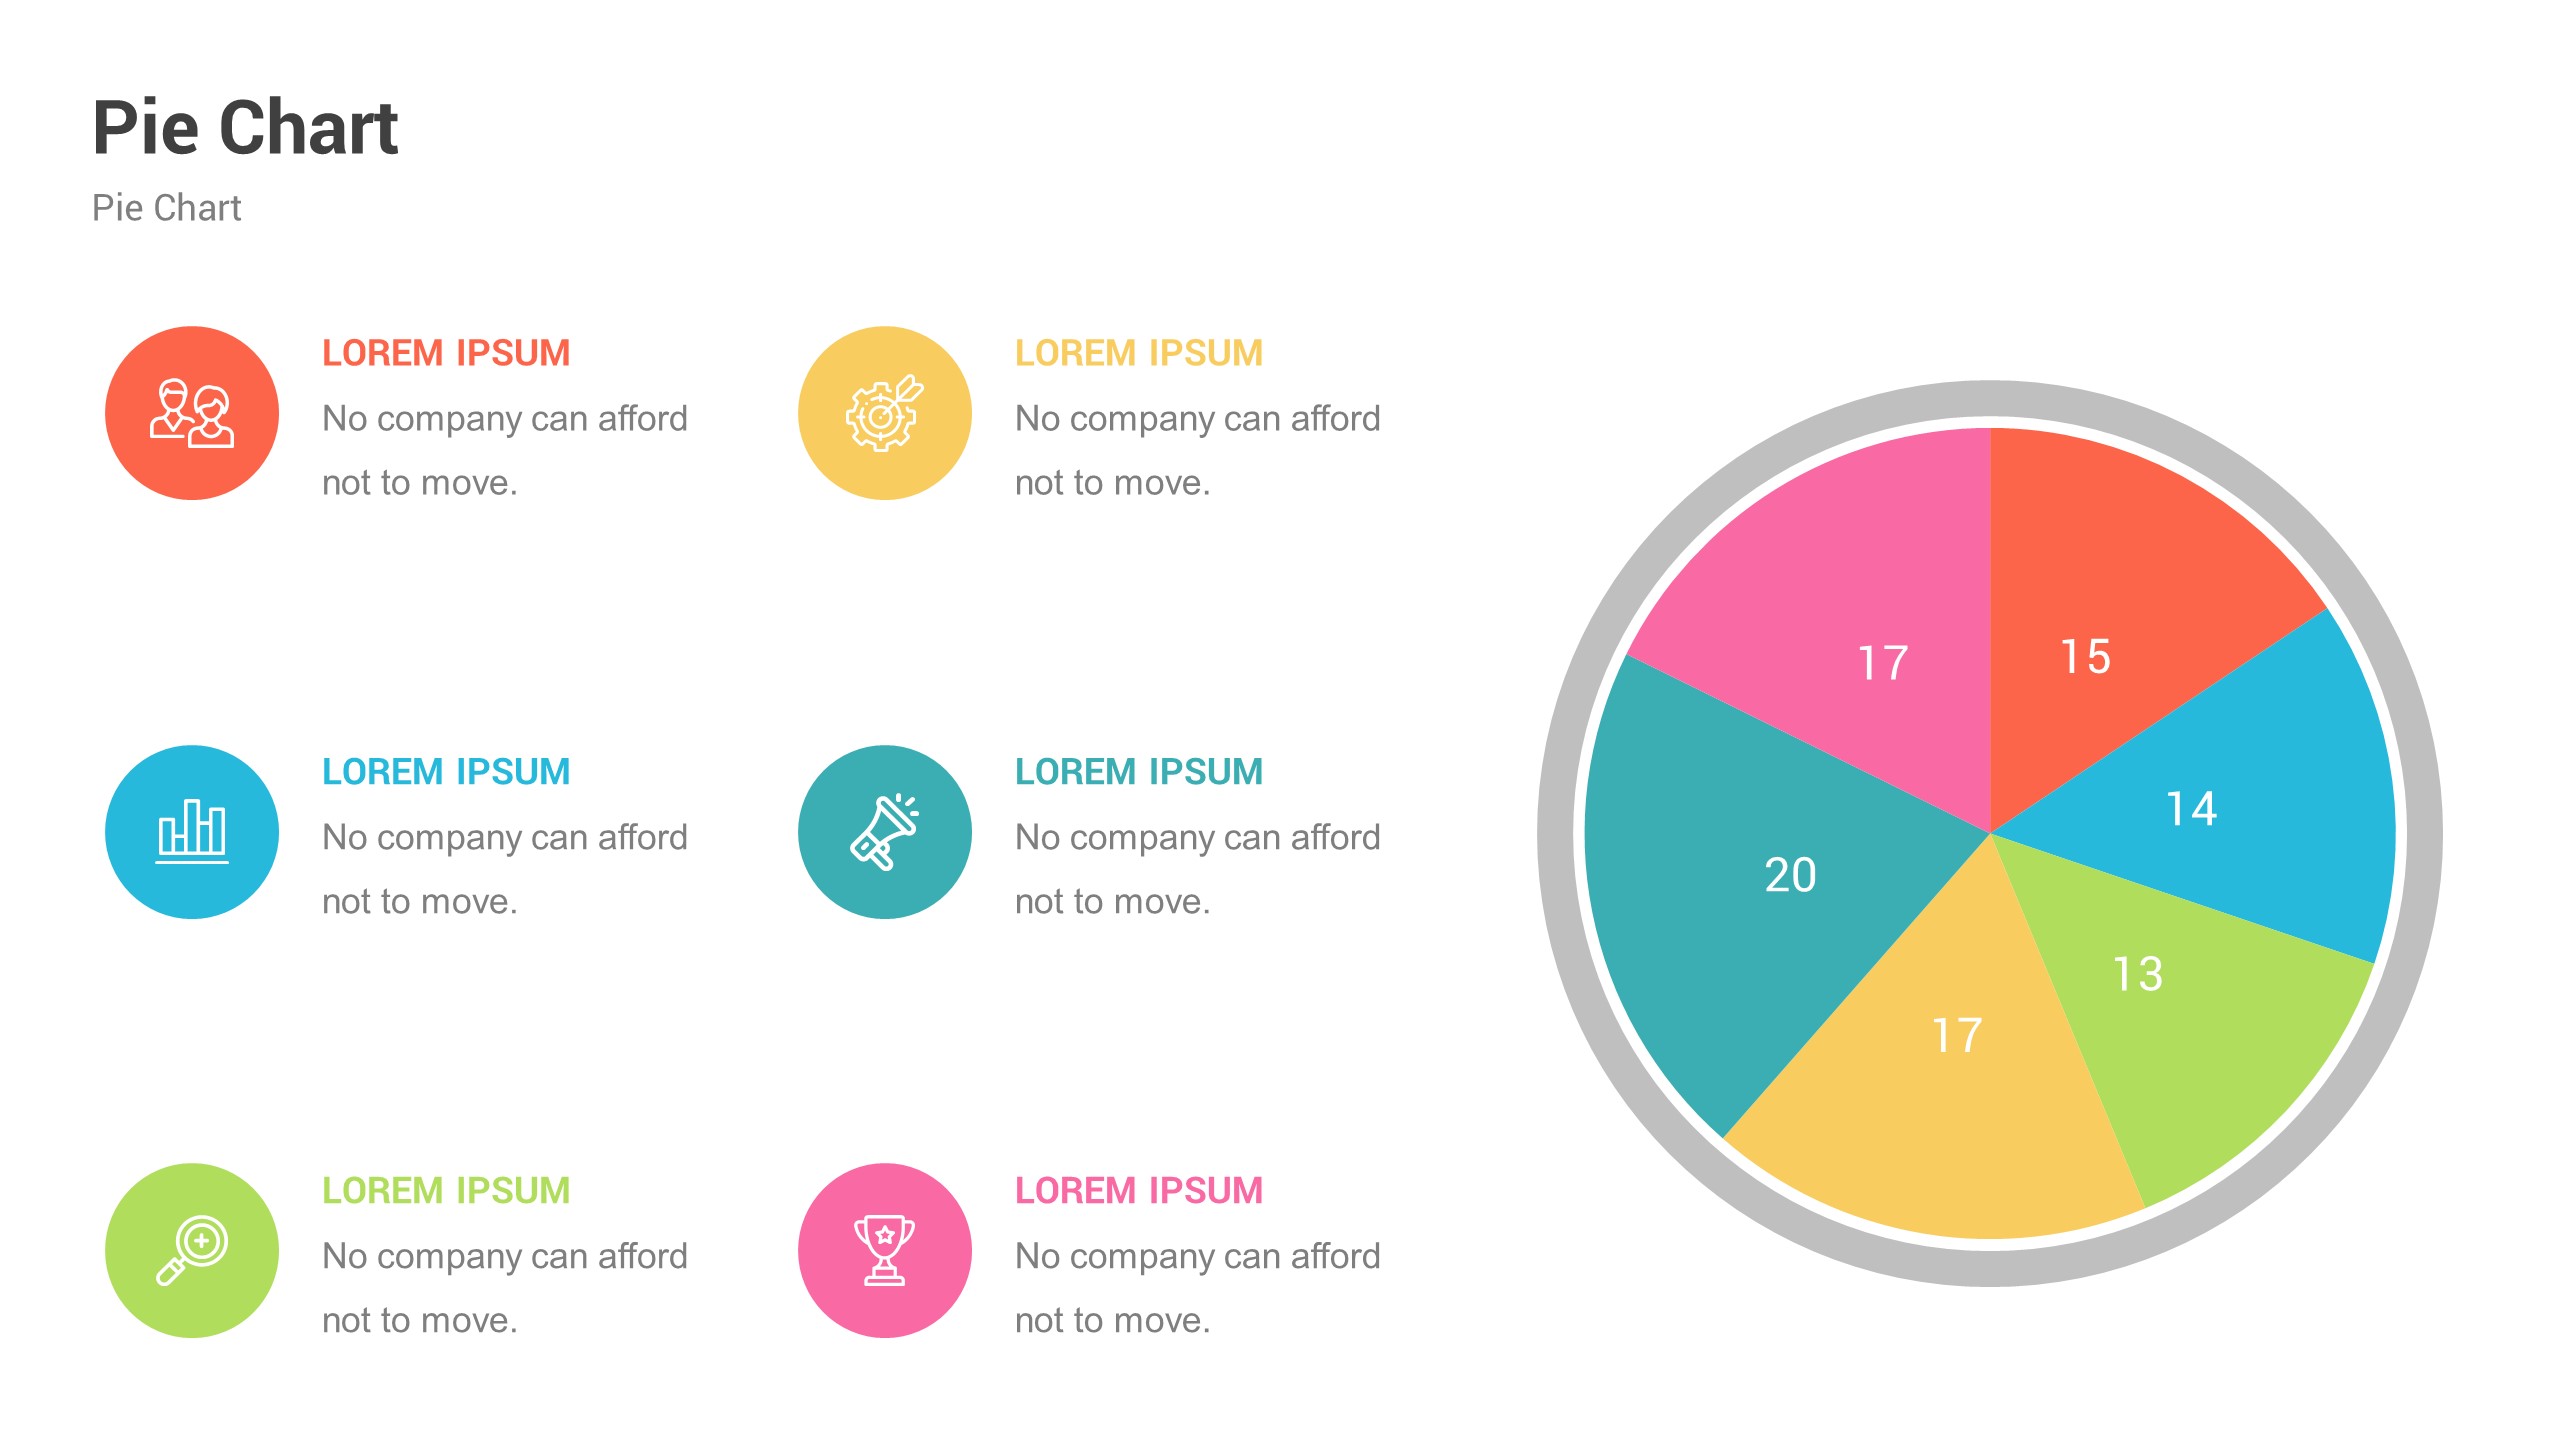
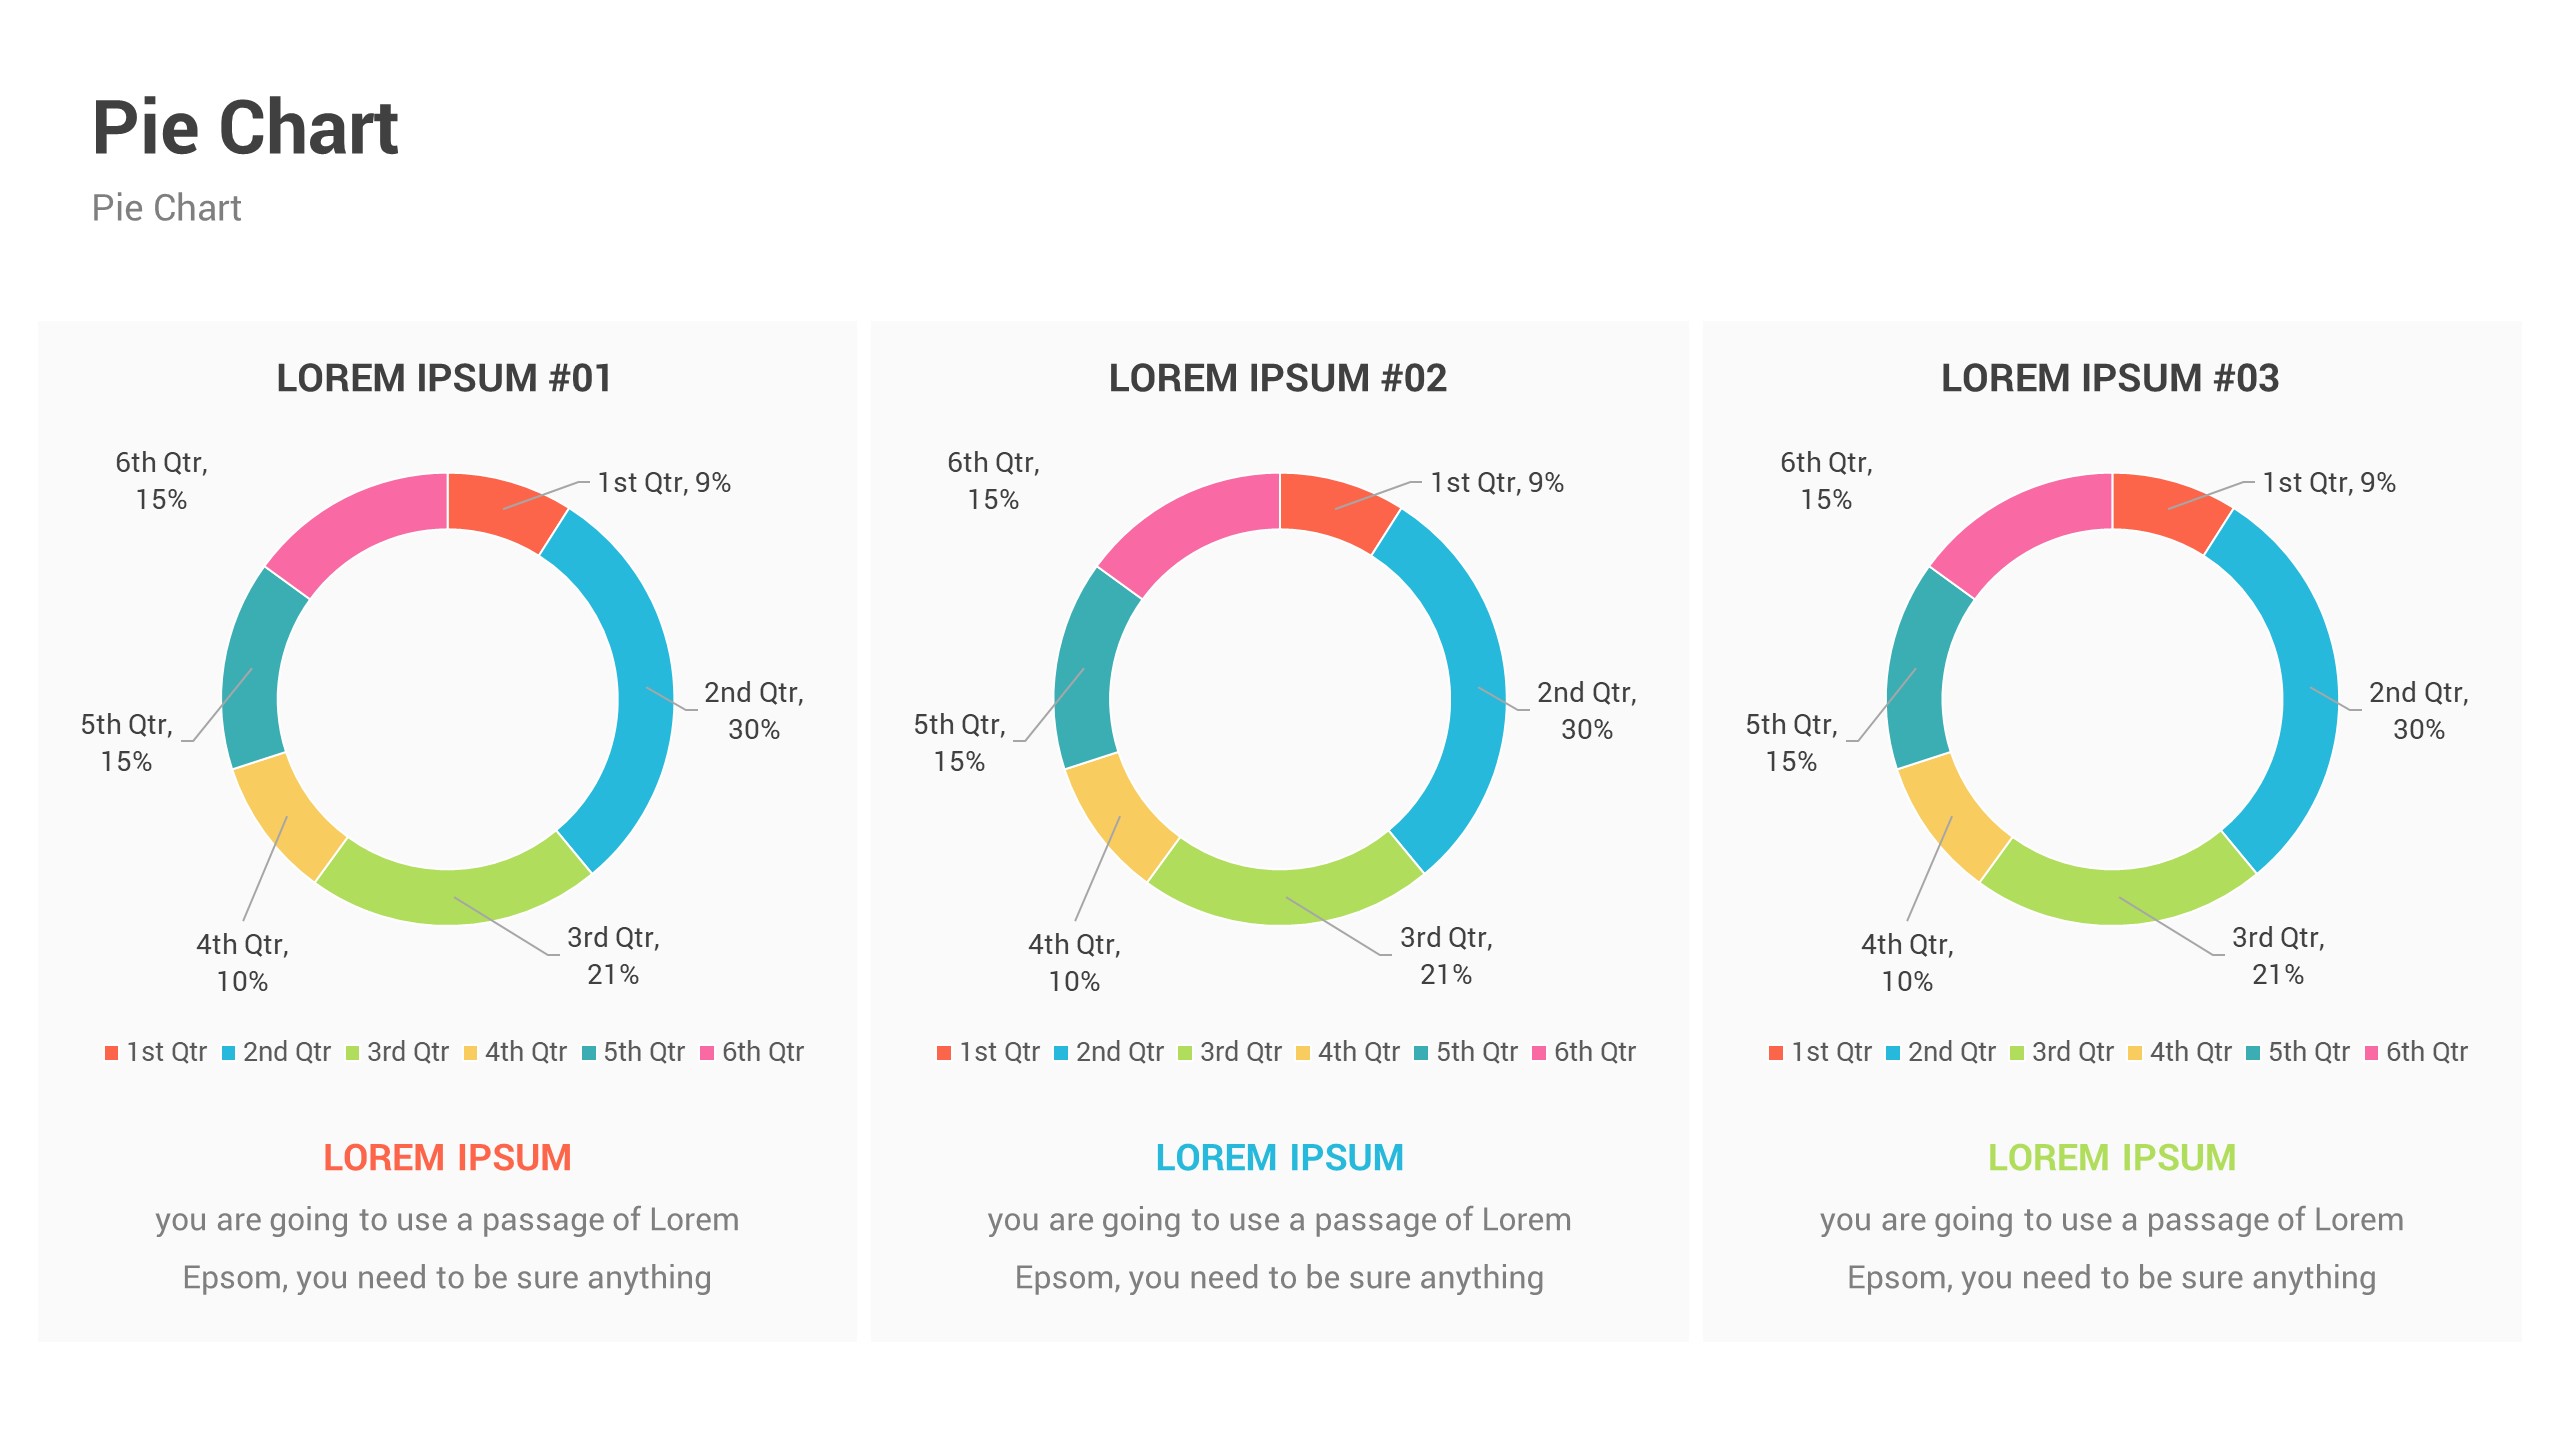
- Pie Charts
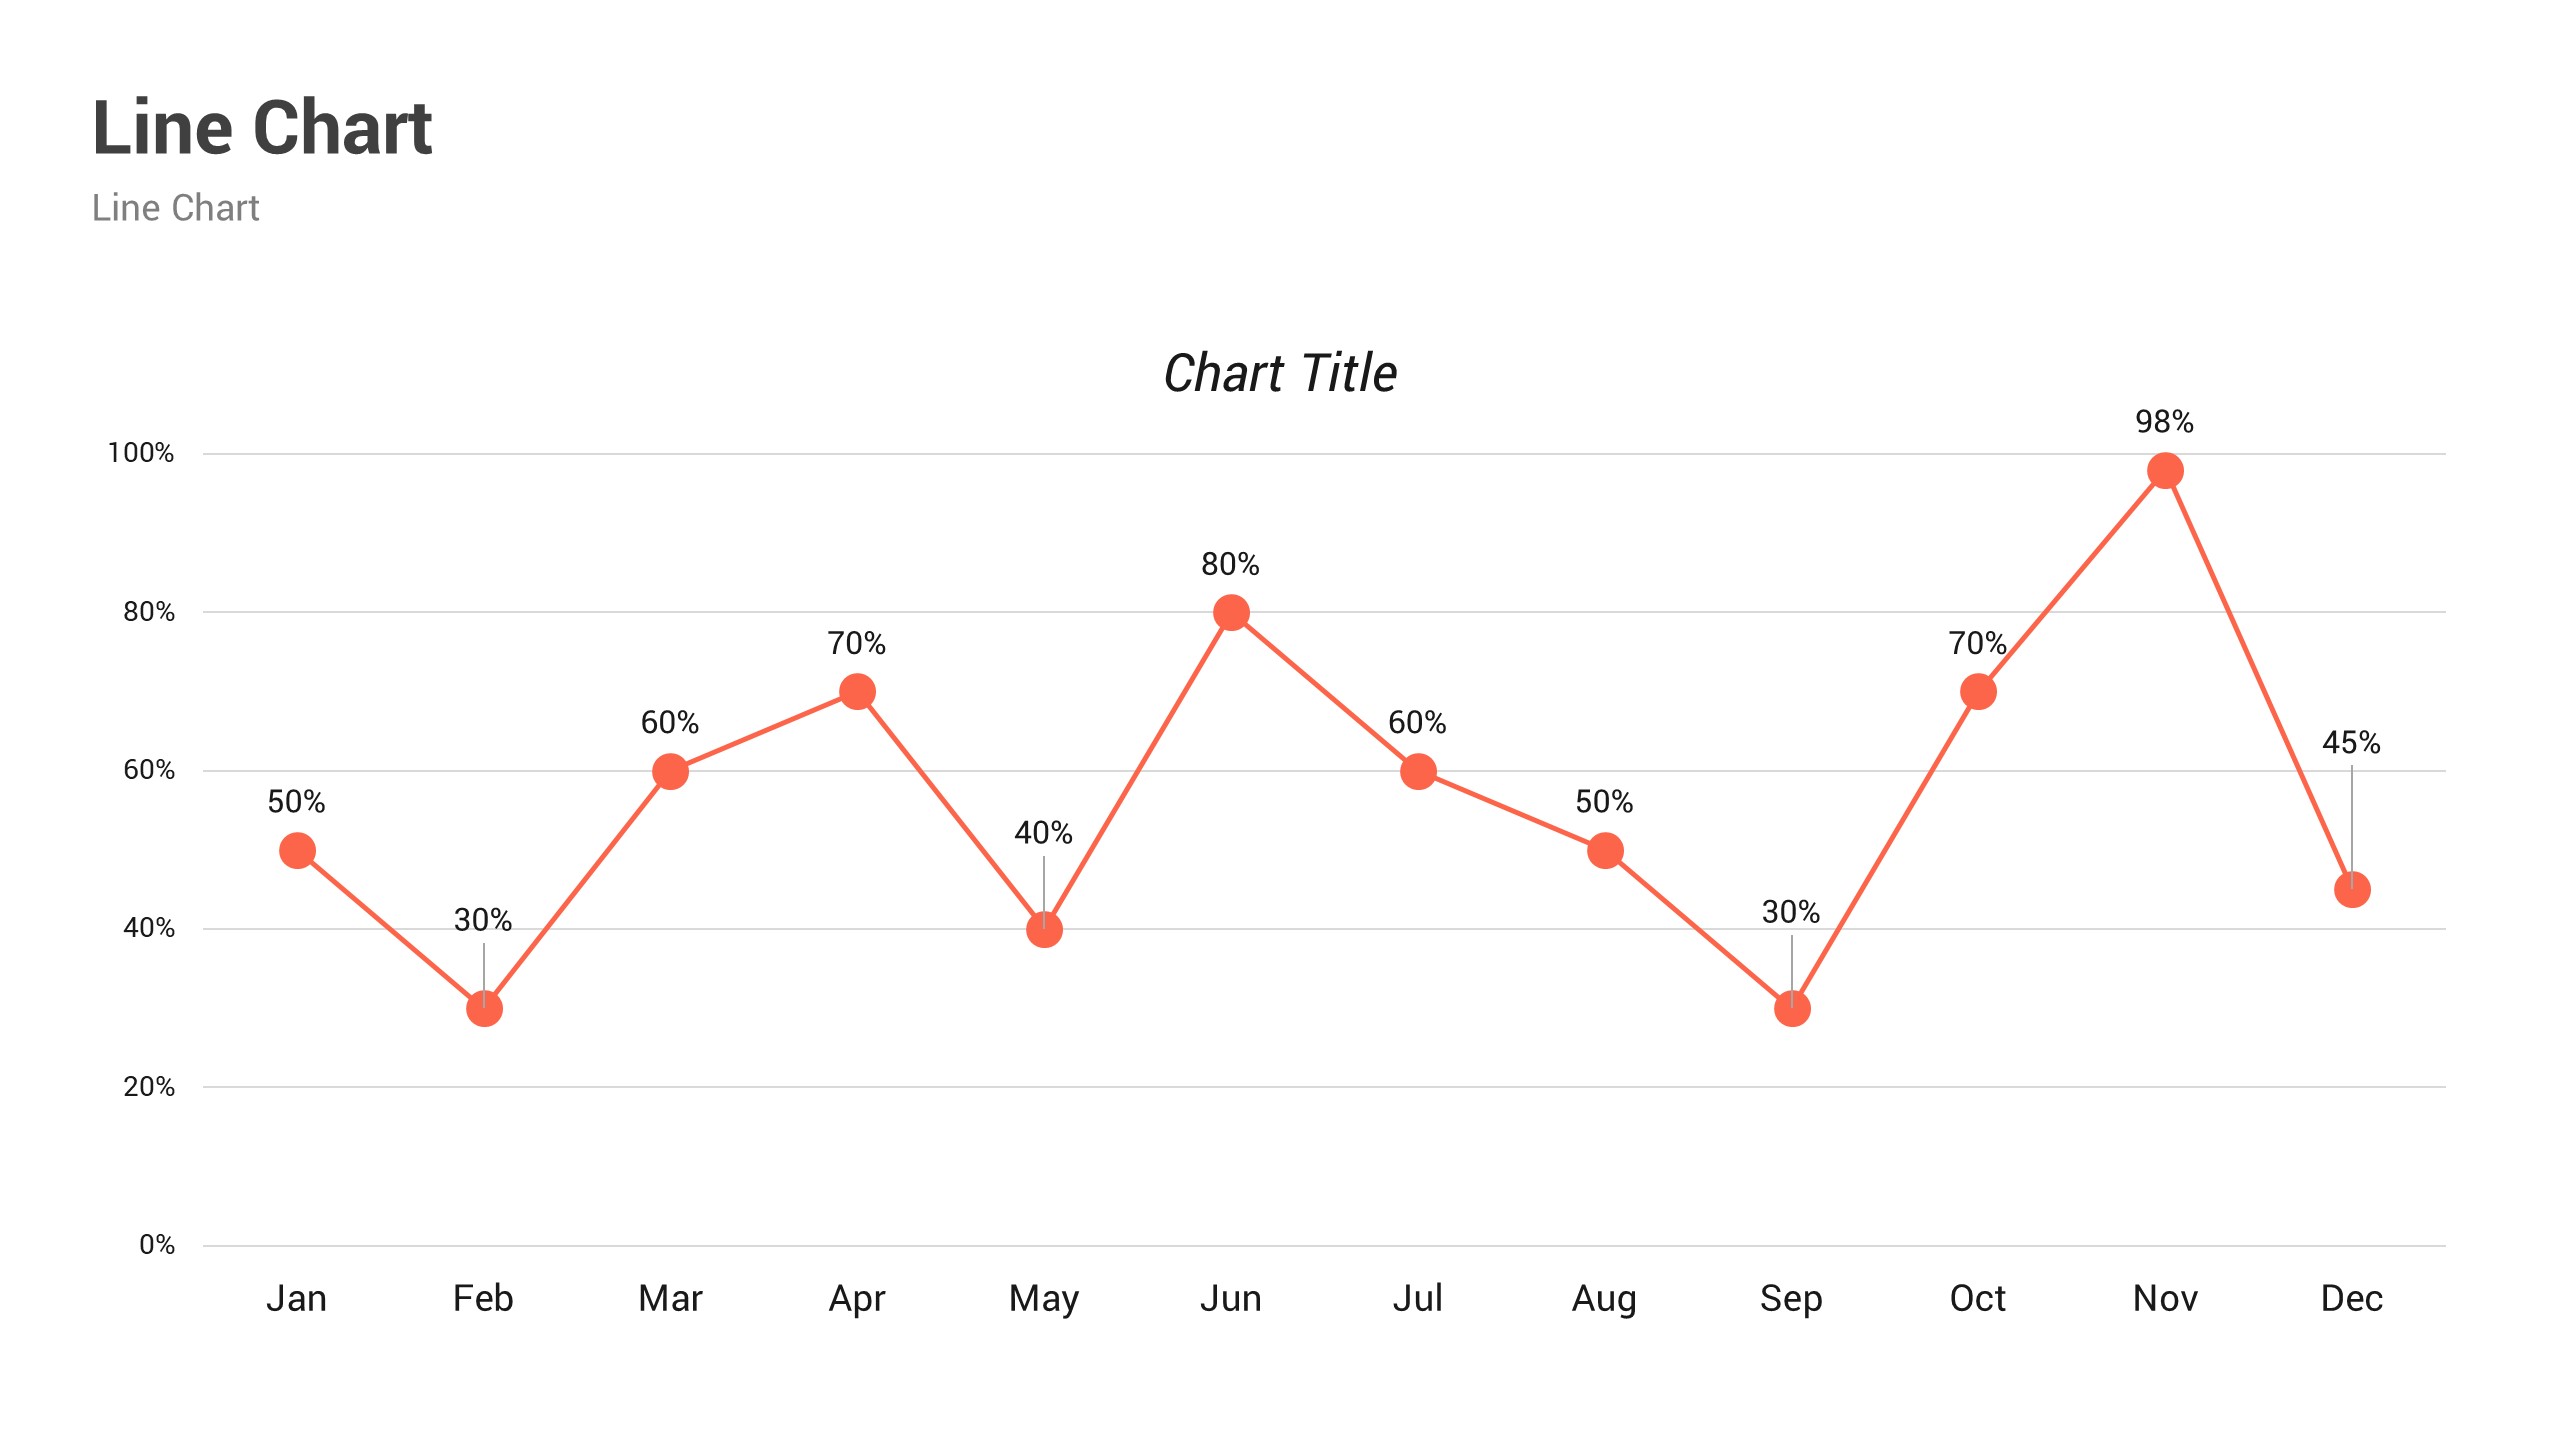
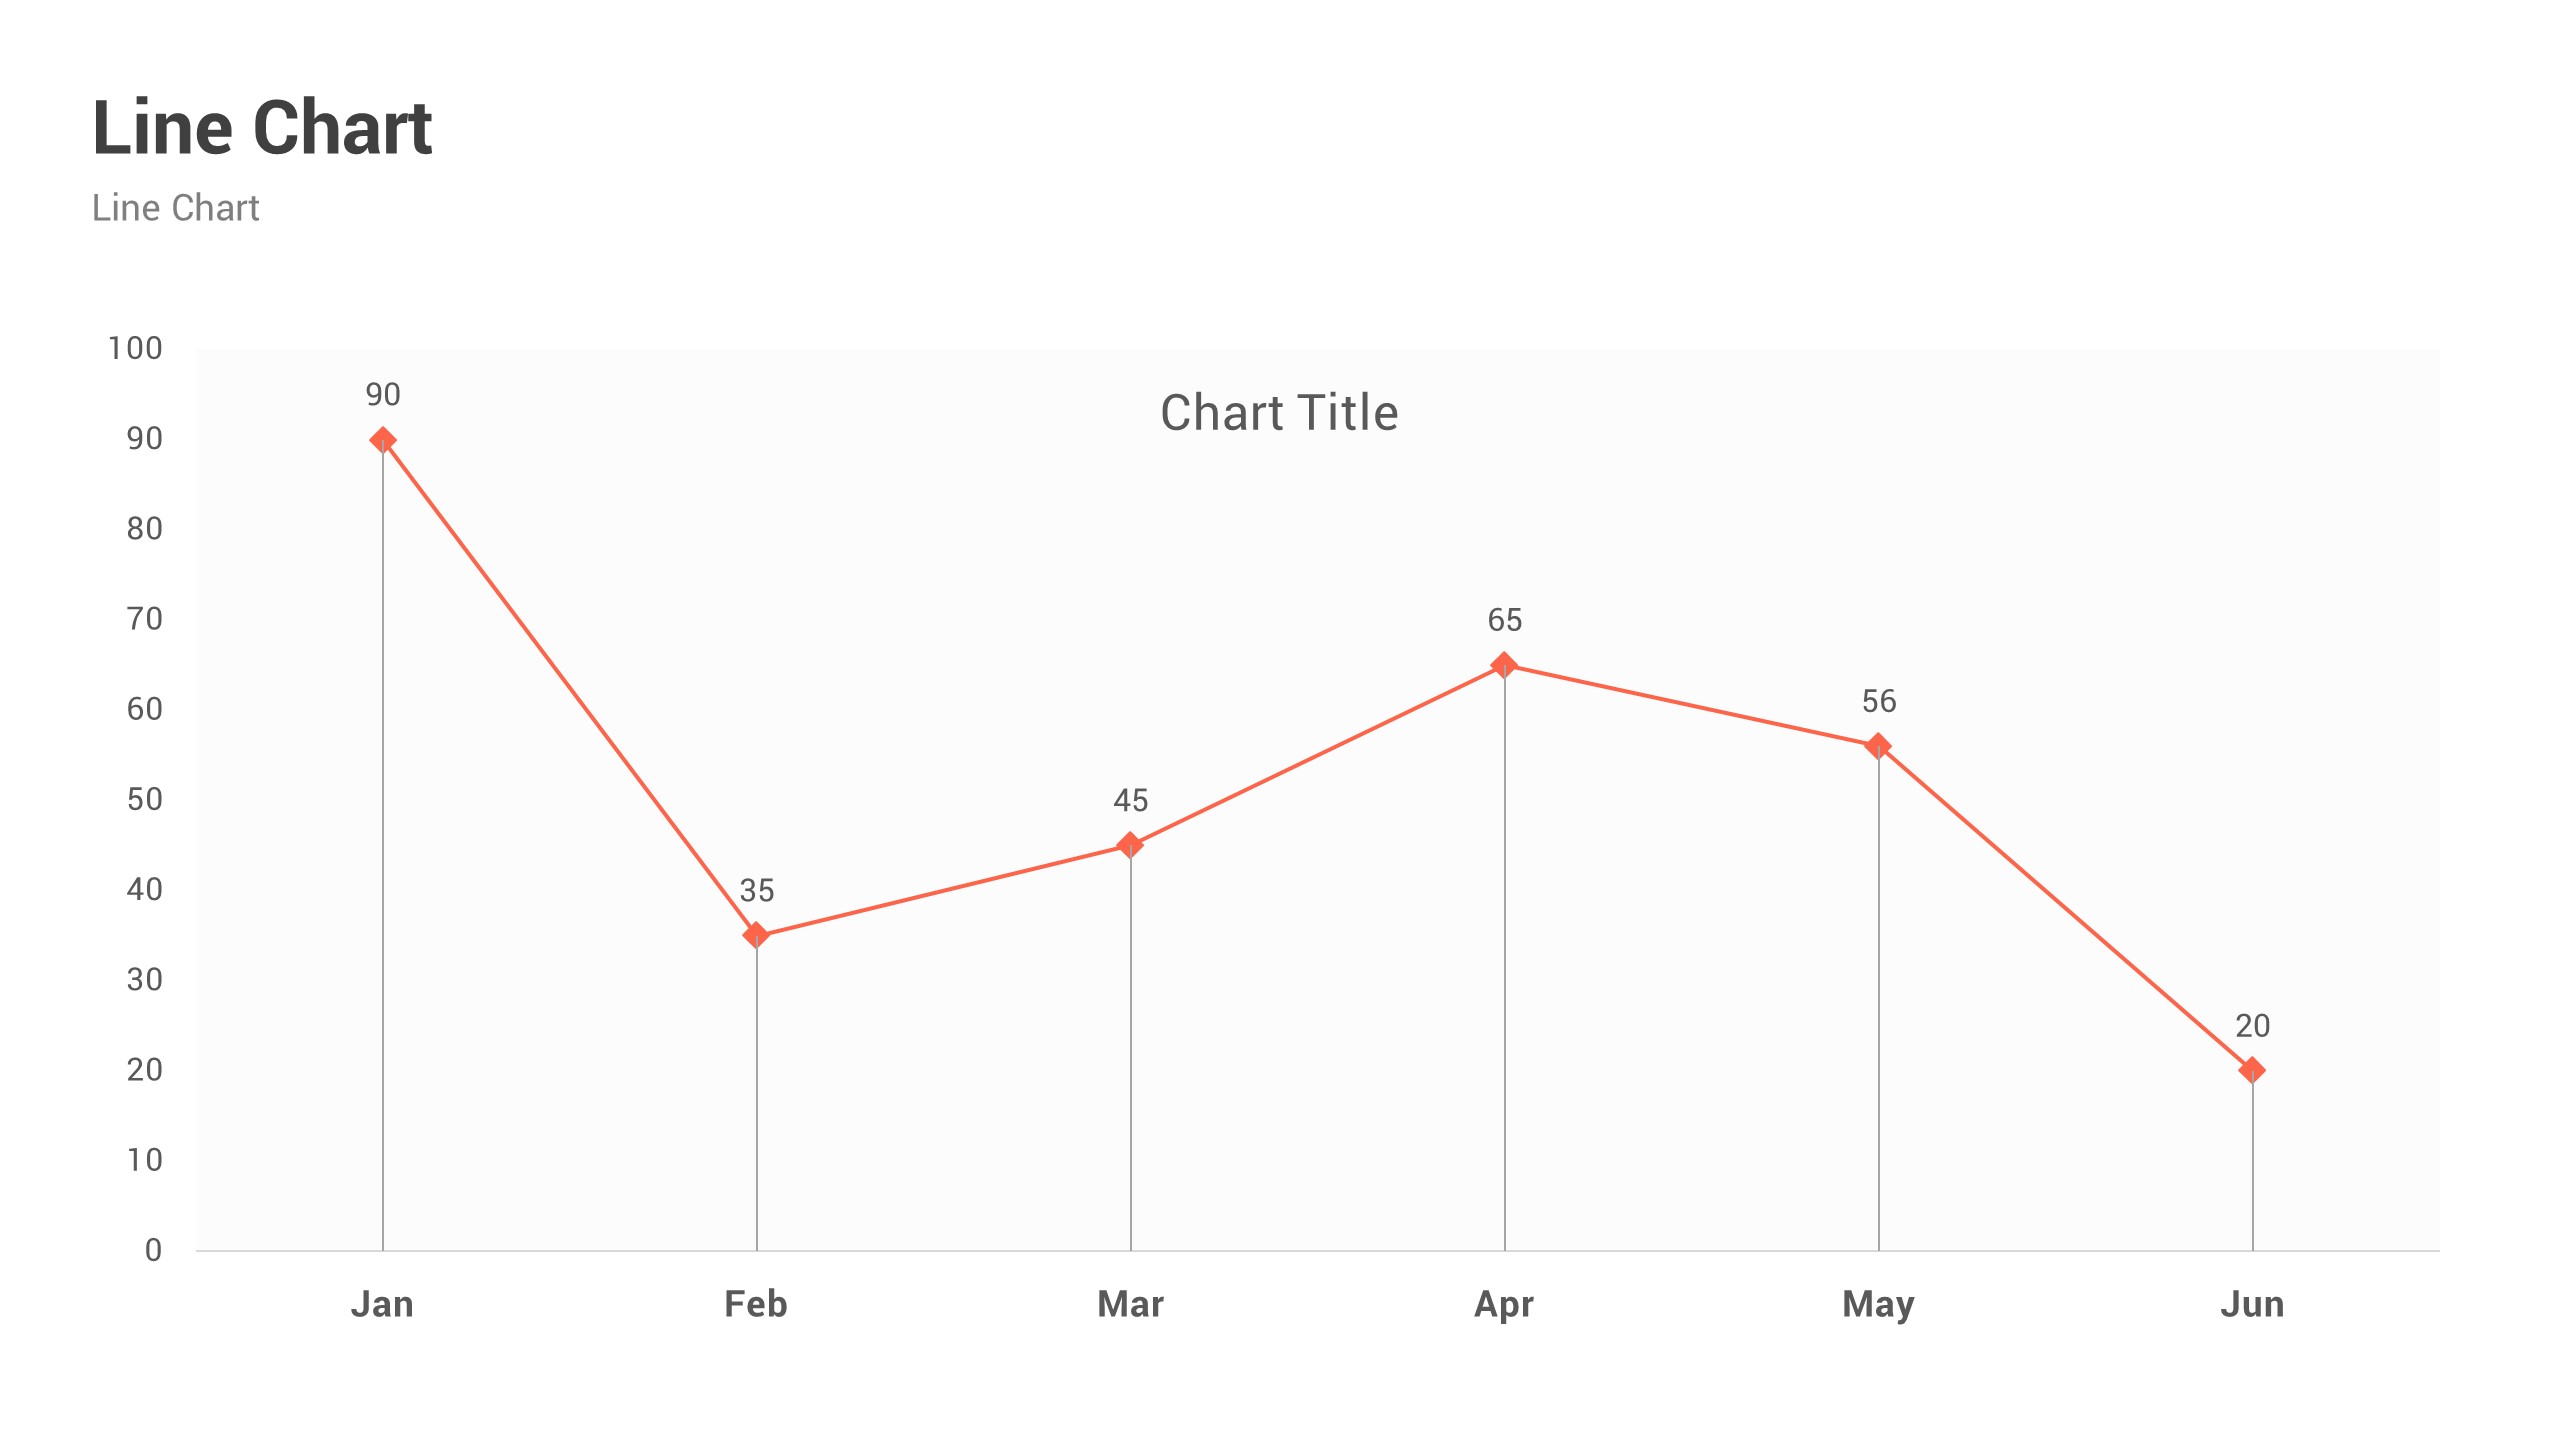
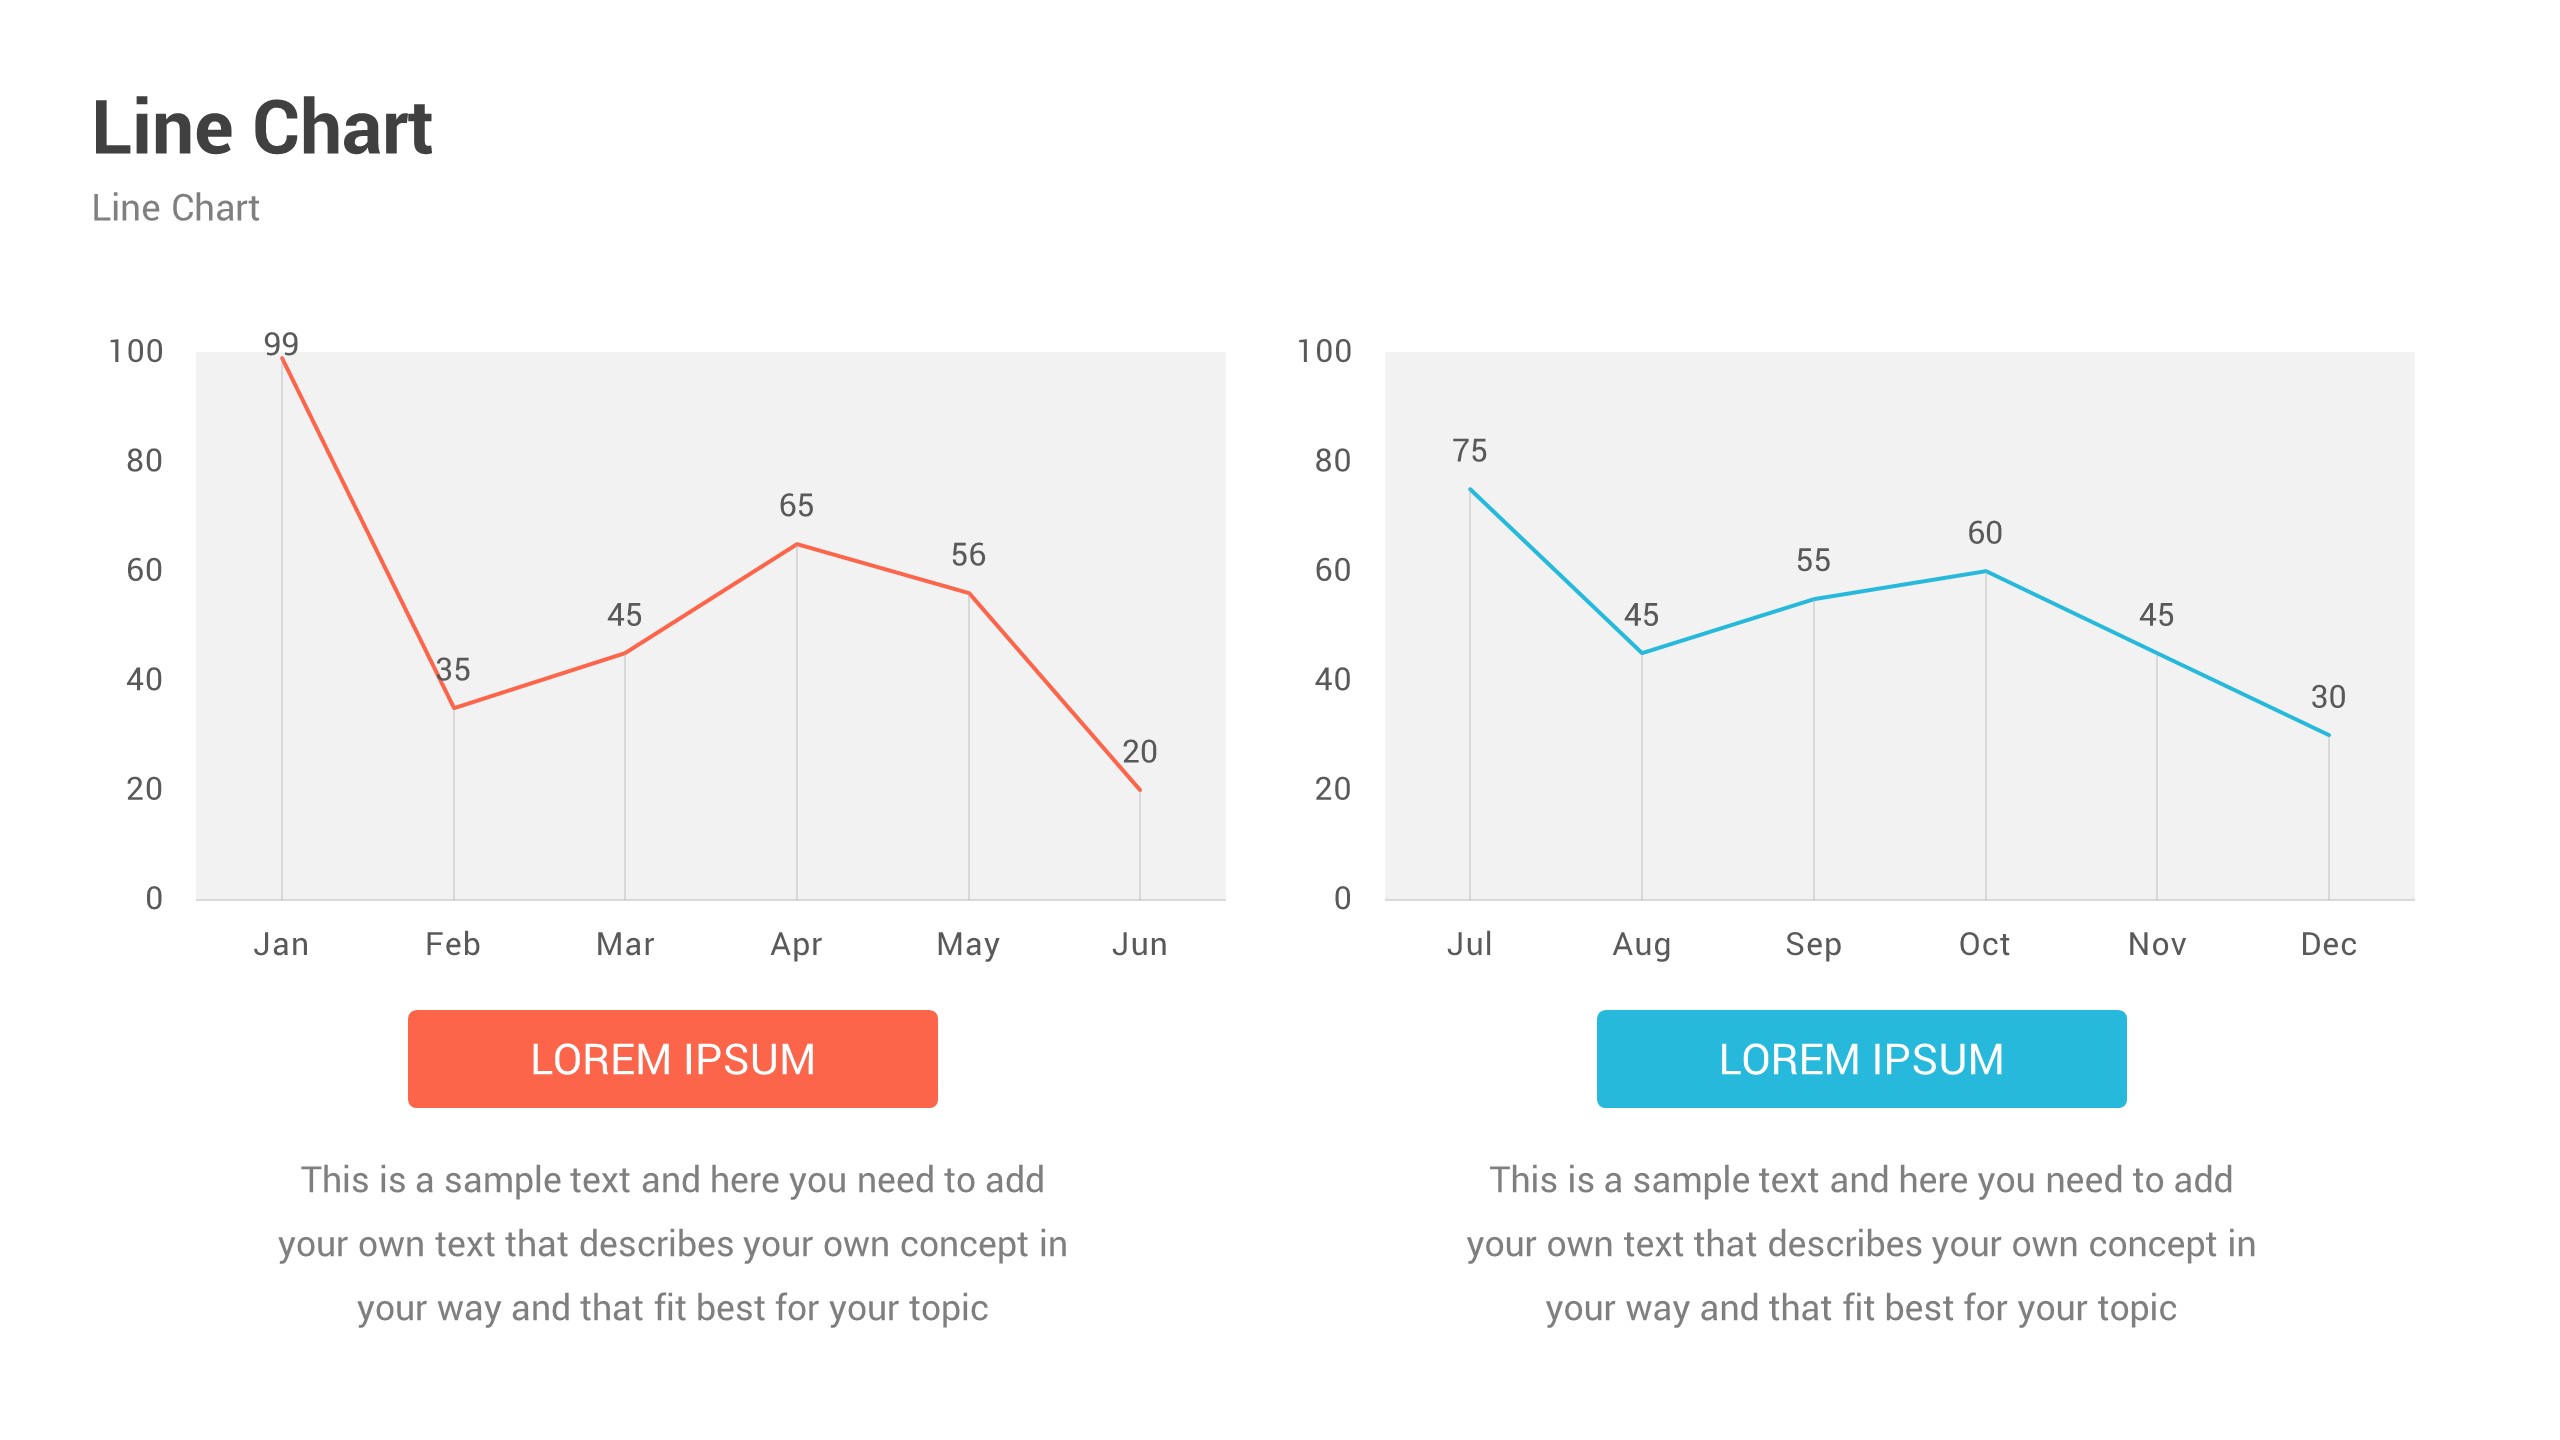
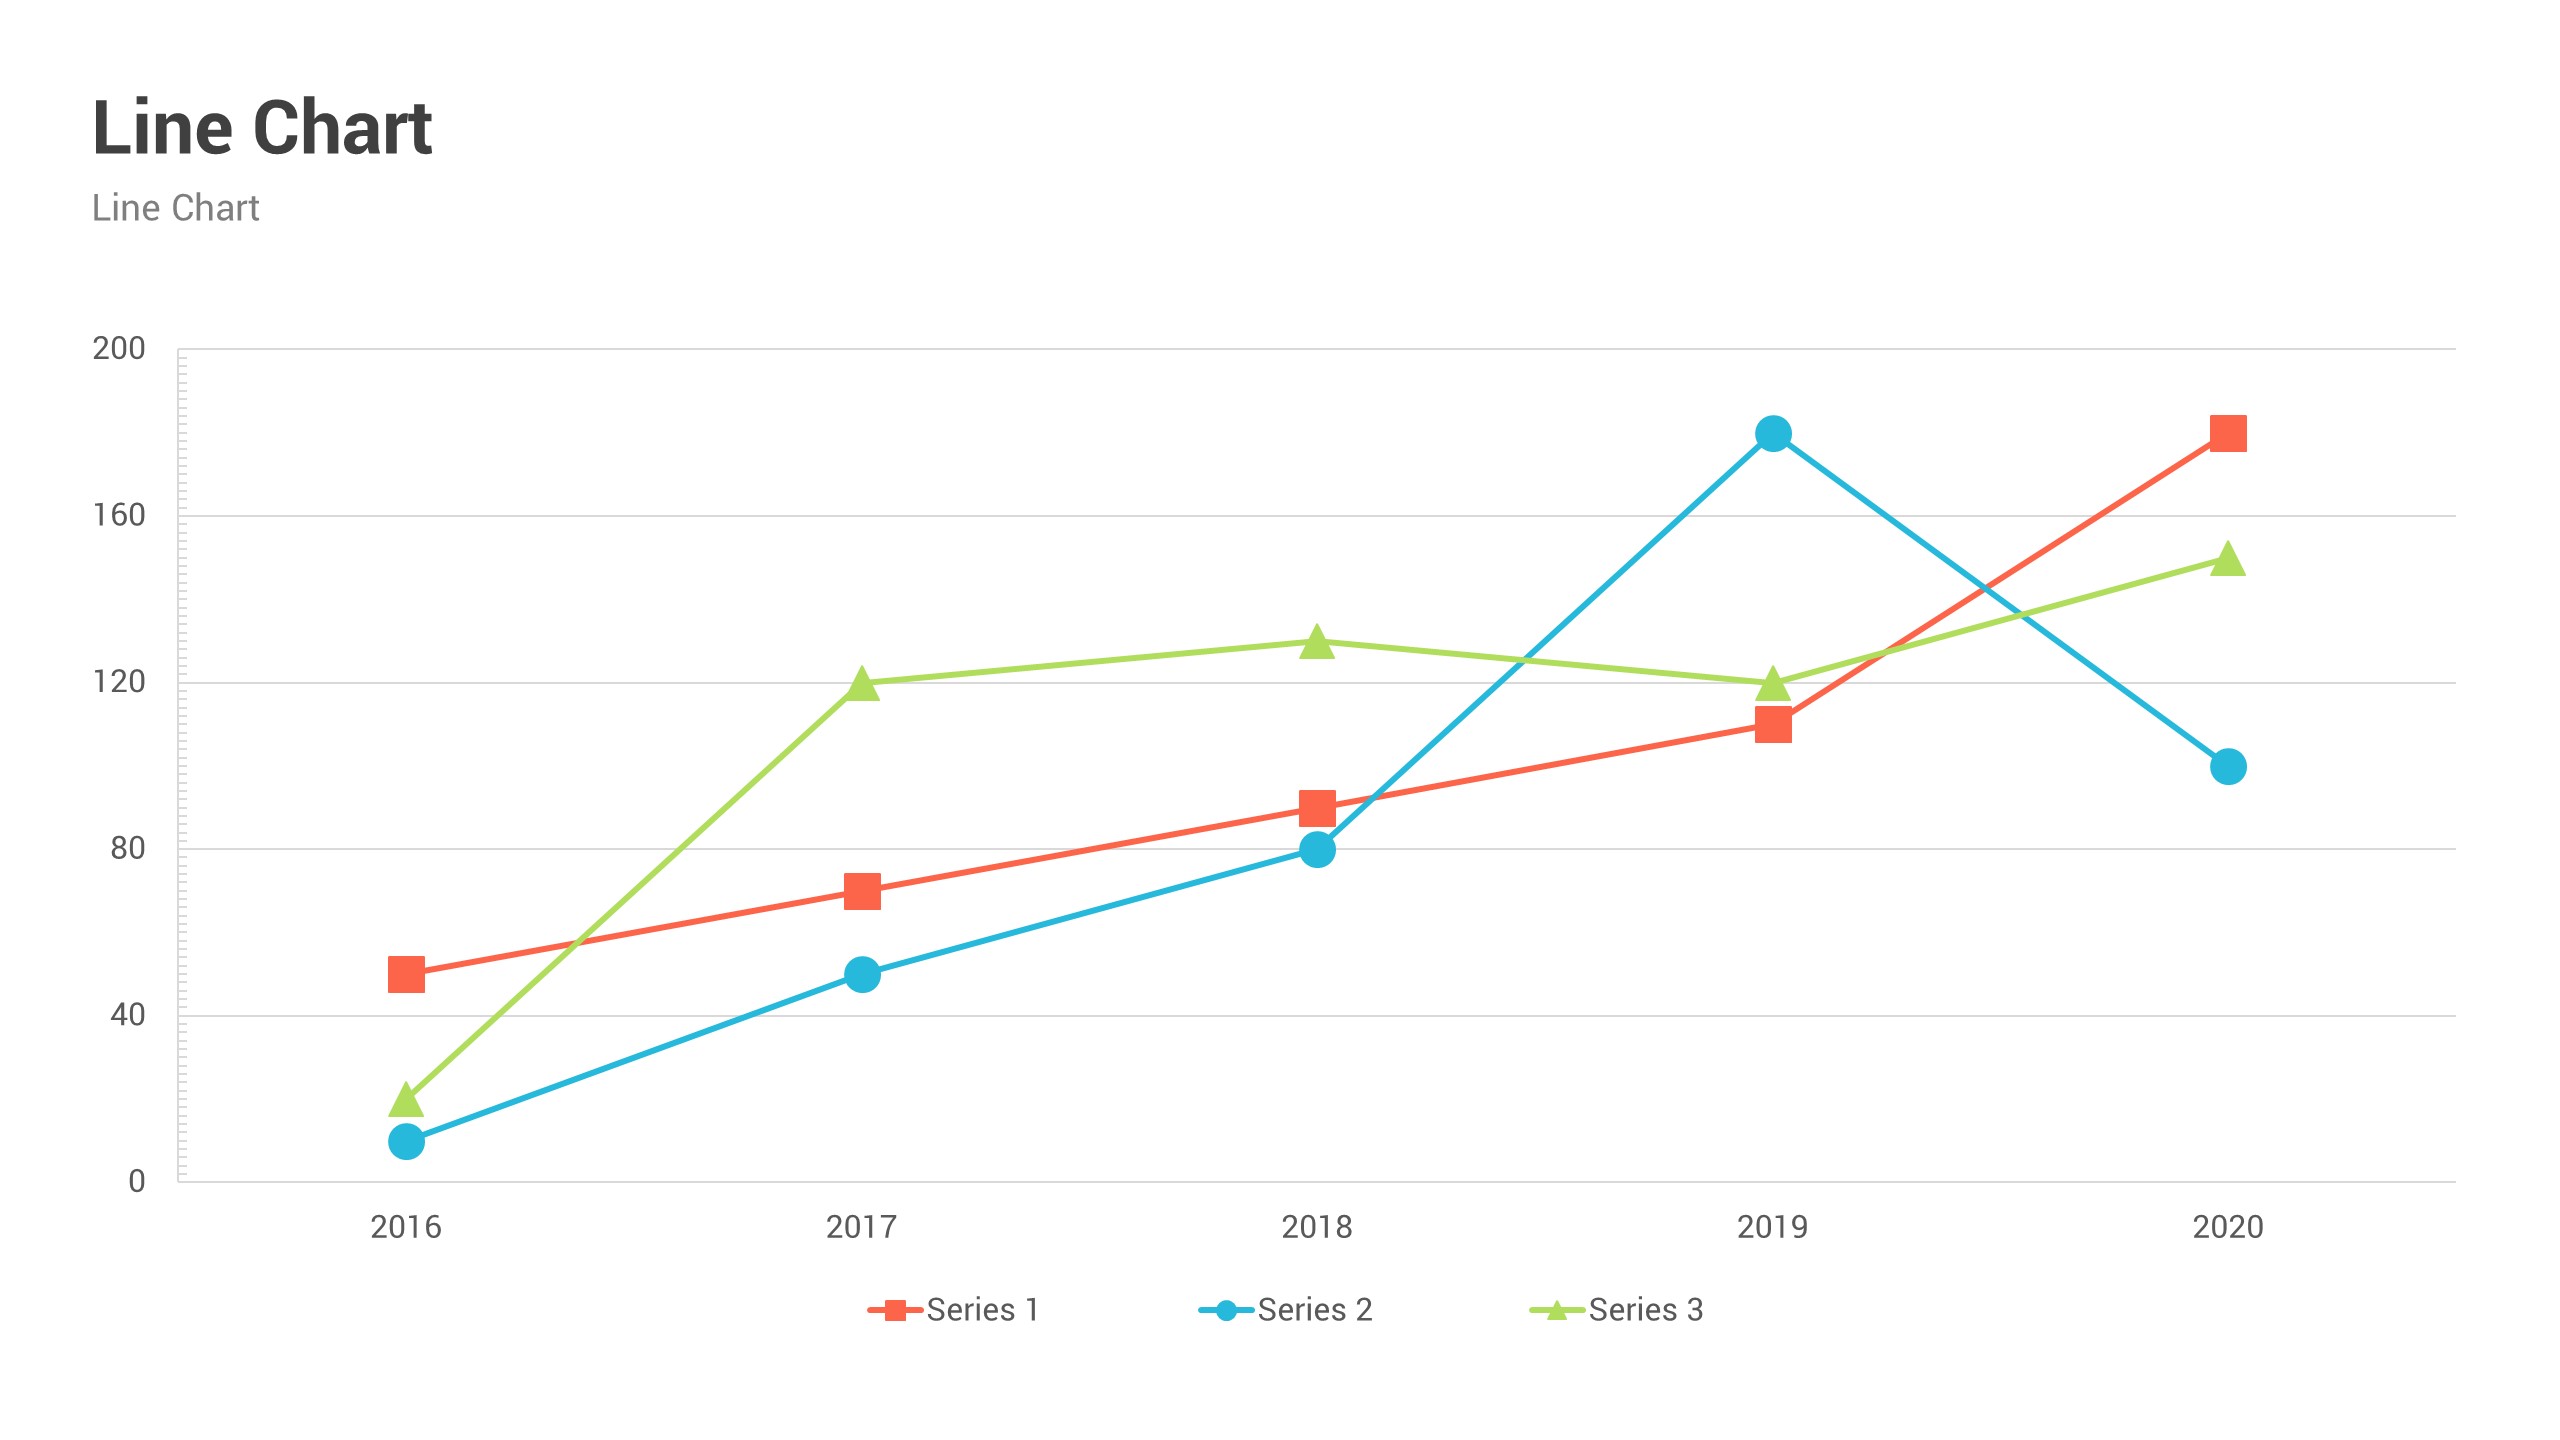
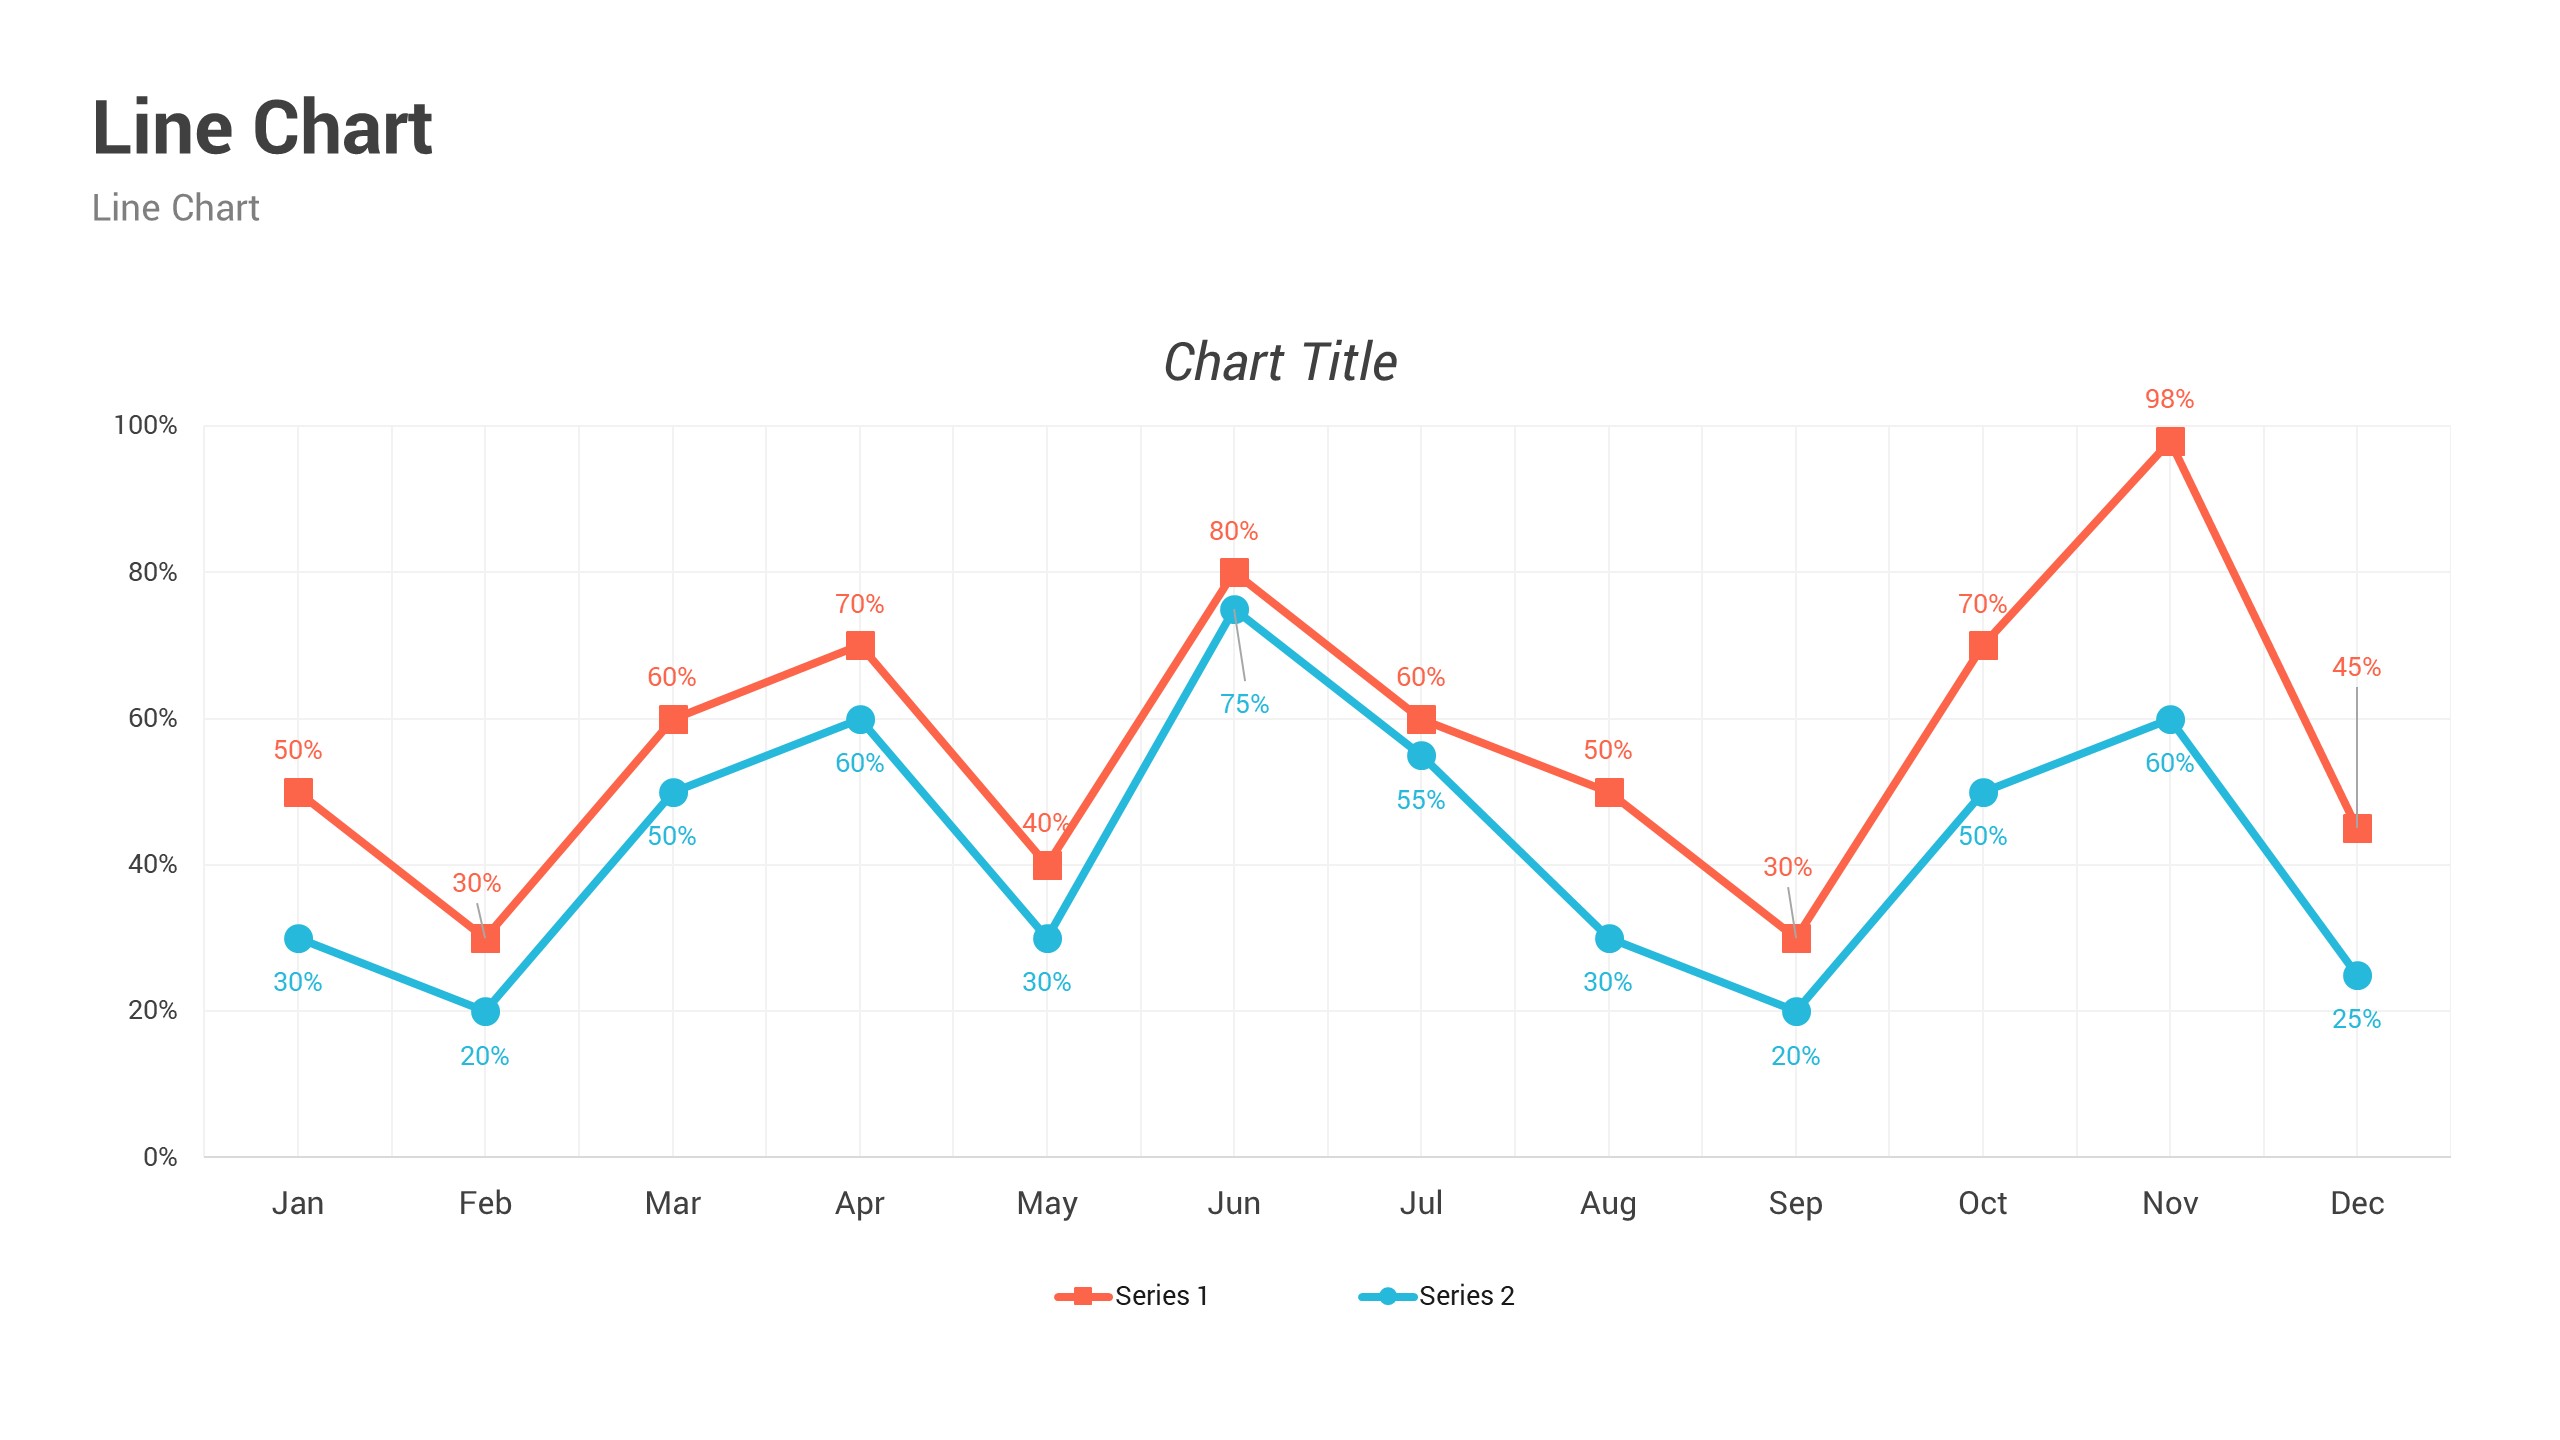
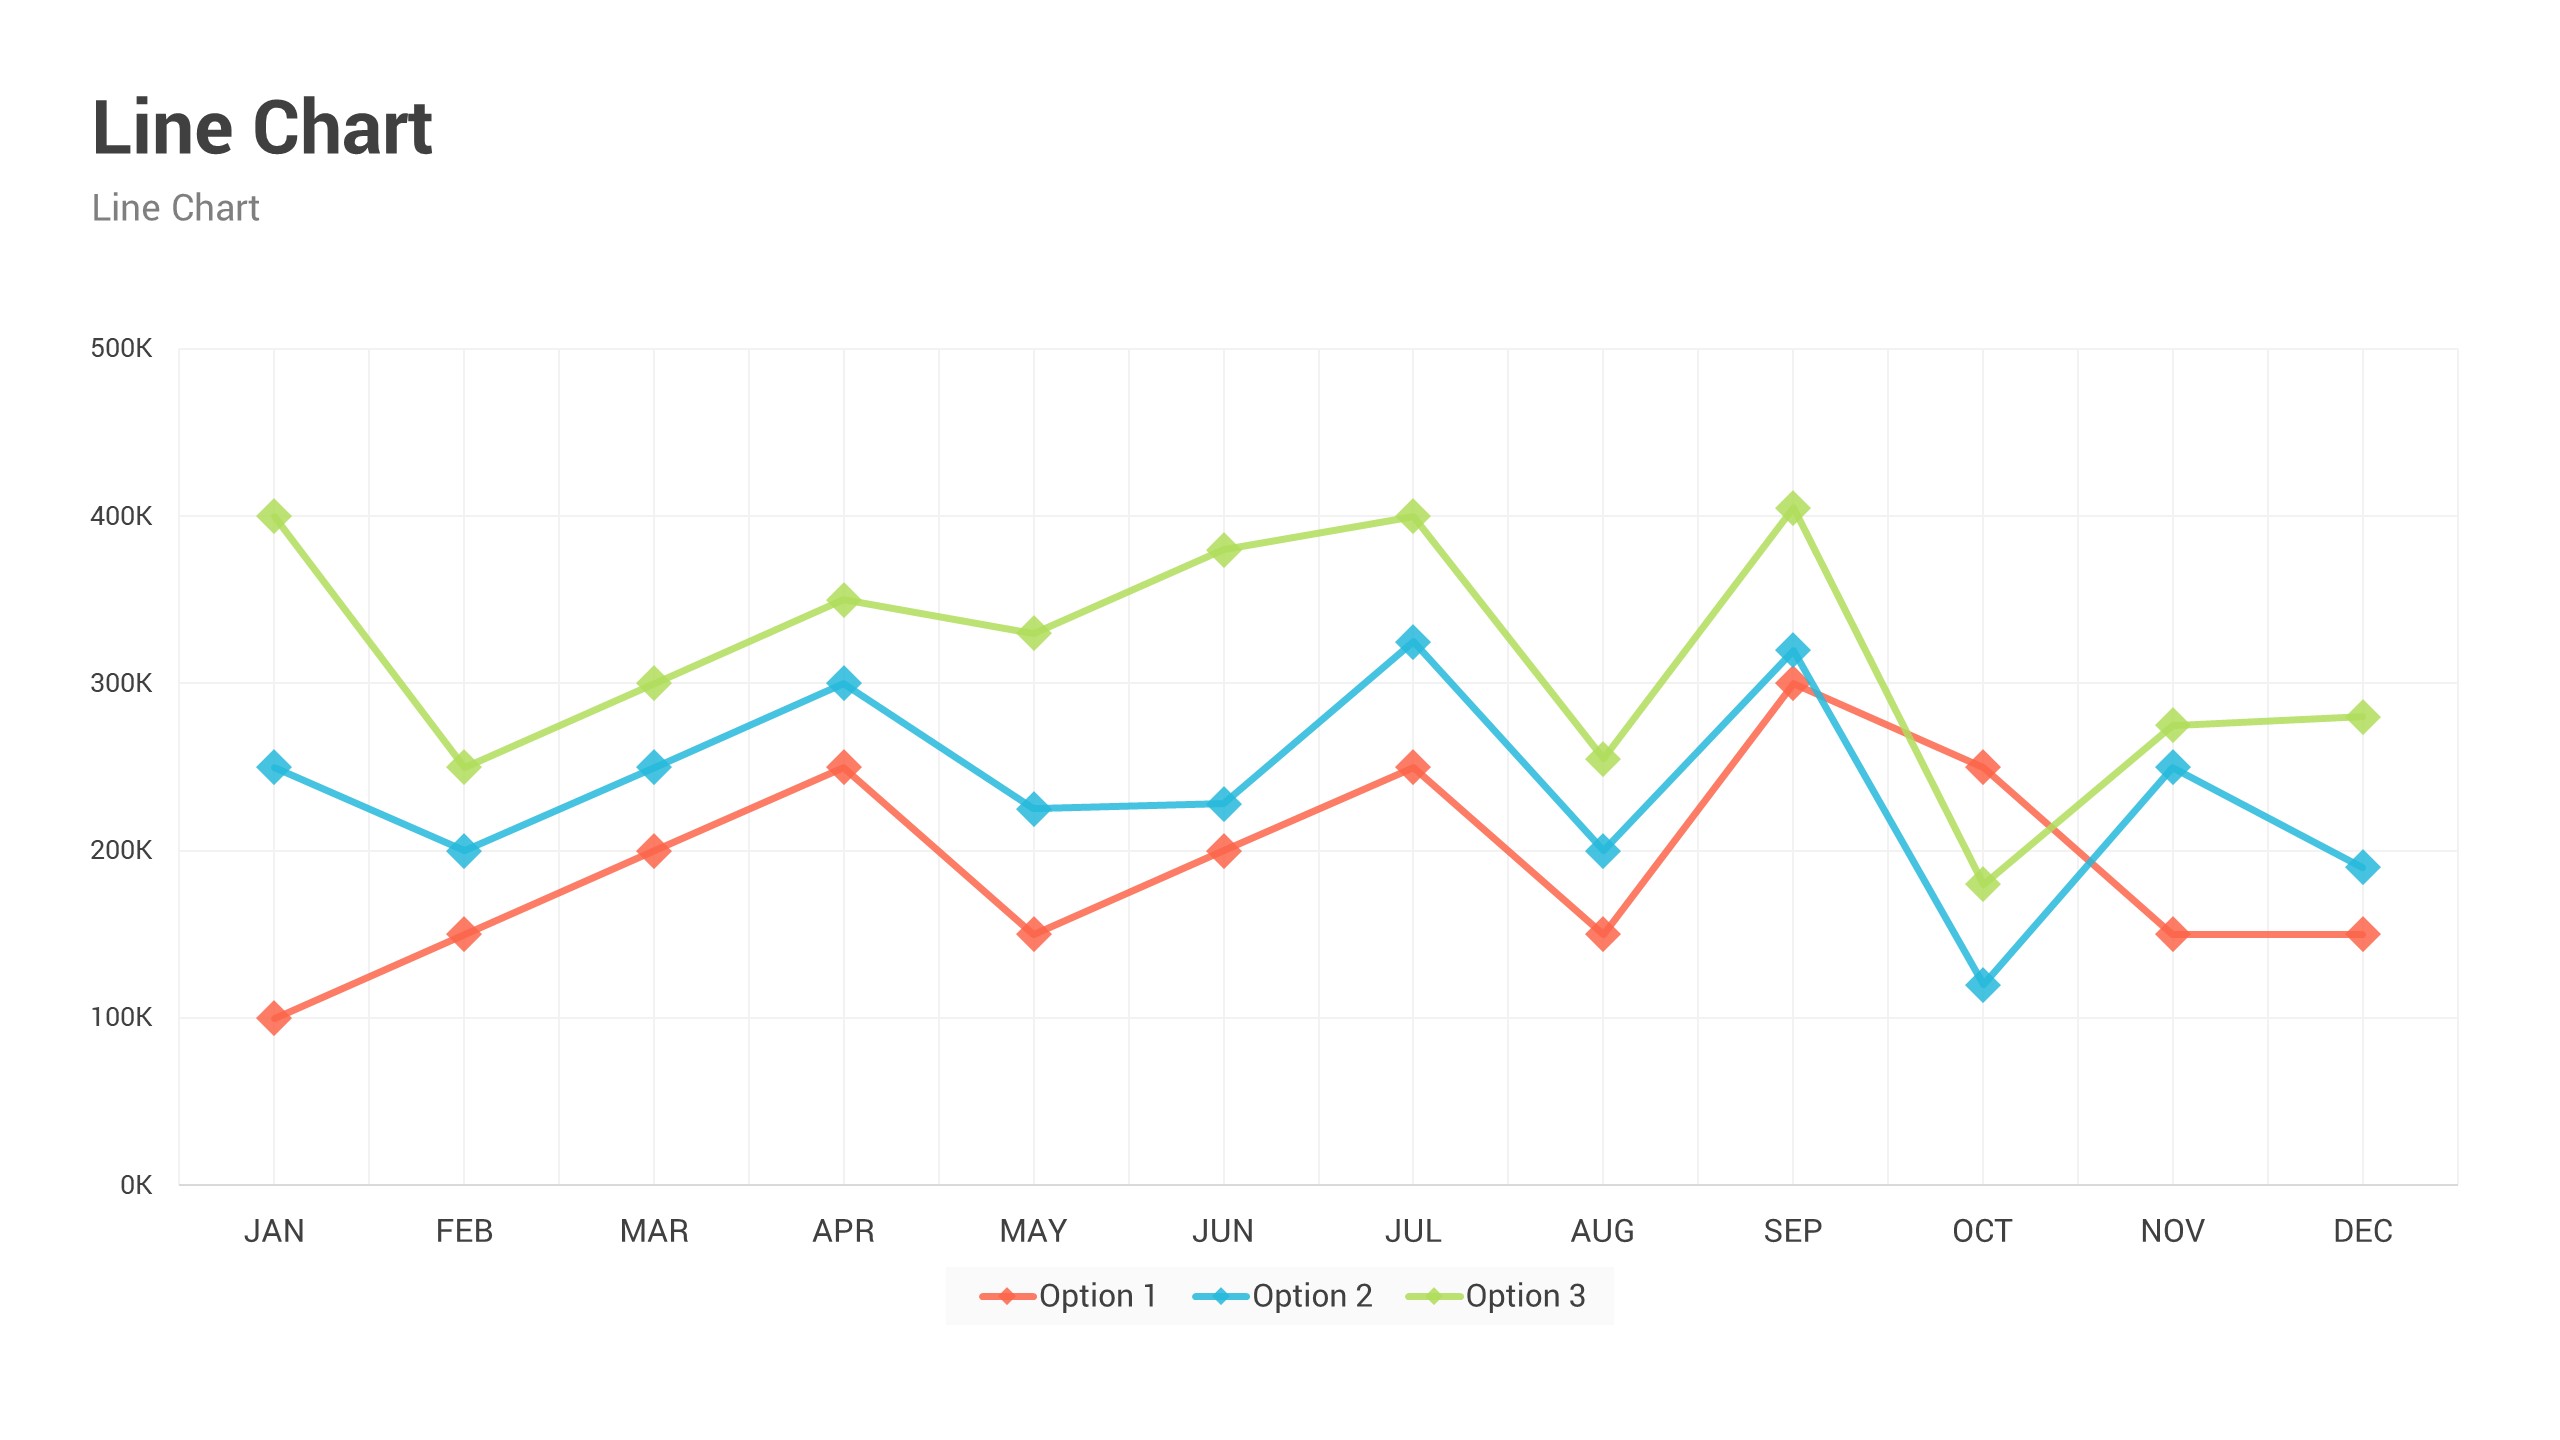
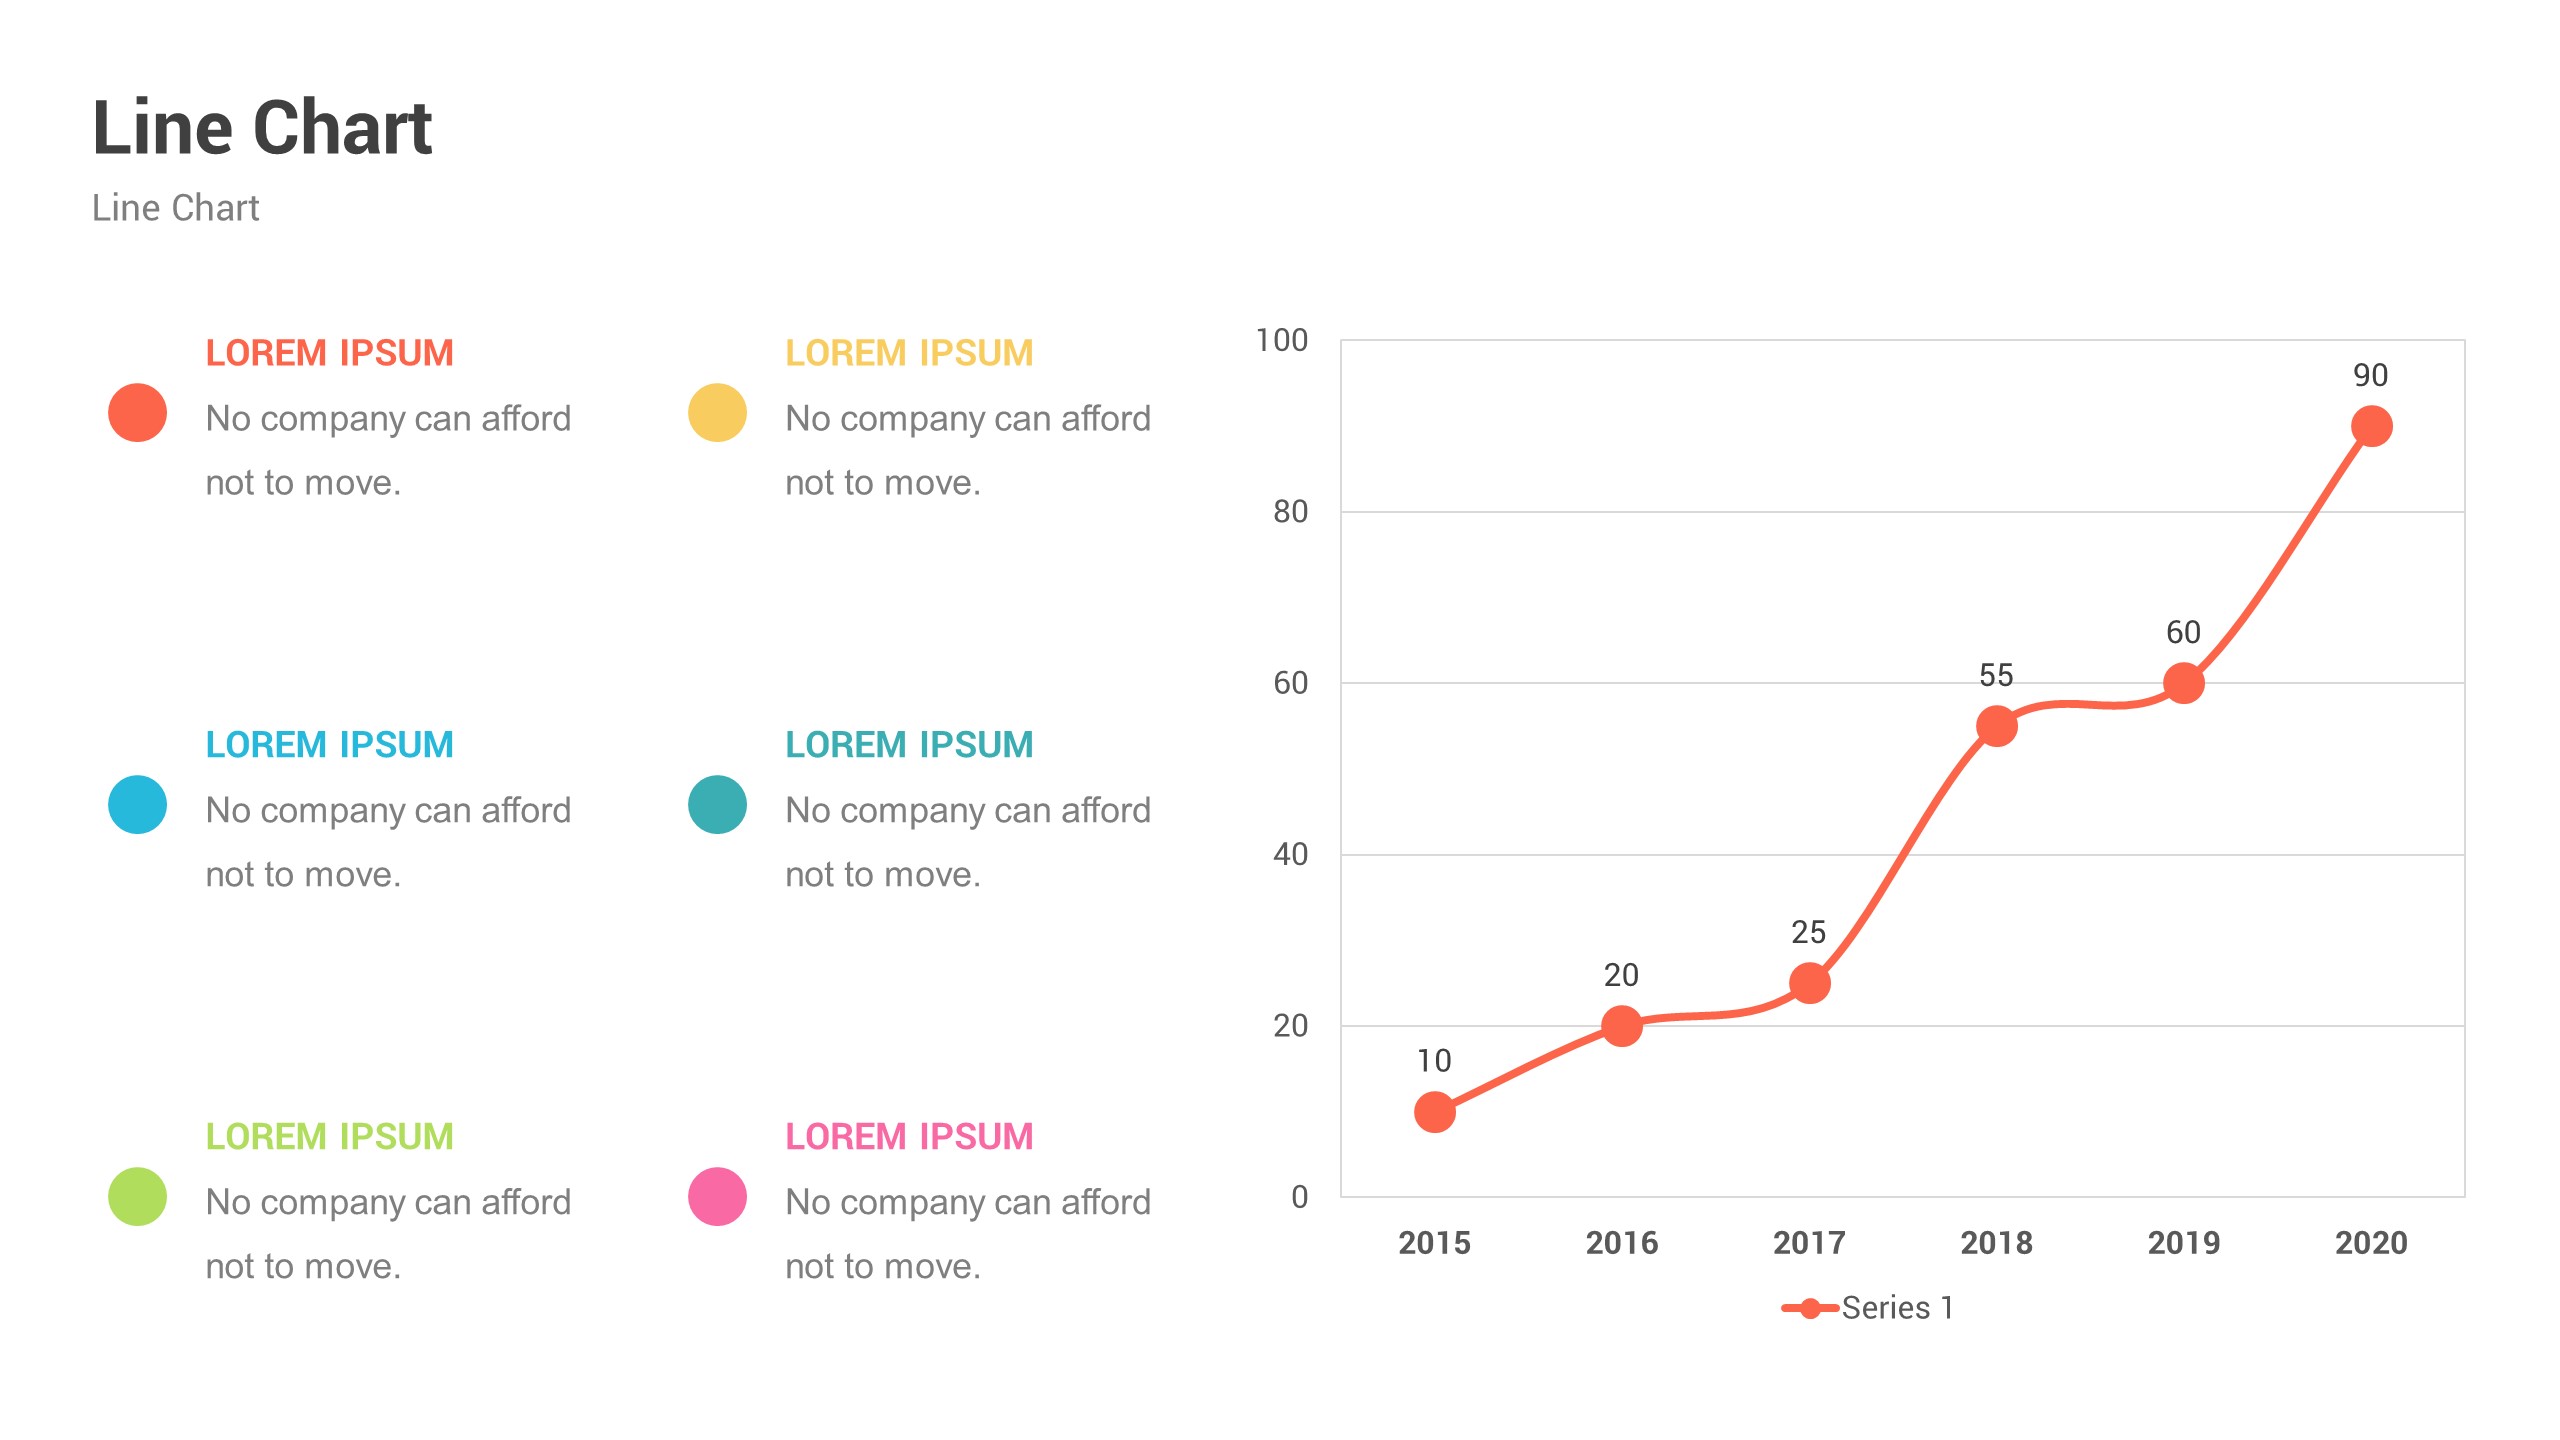
- Line Charts
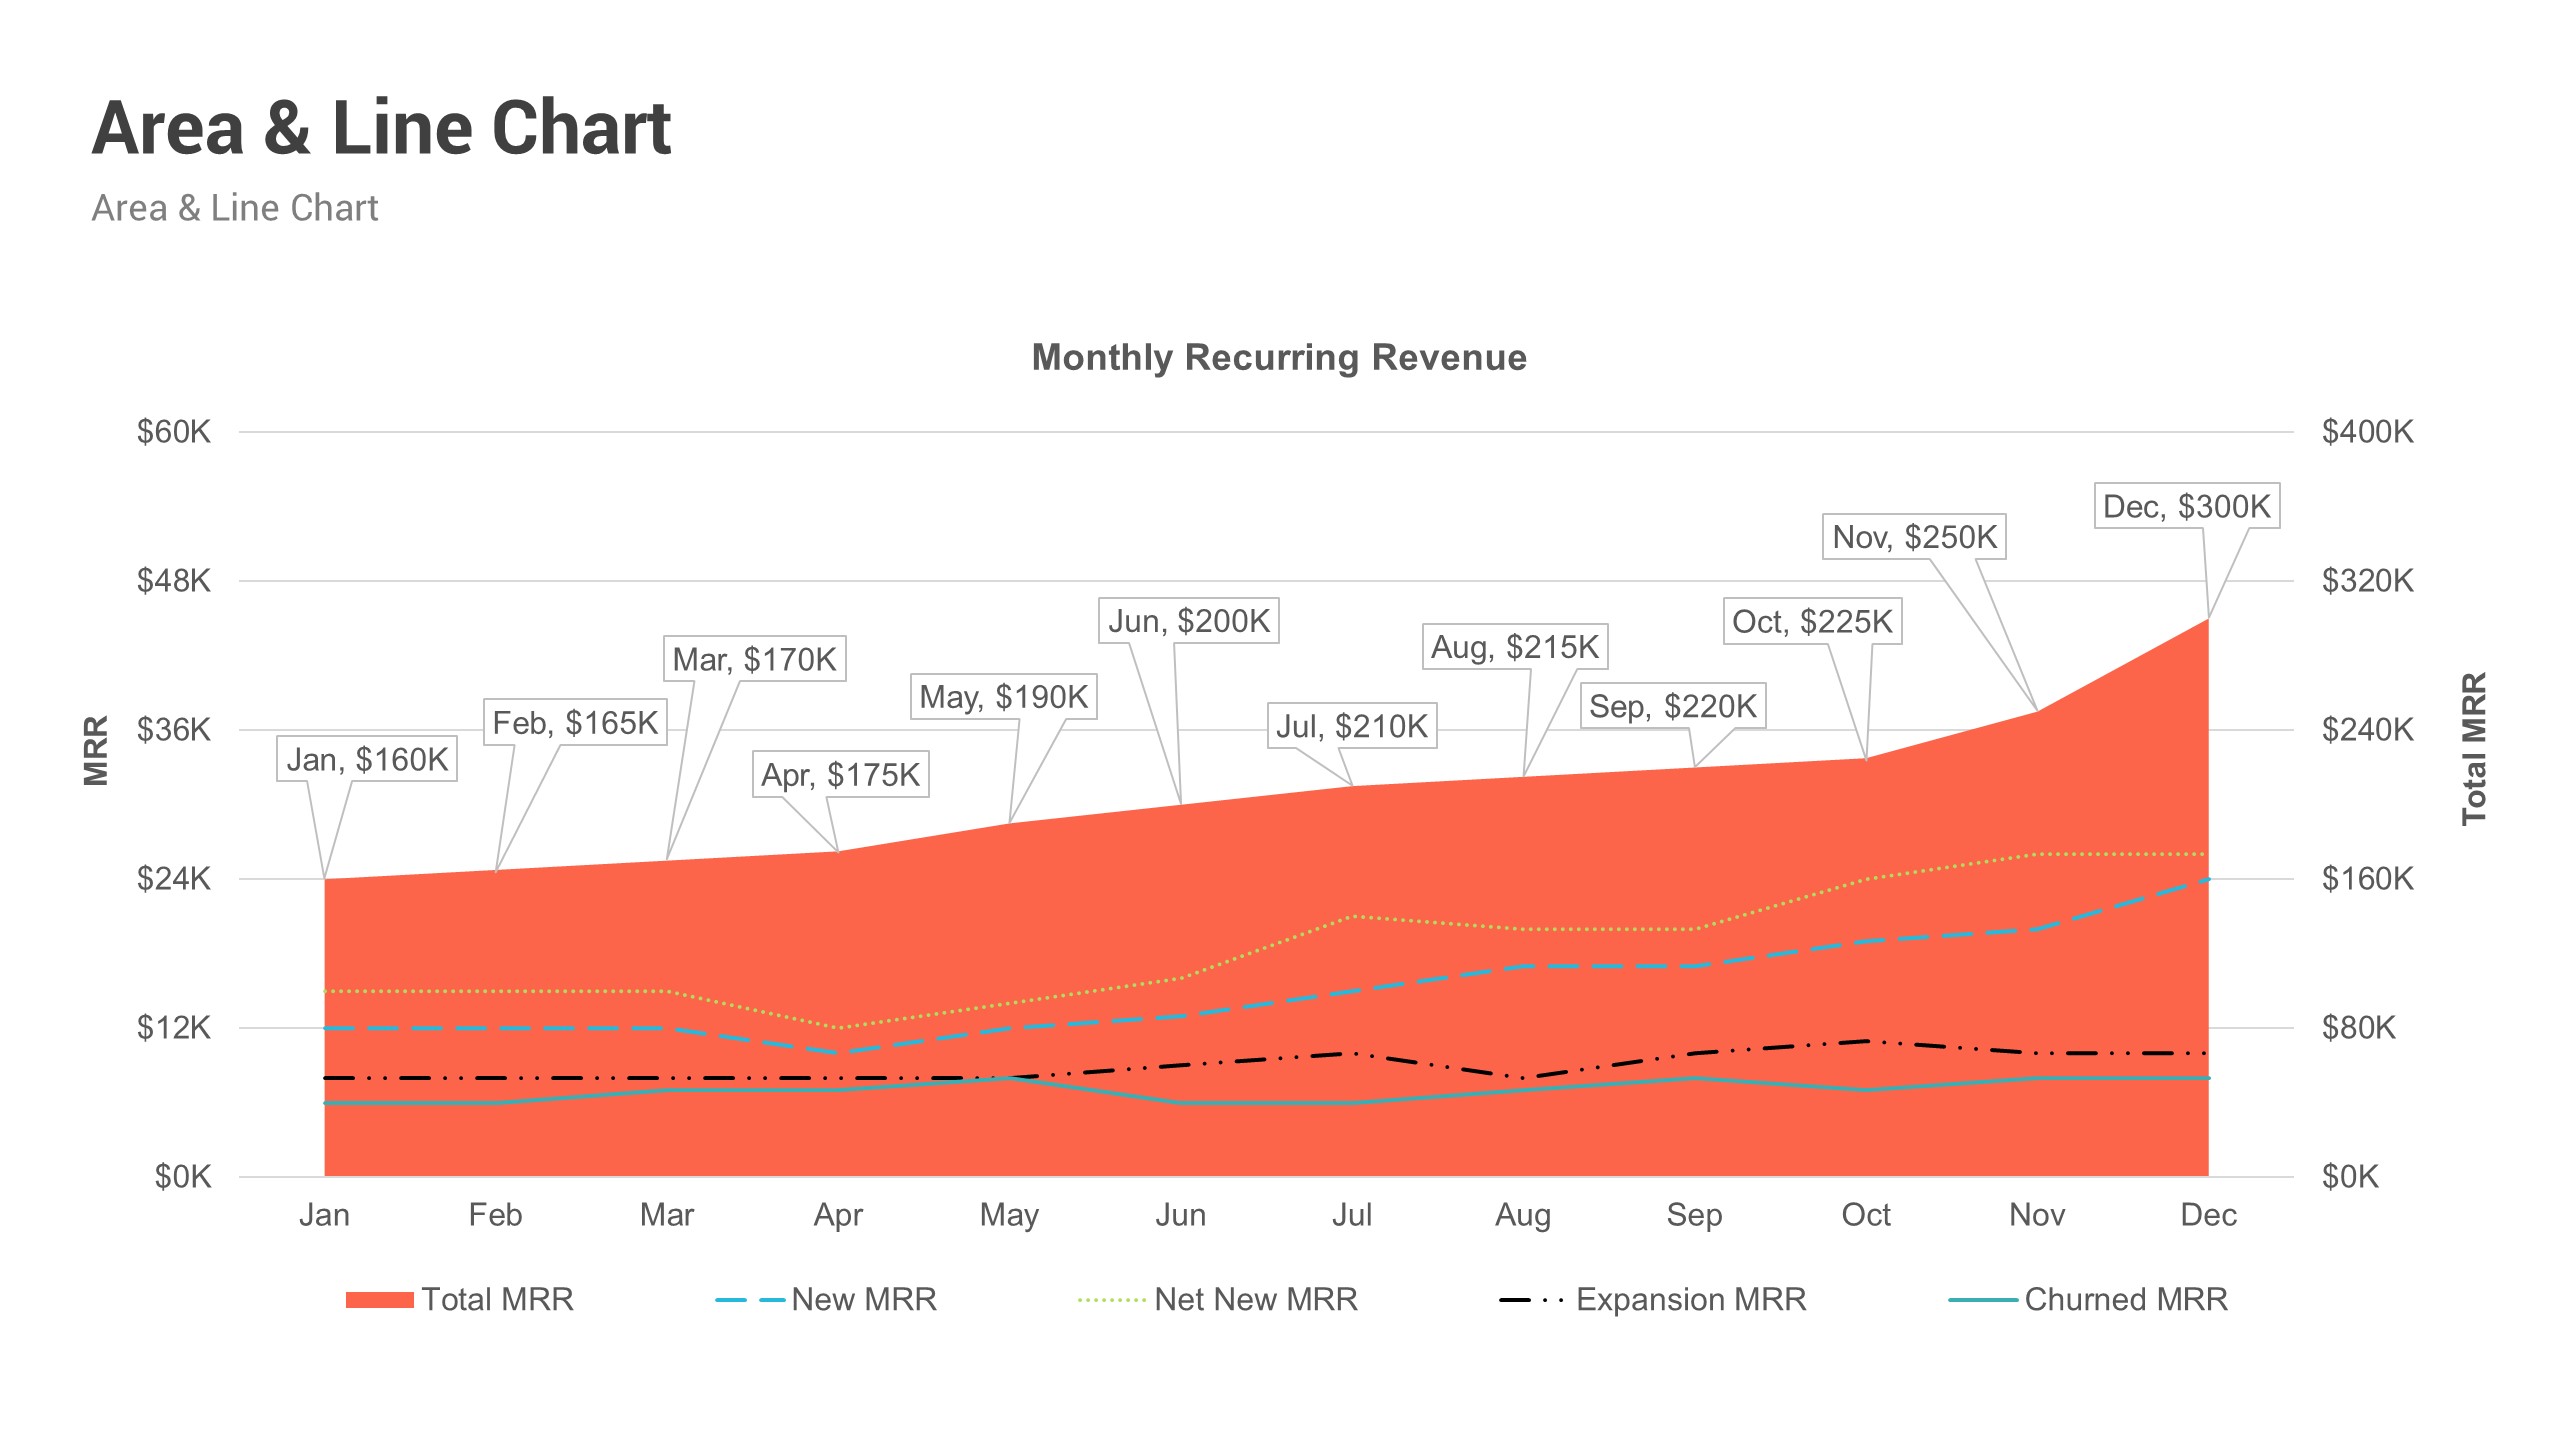
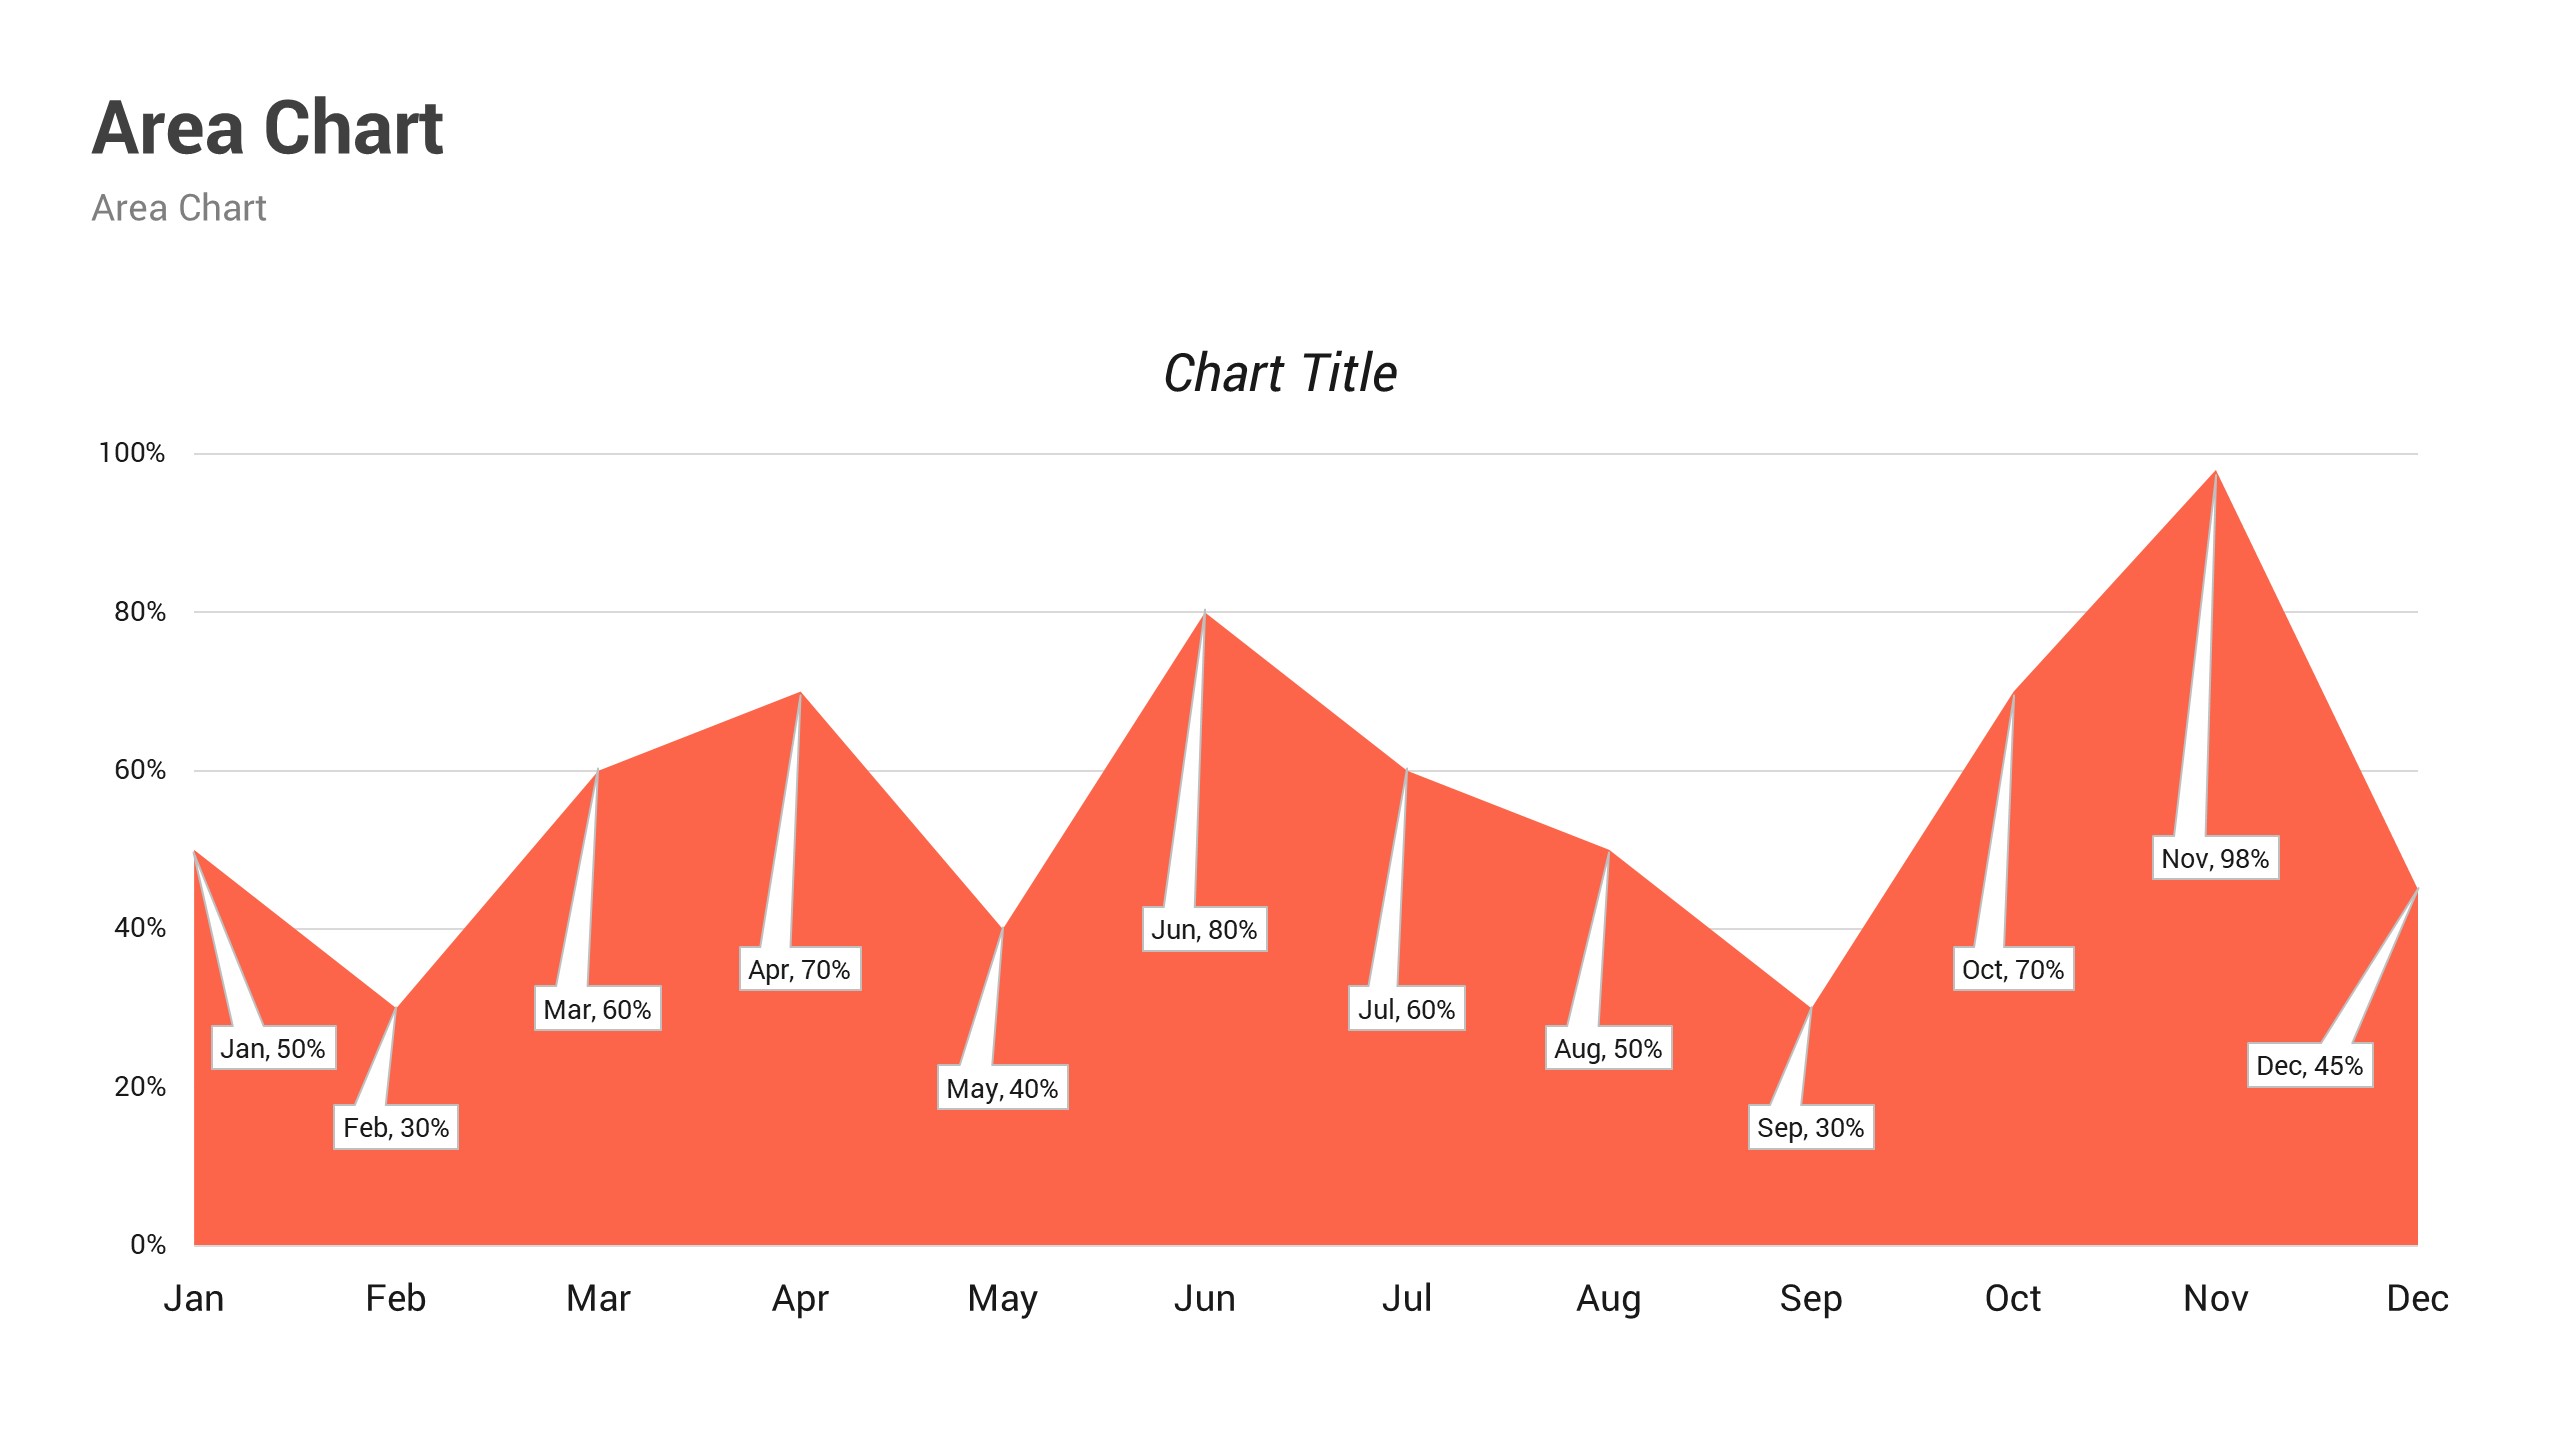
- Area Charts
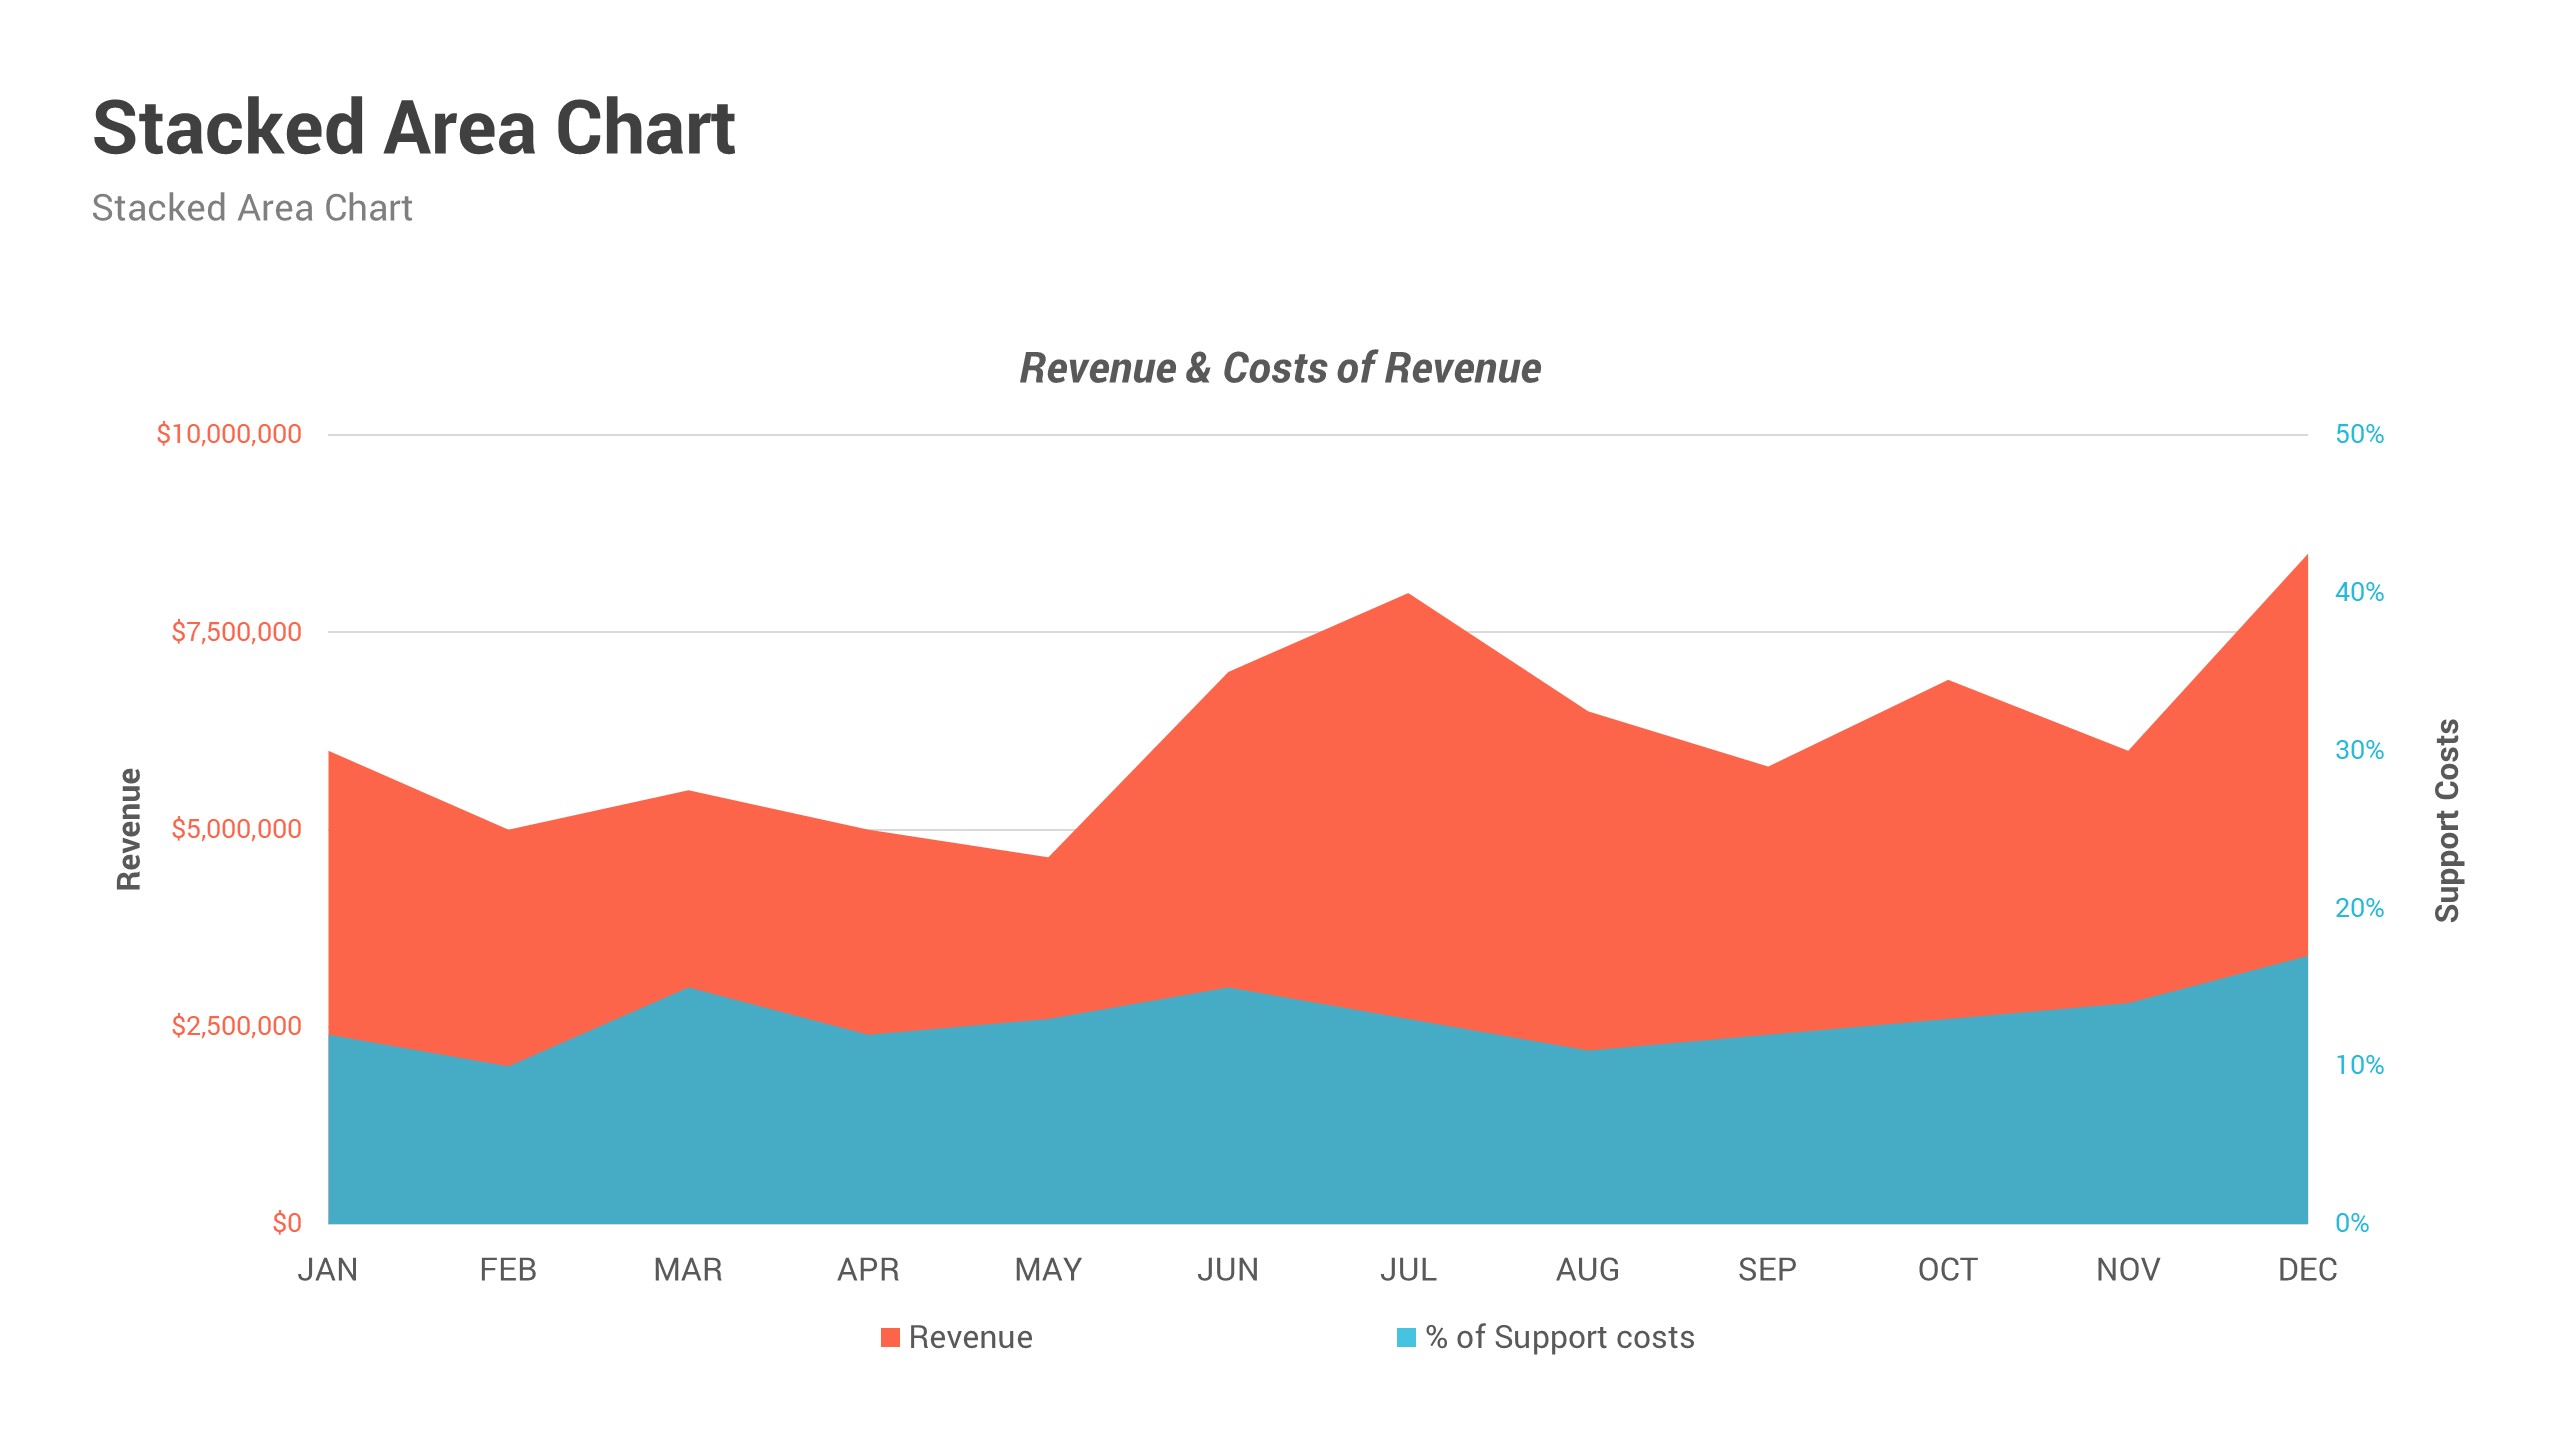
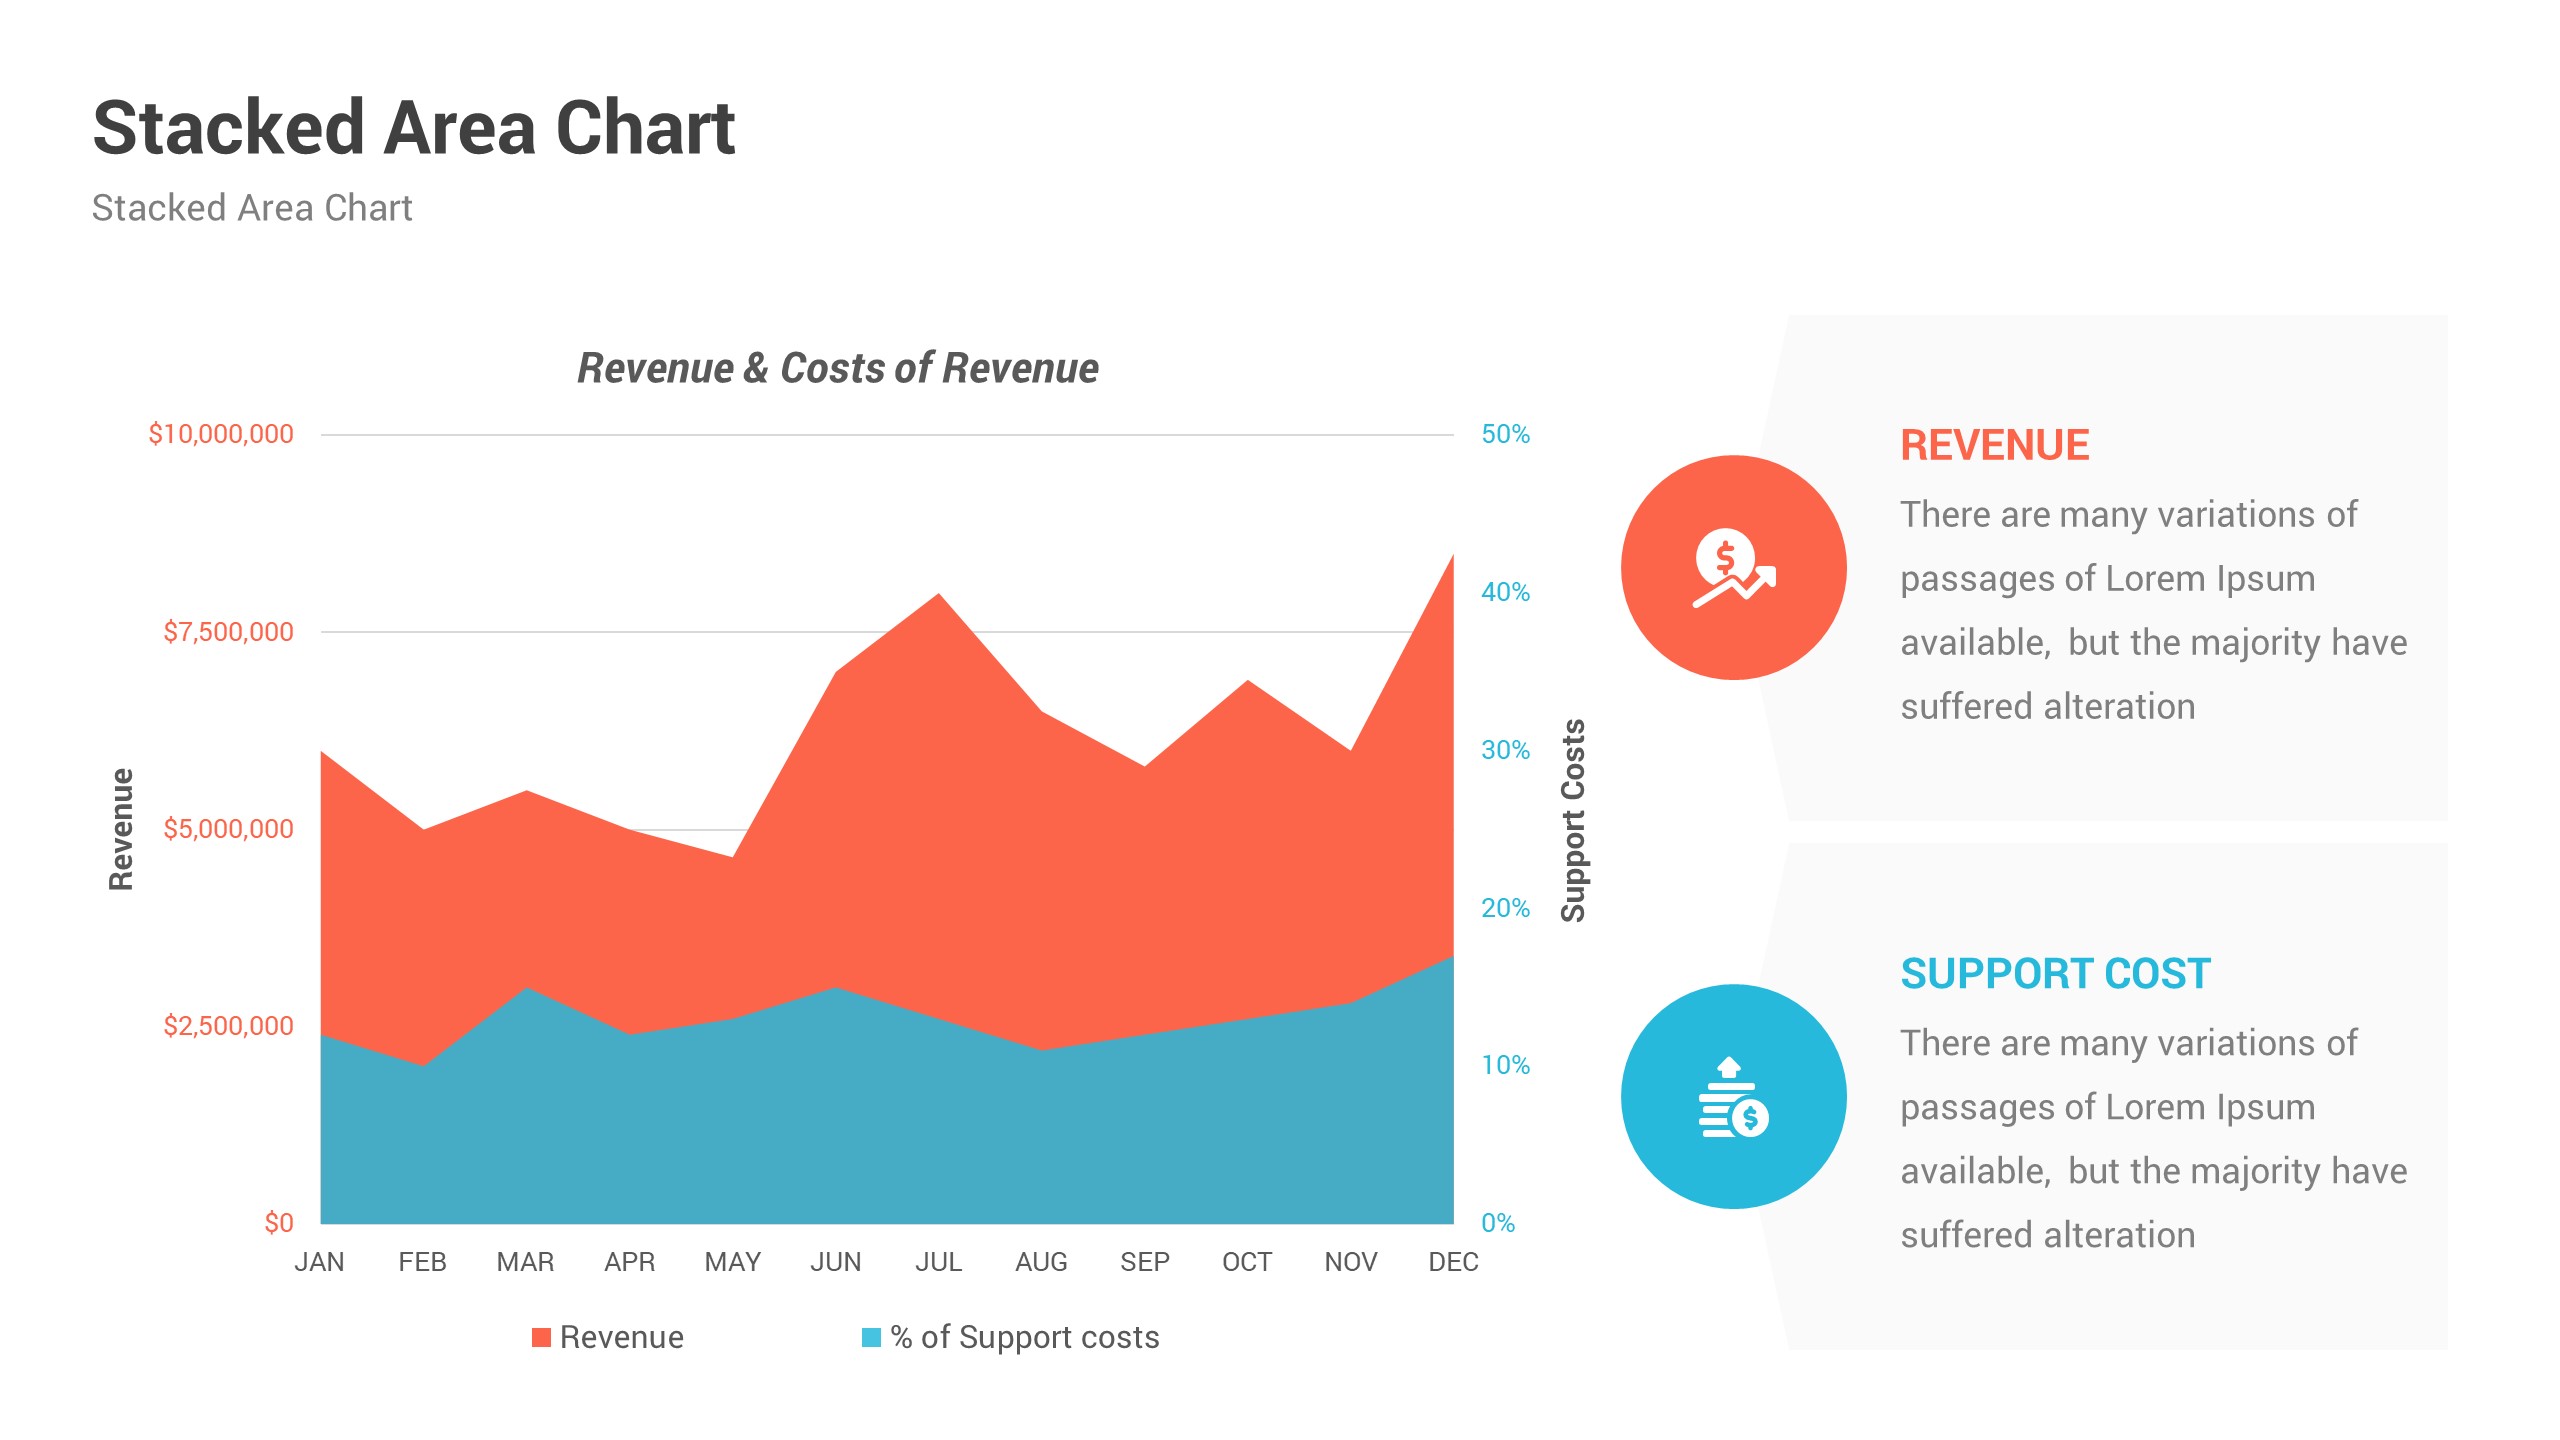
- Stacked Area Charts
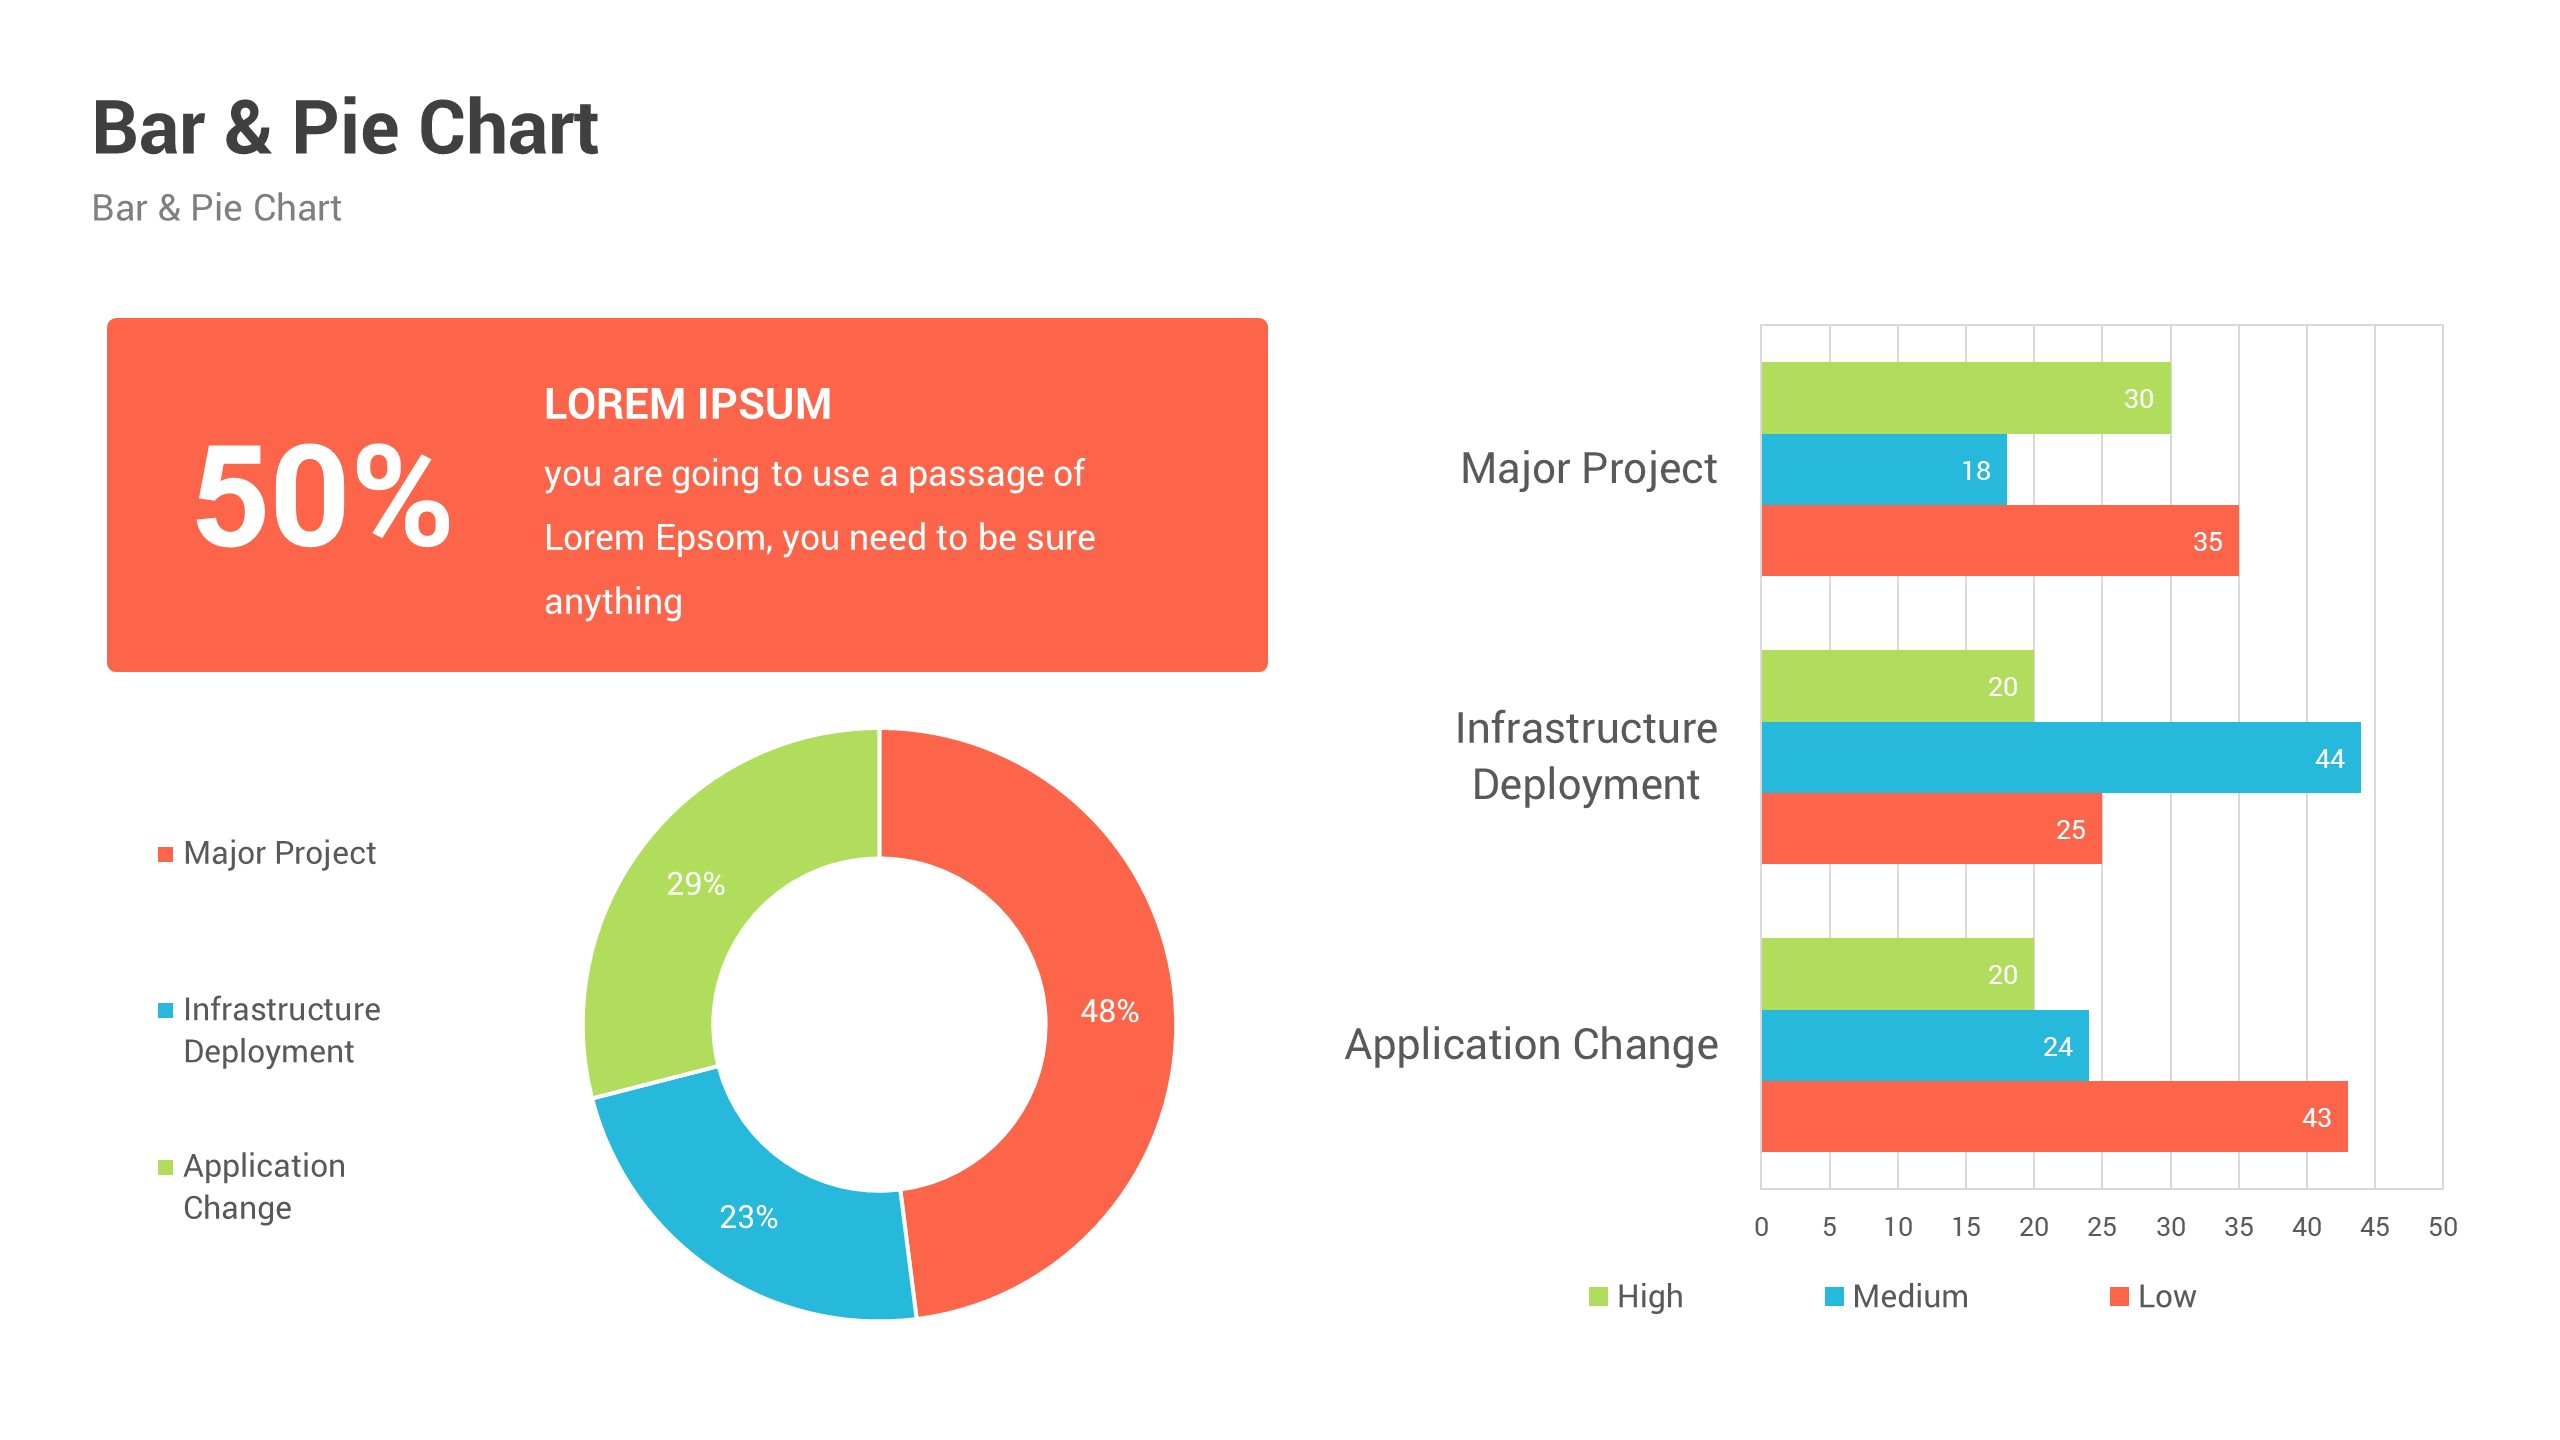
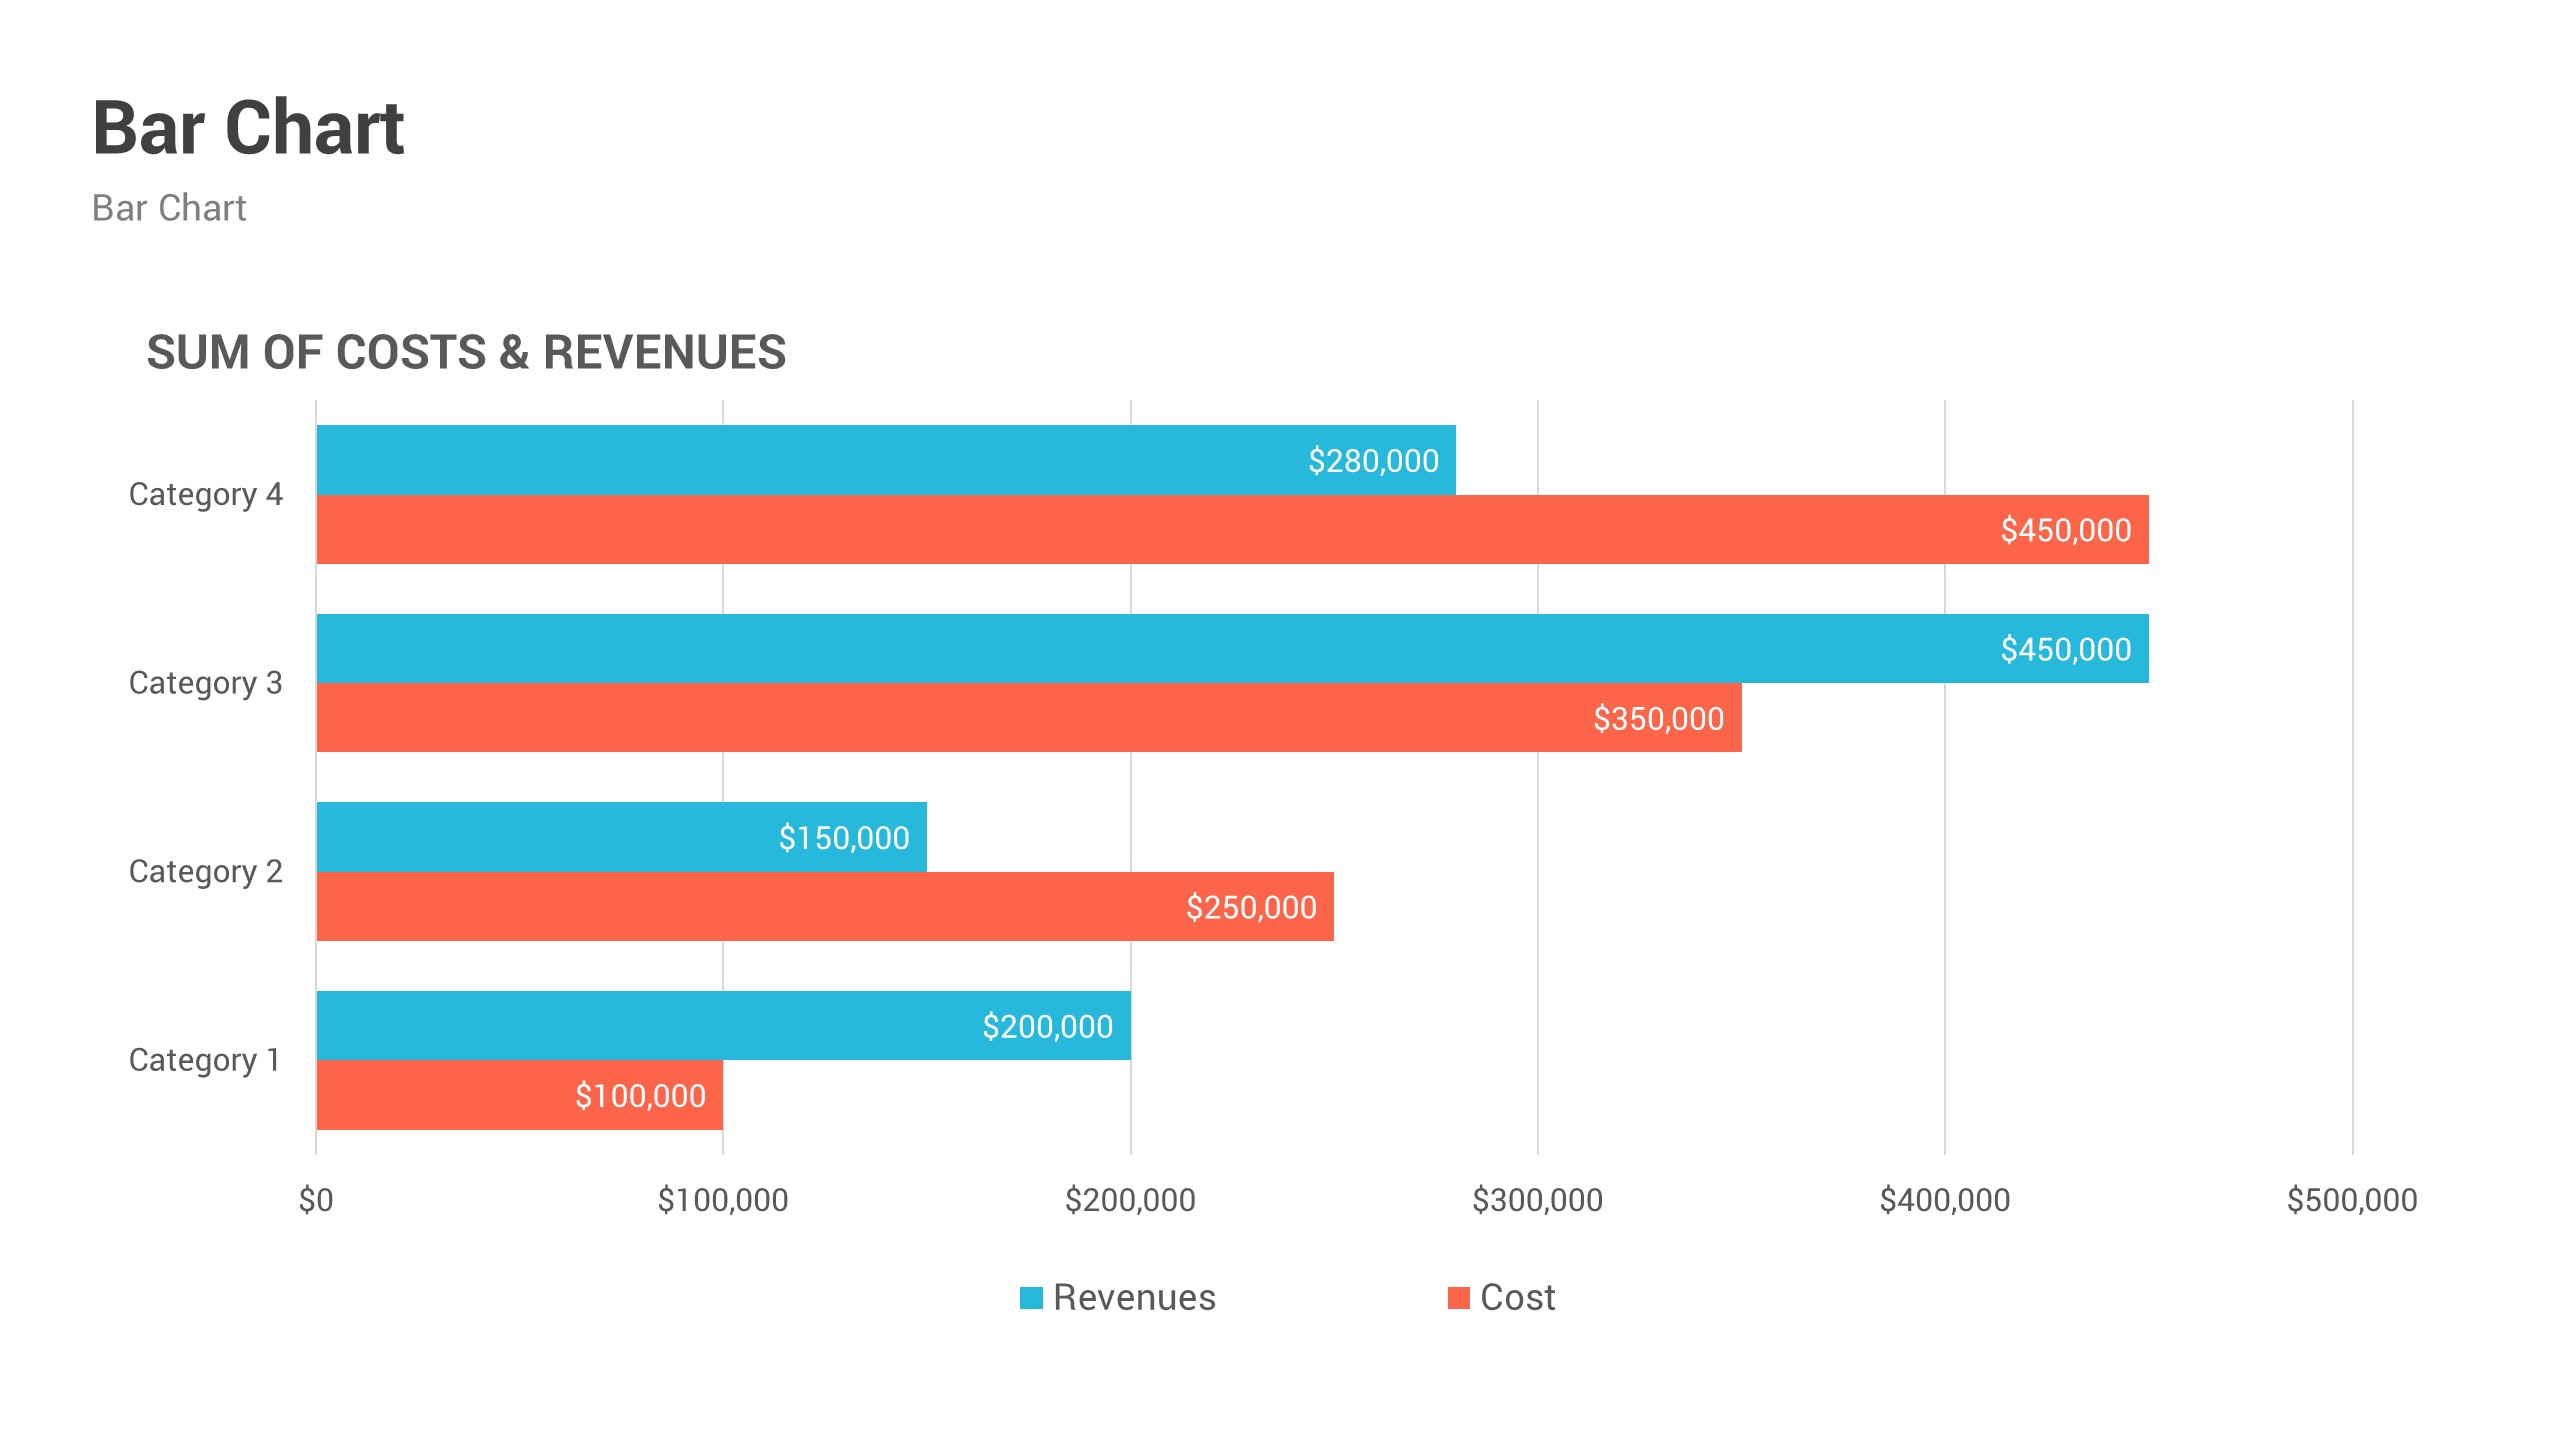
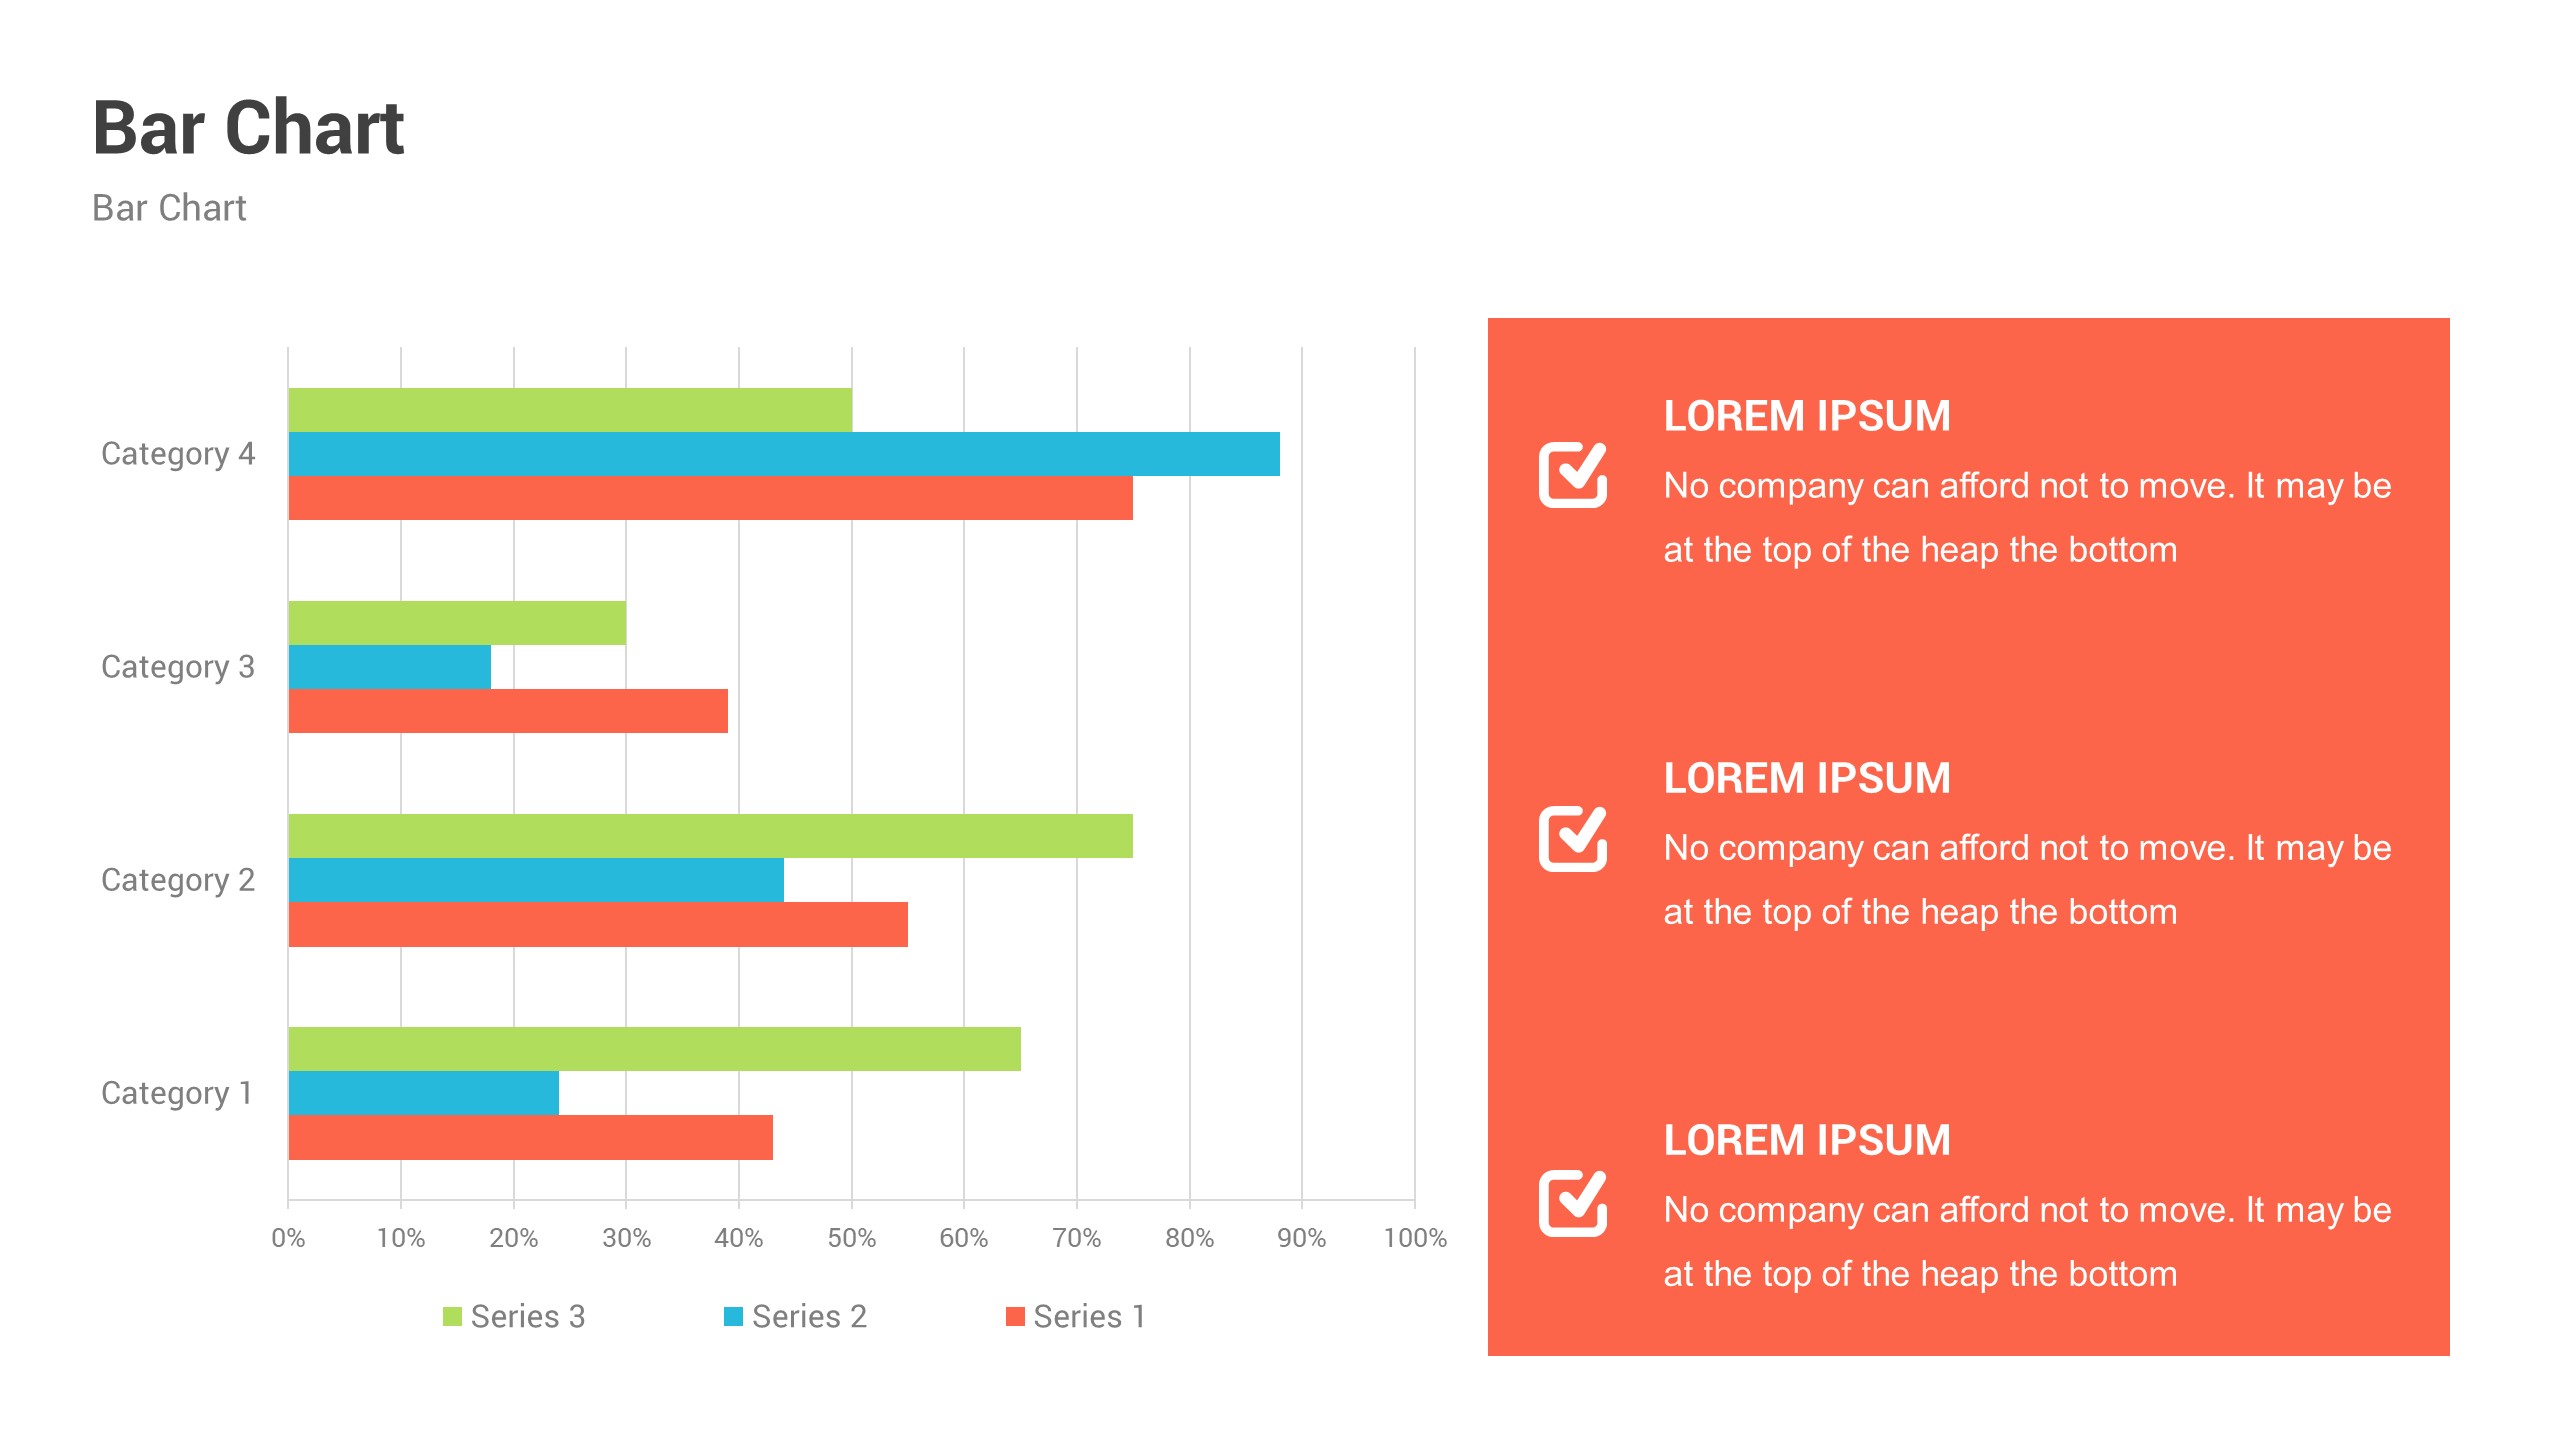
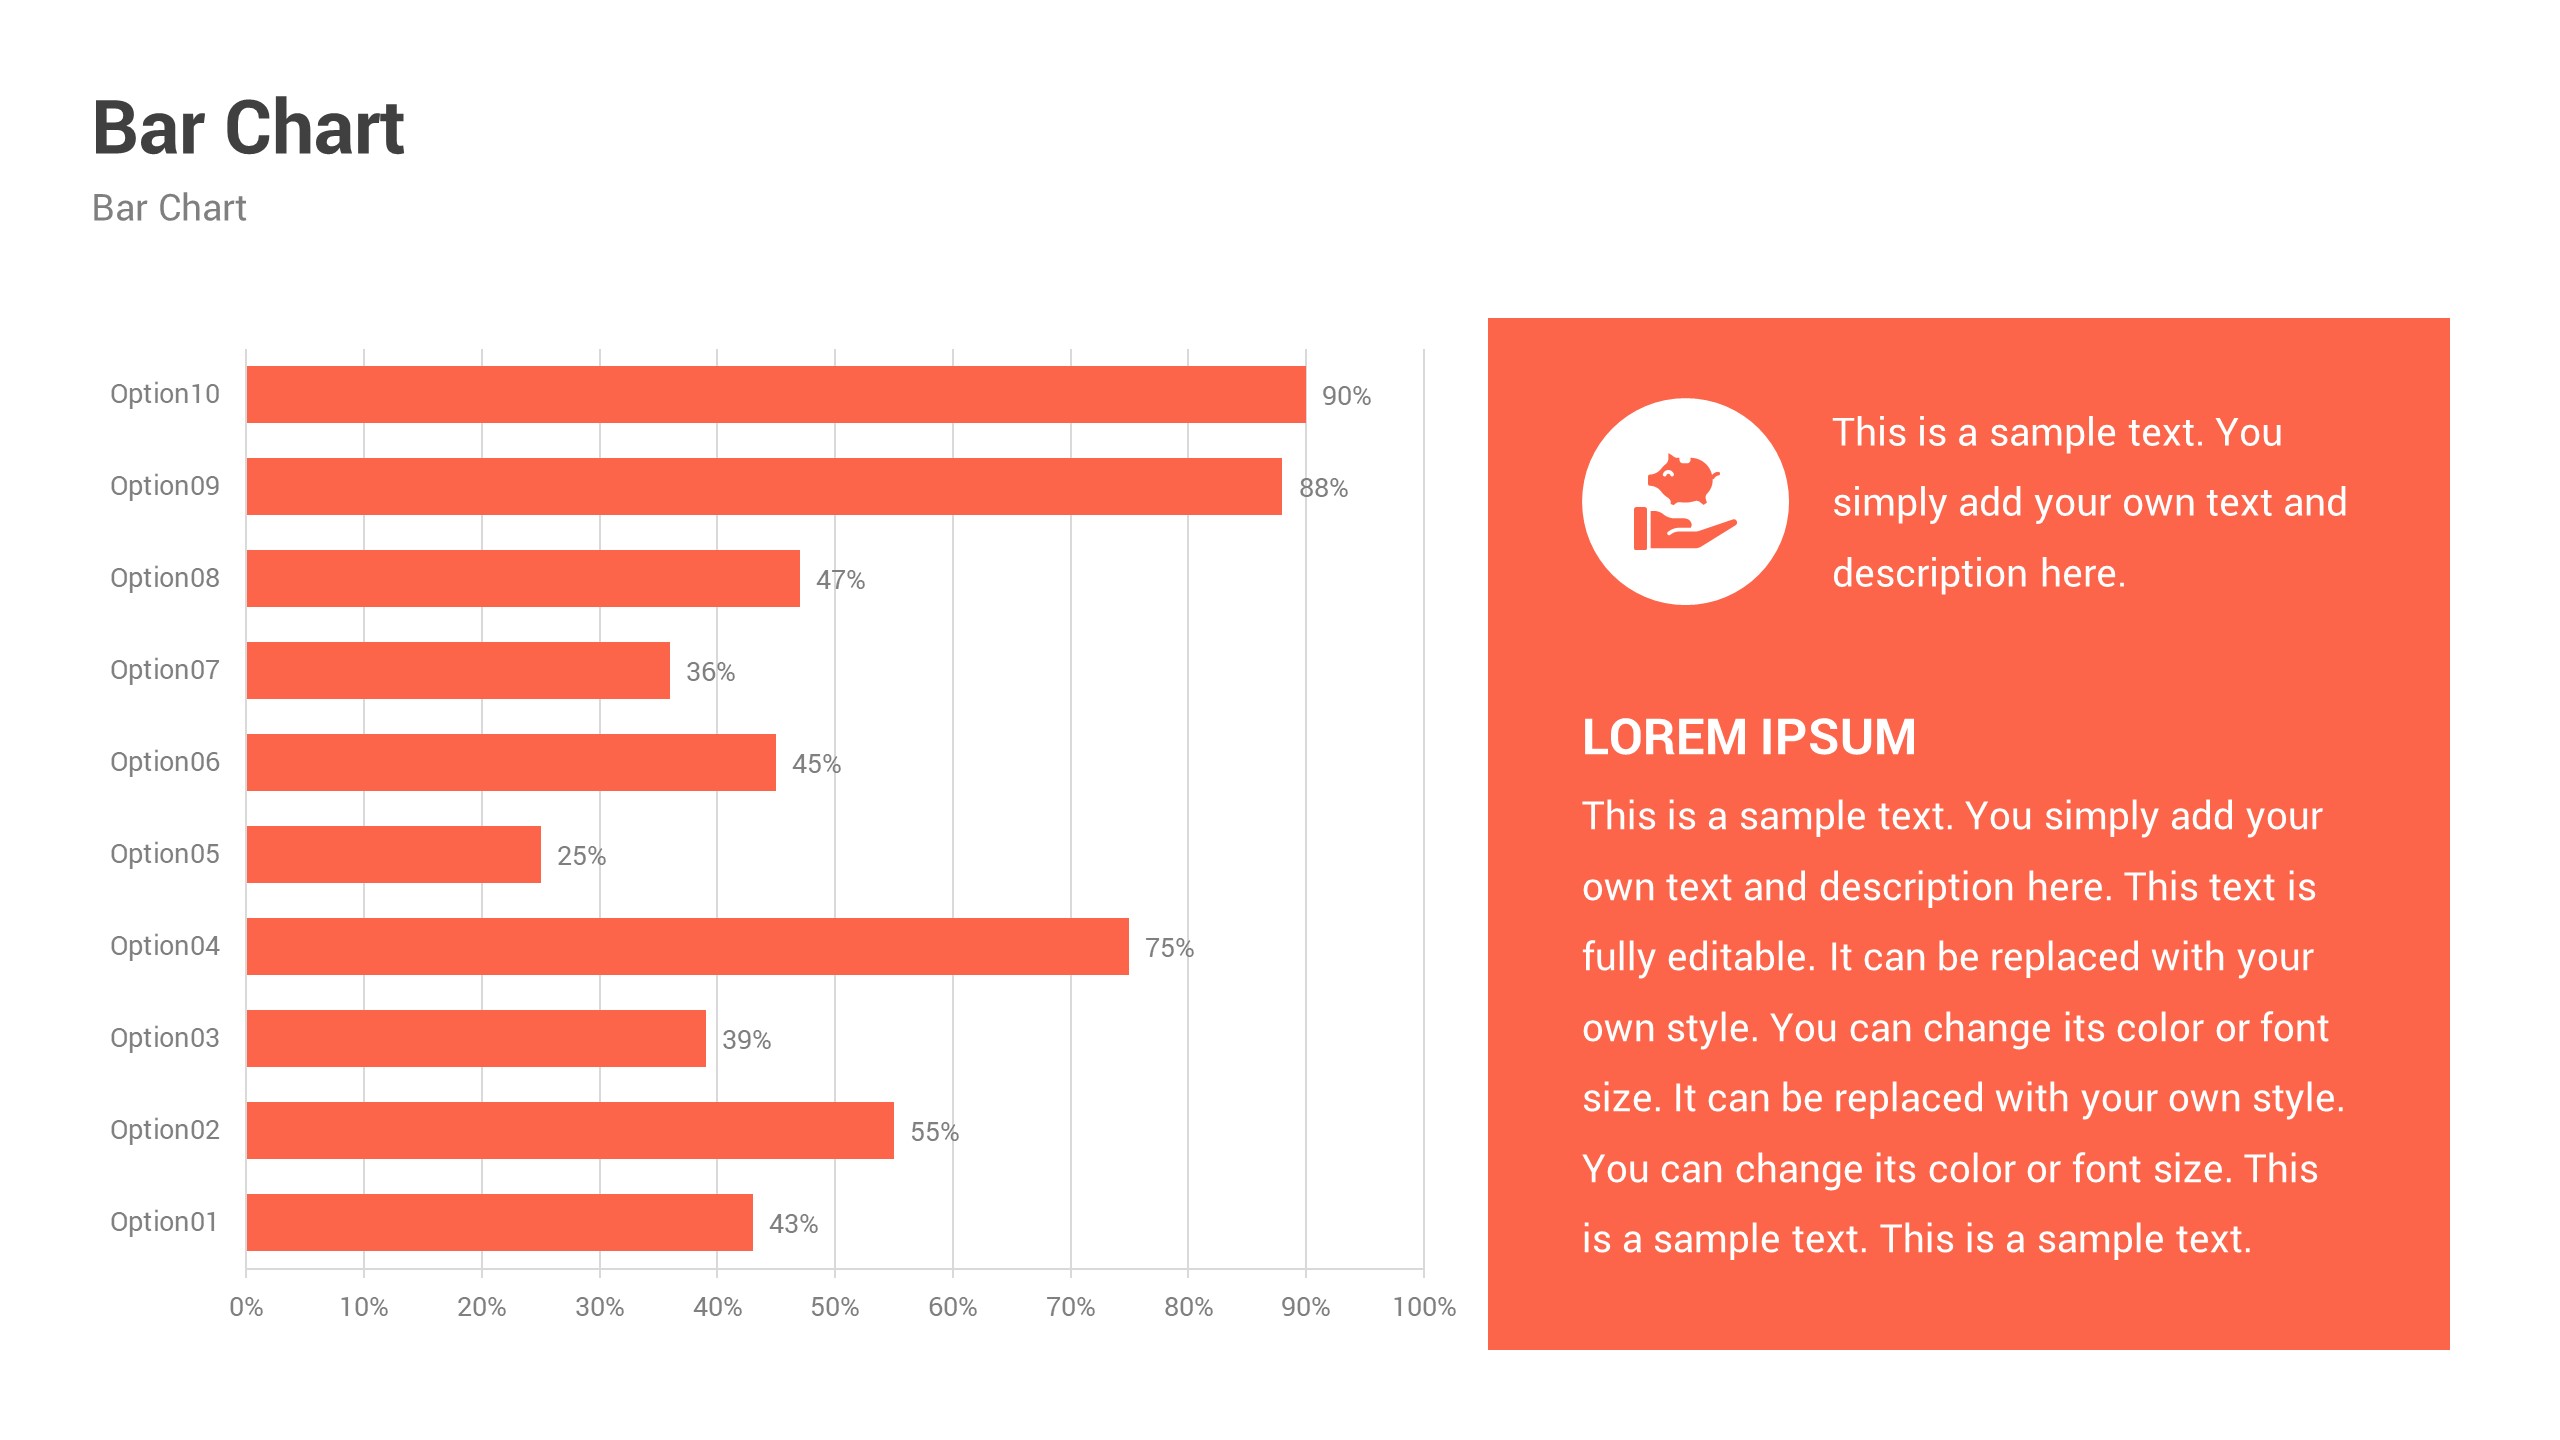
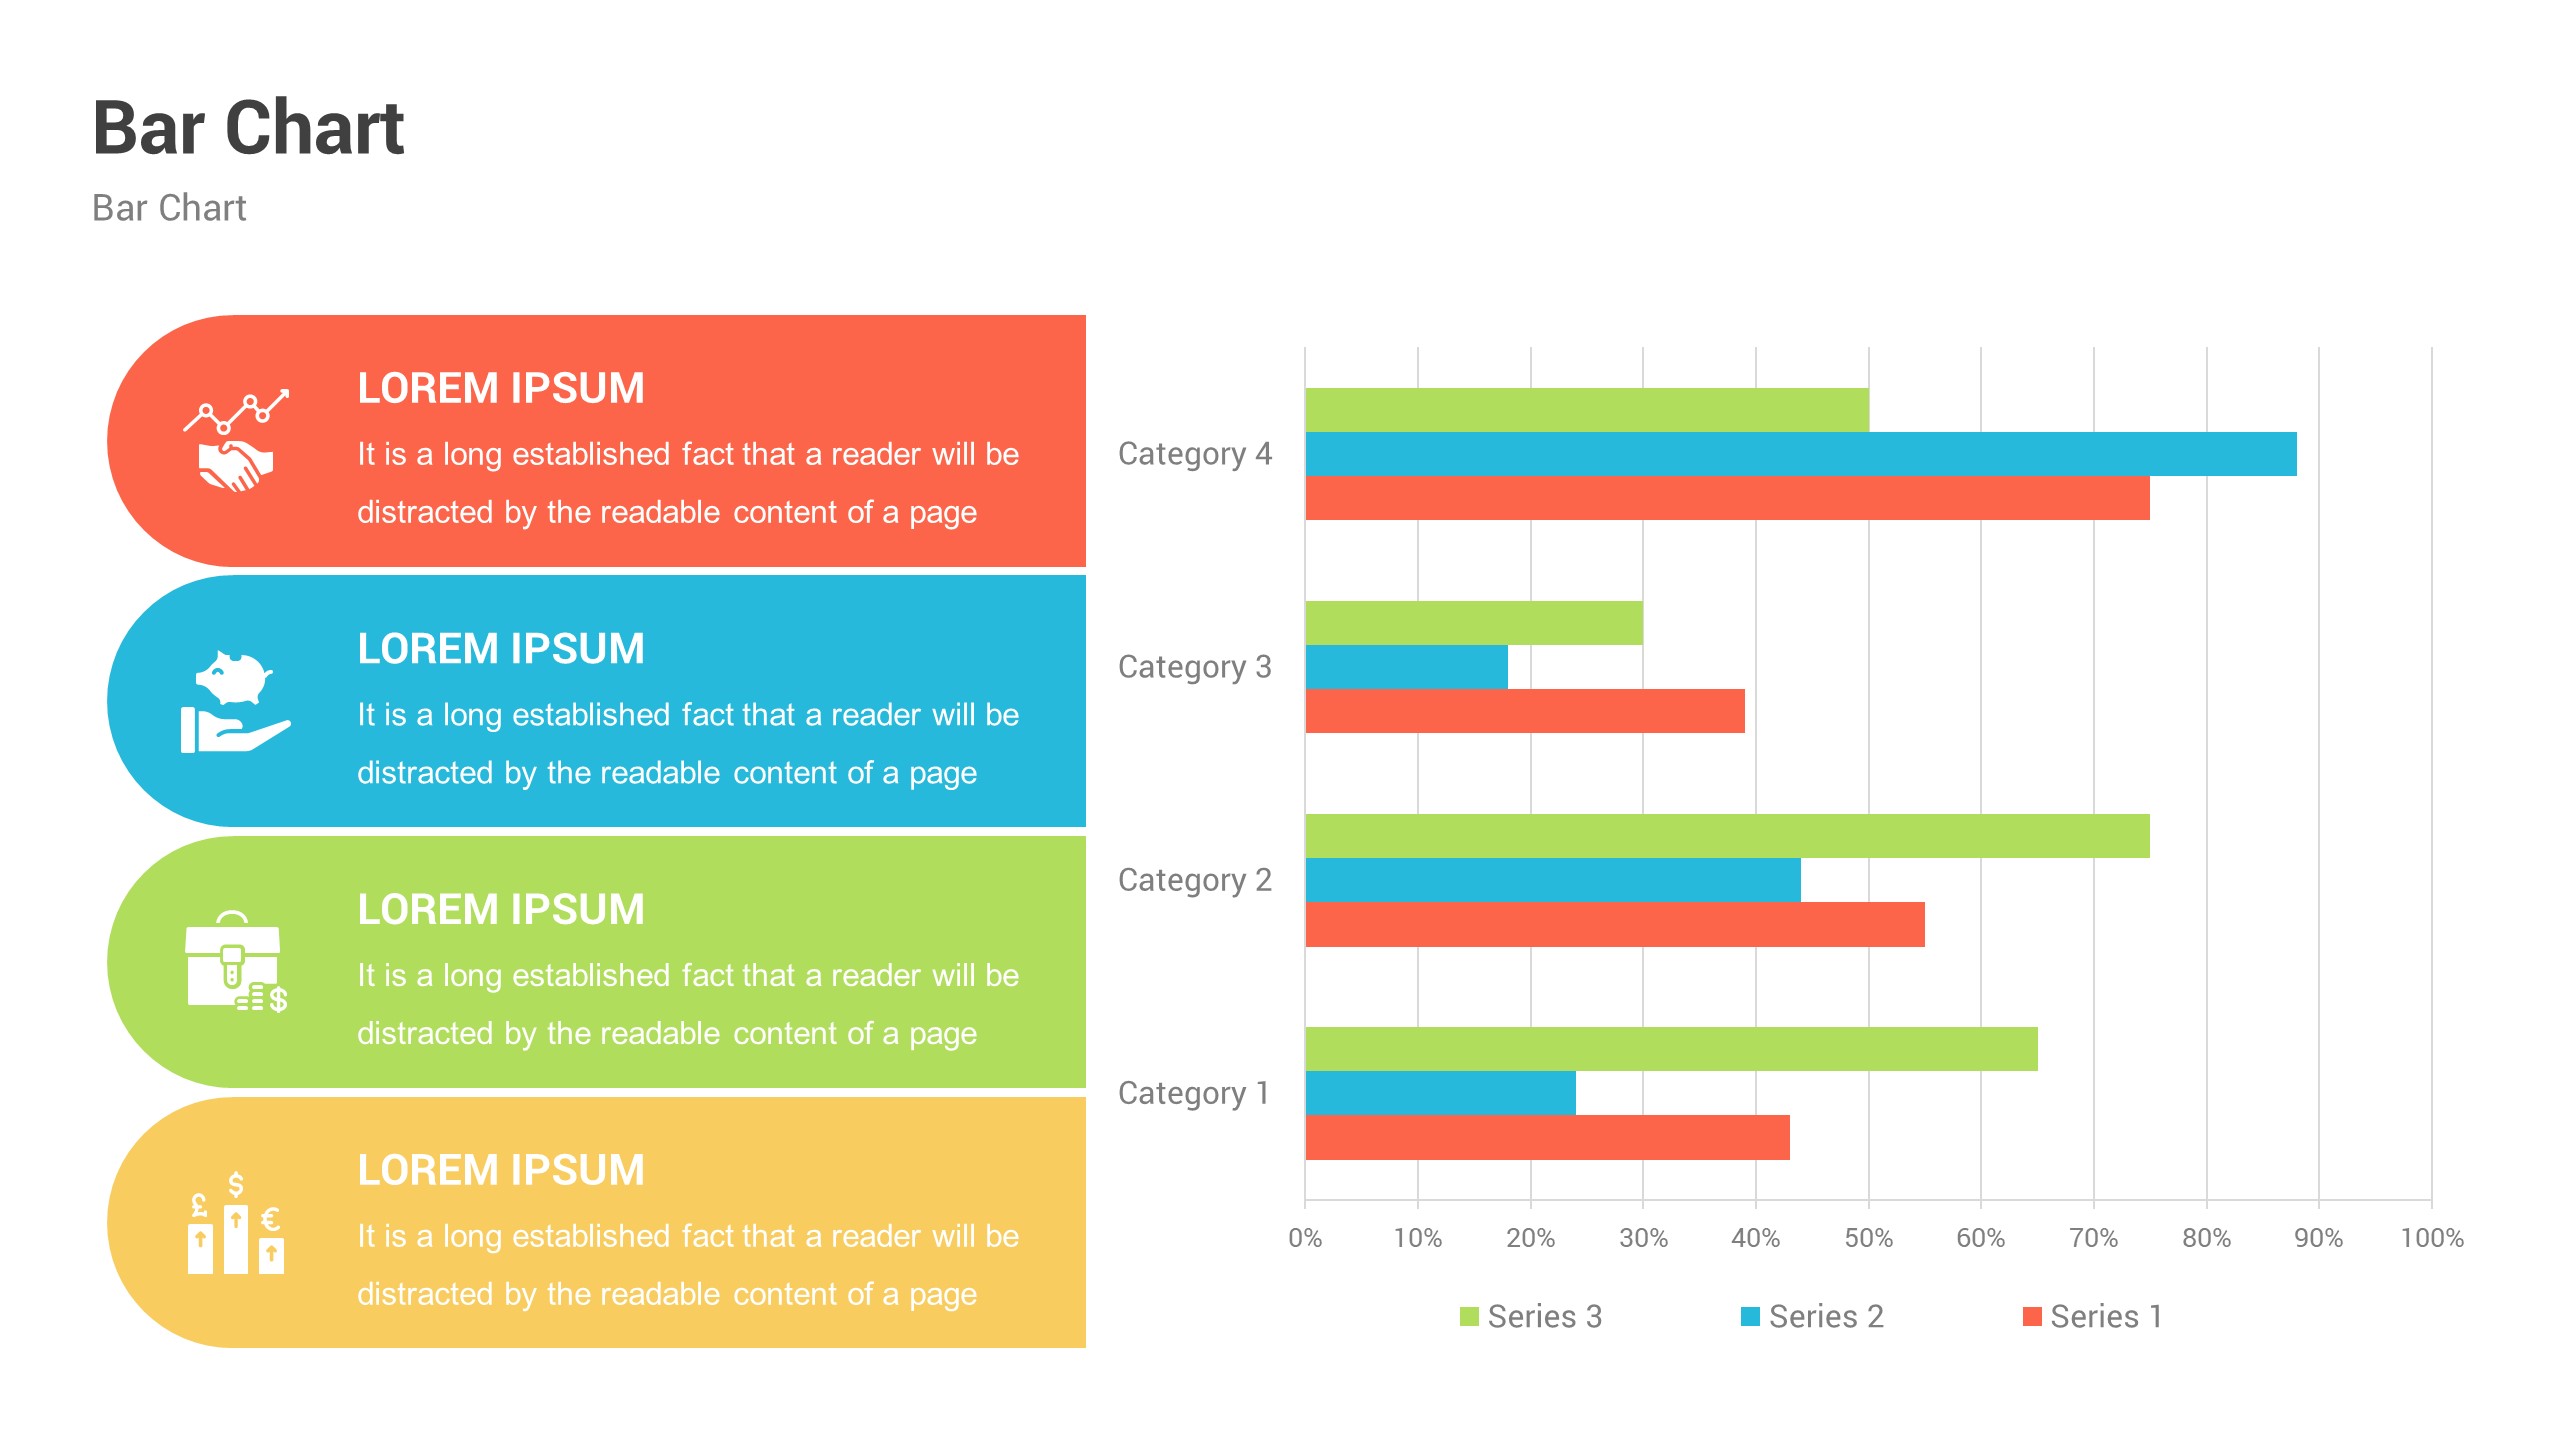
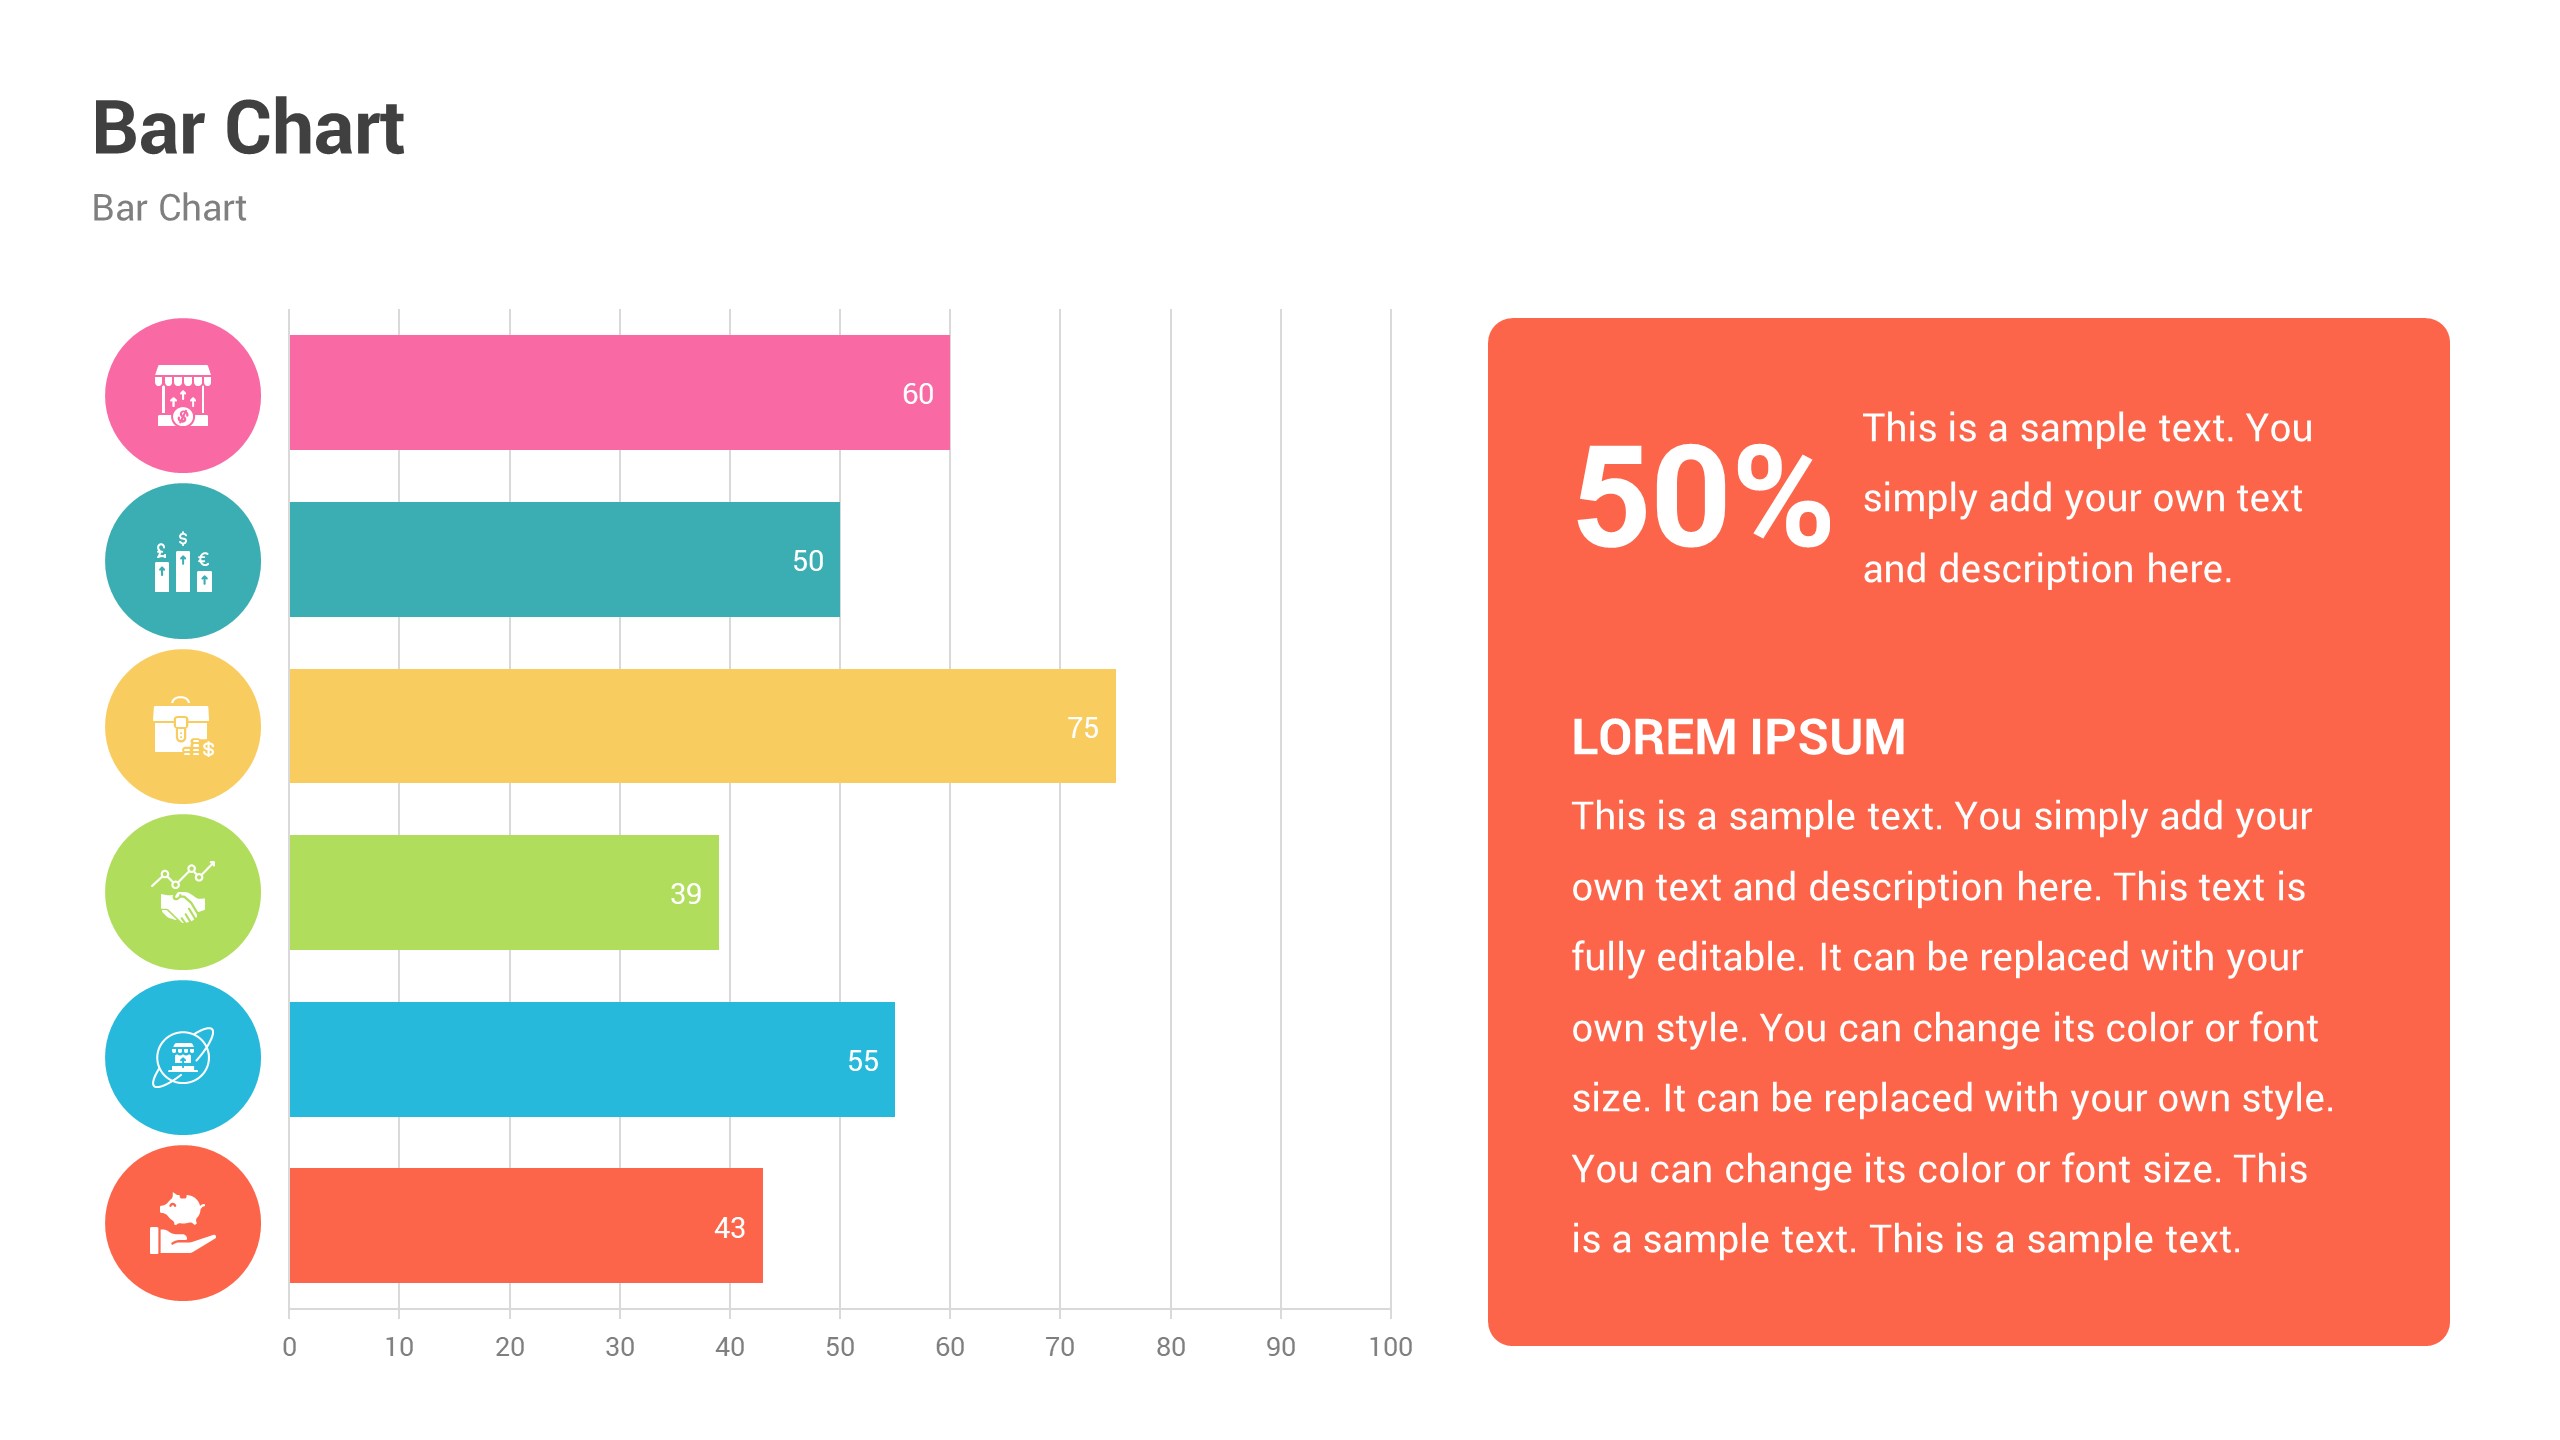
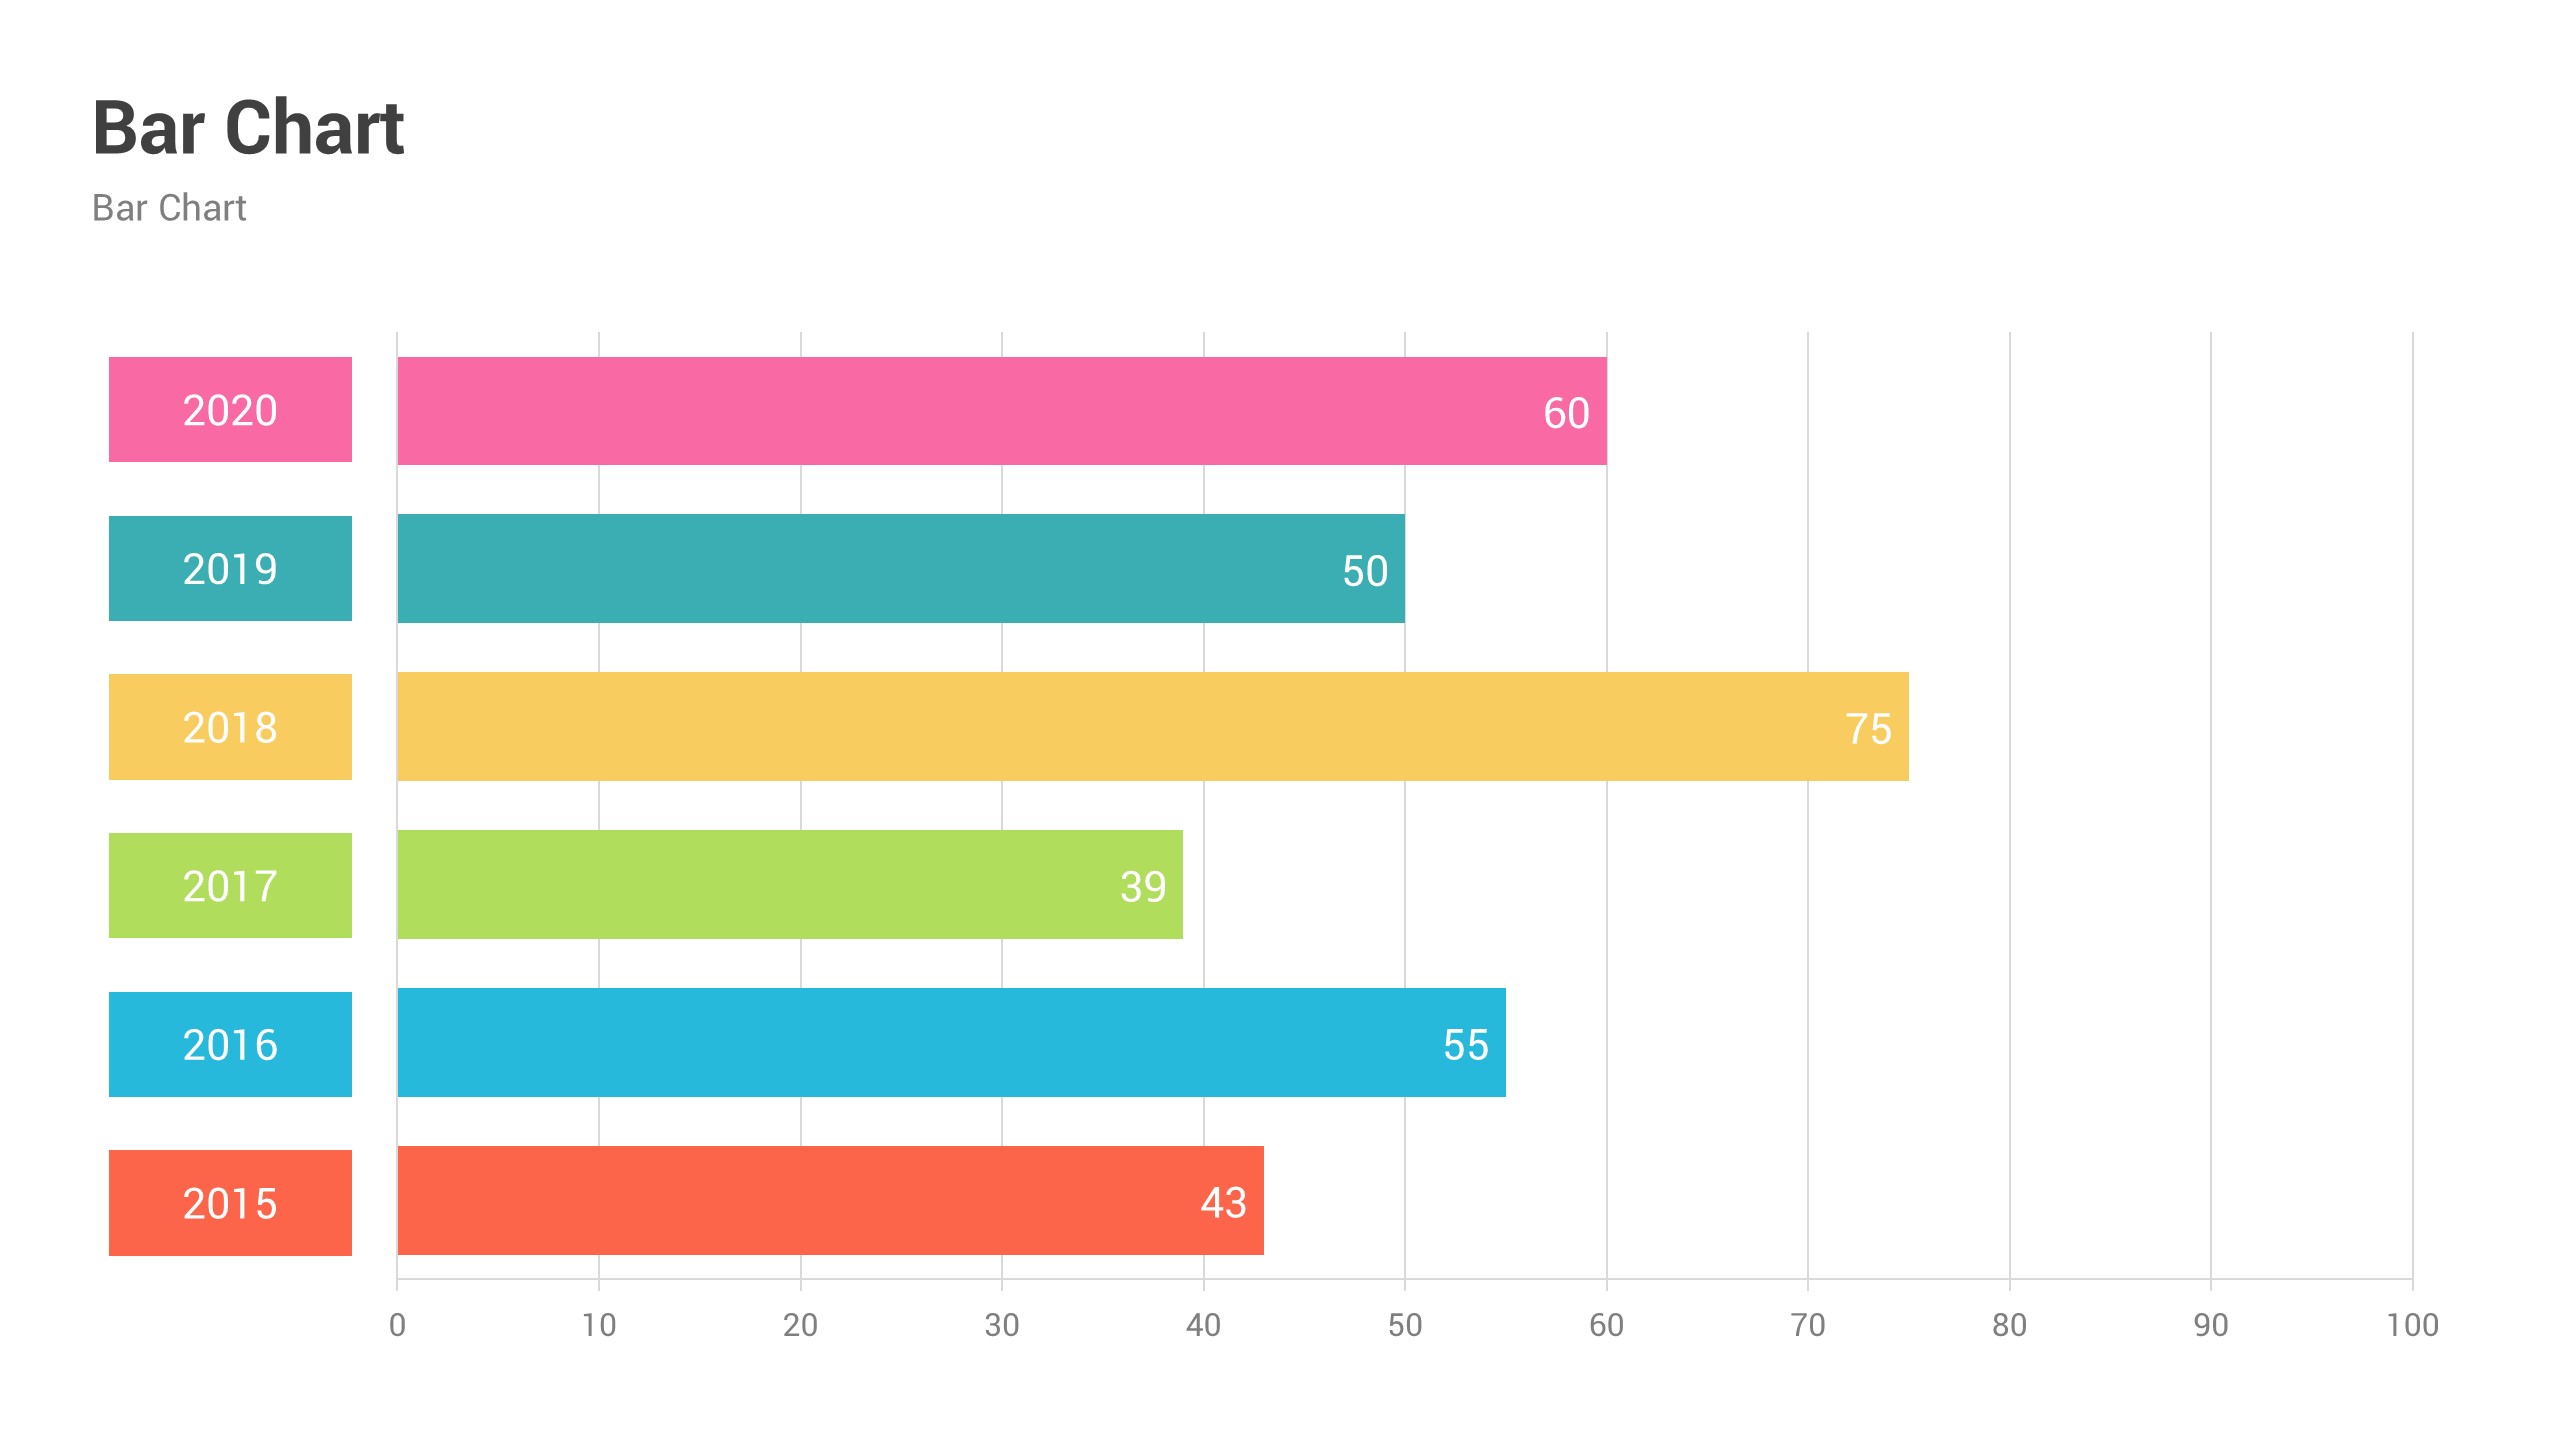
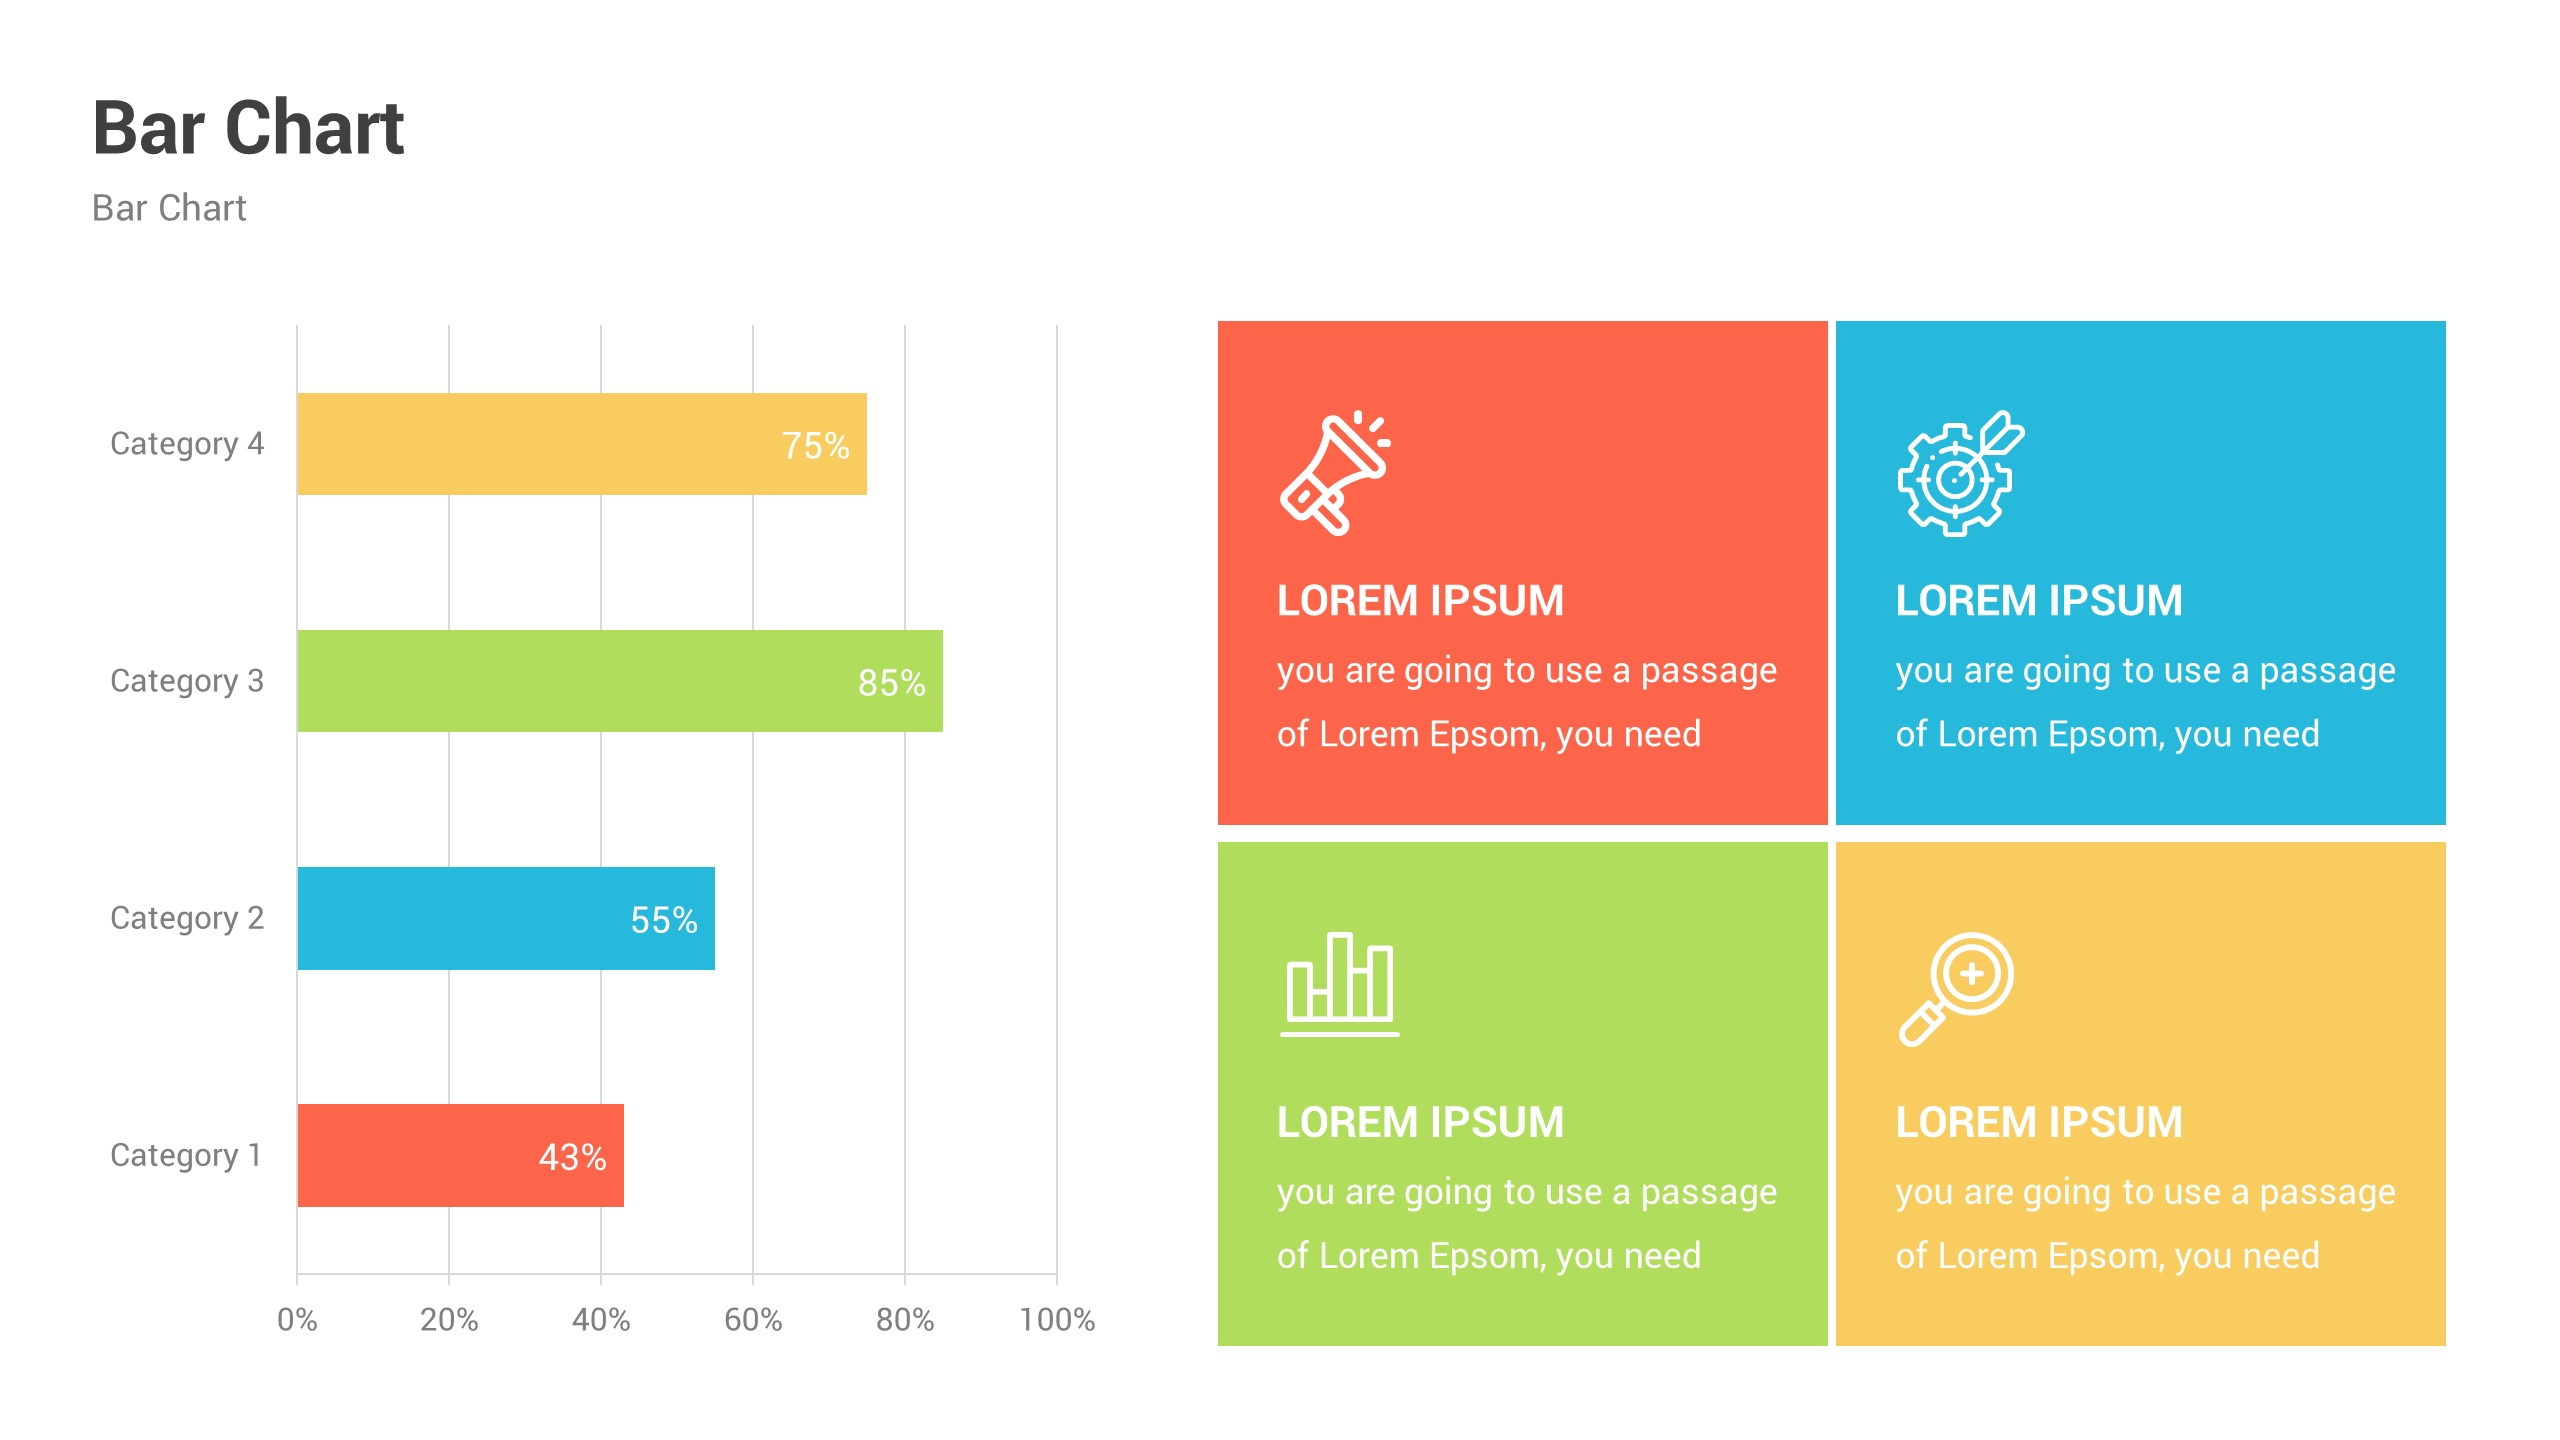
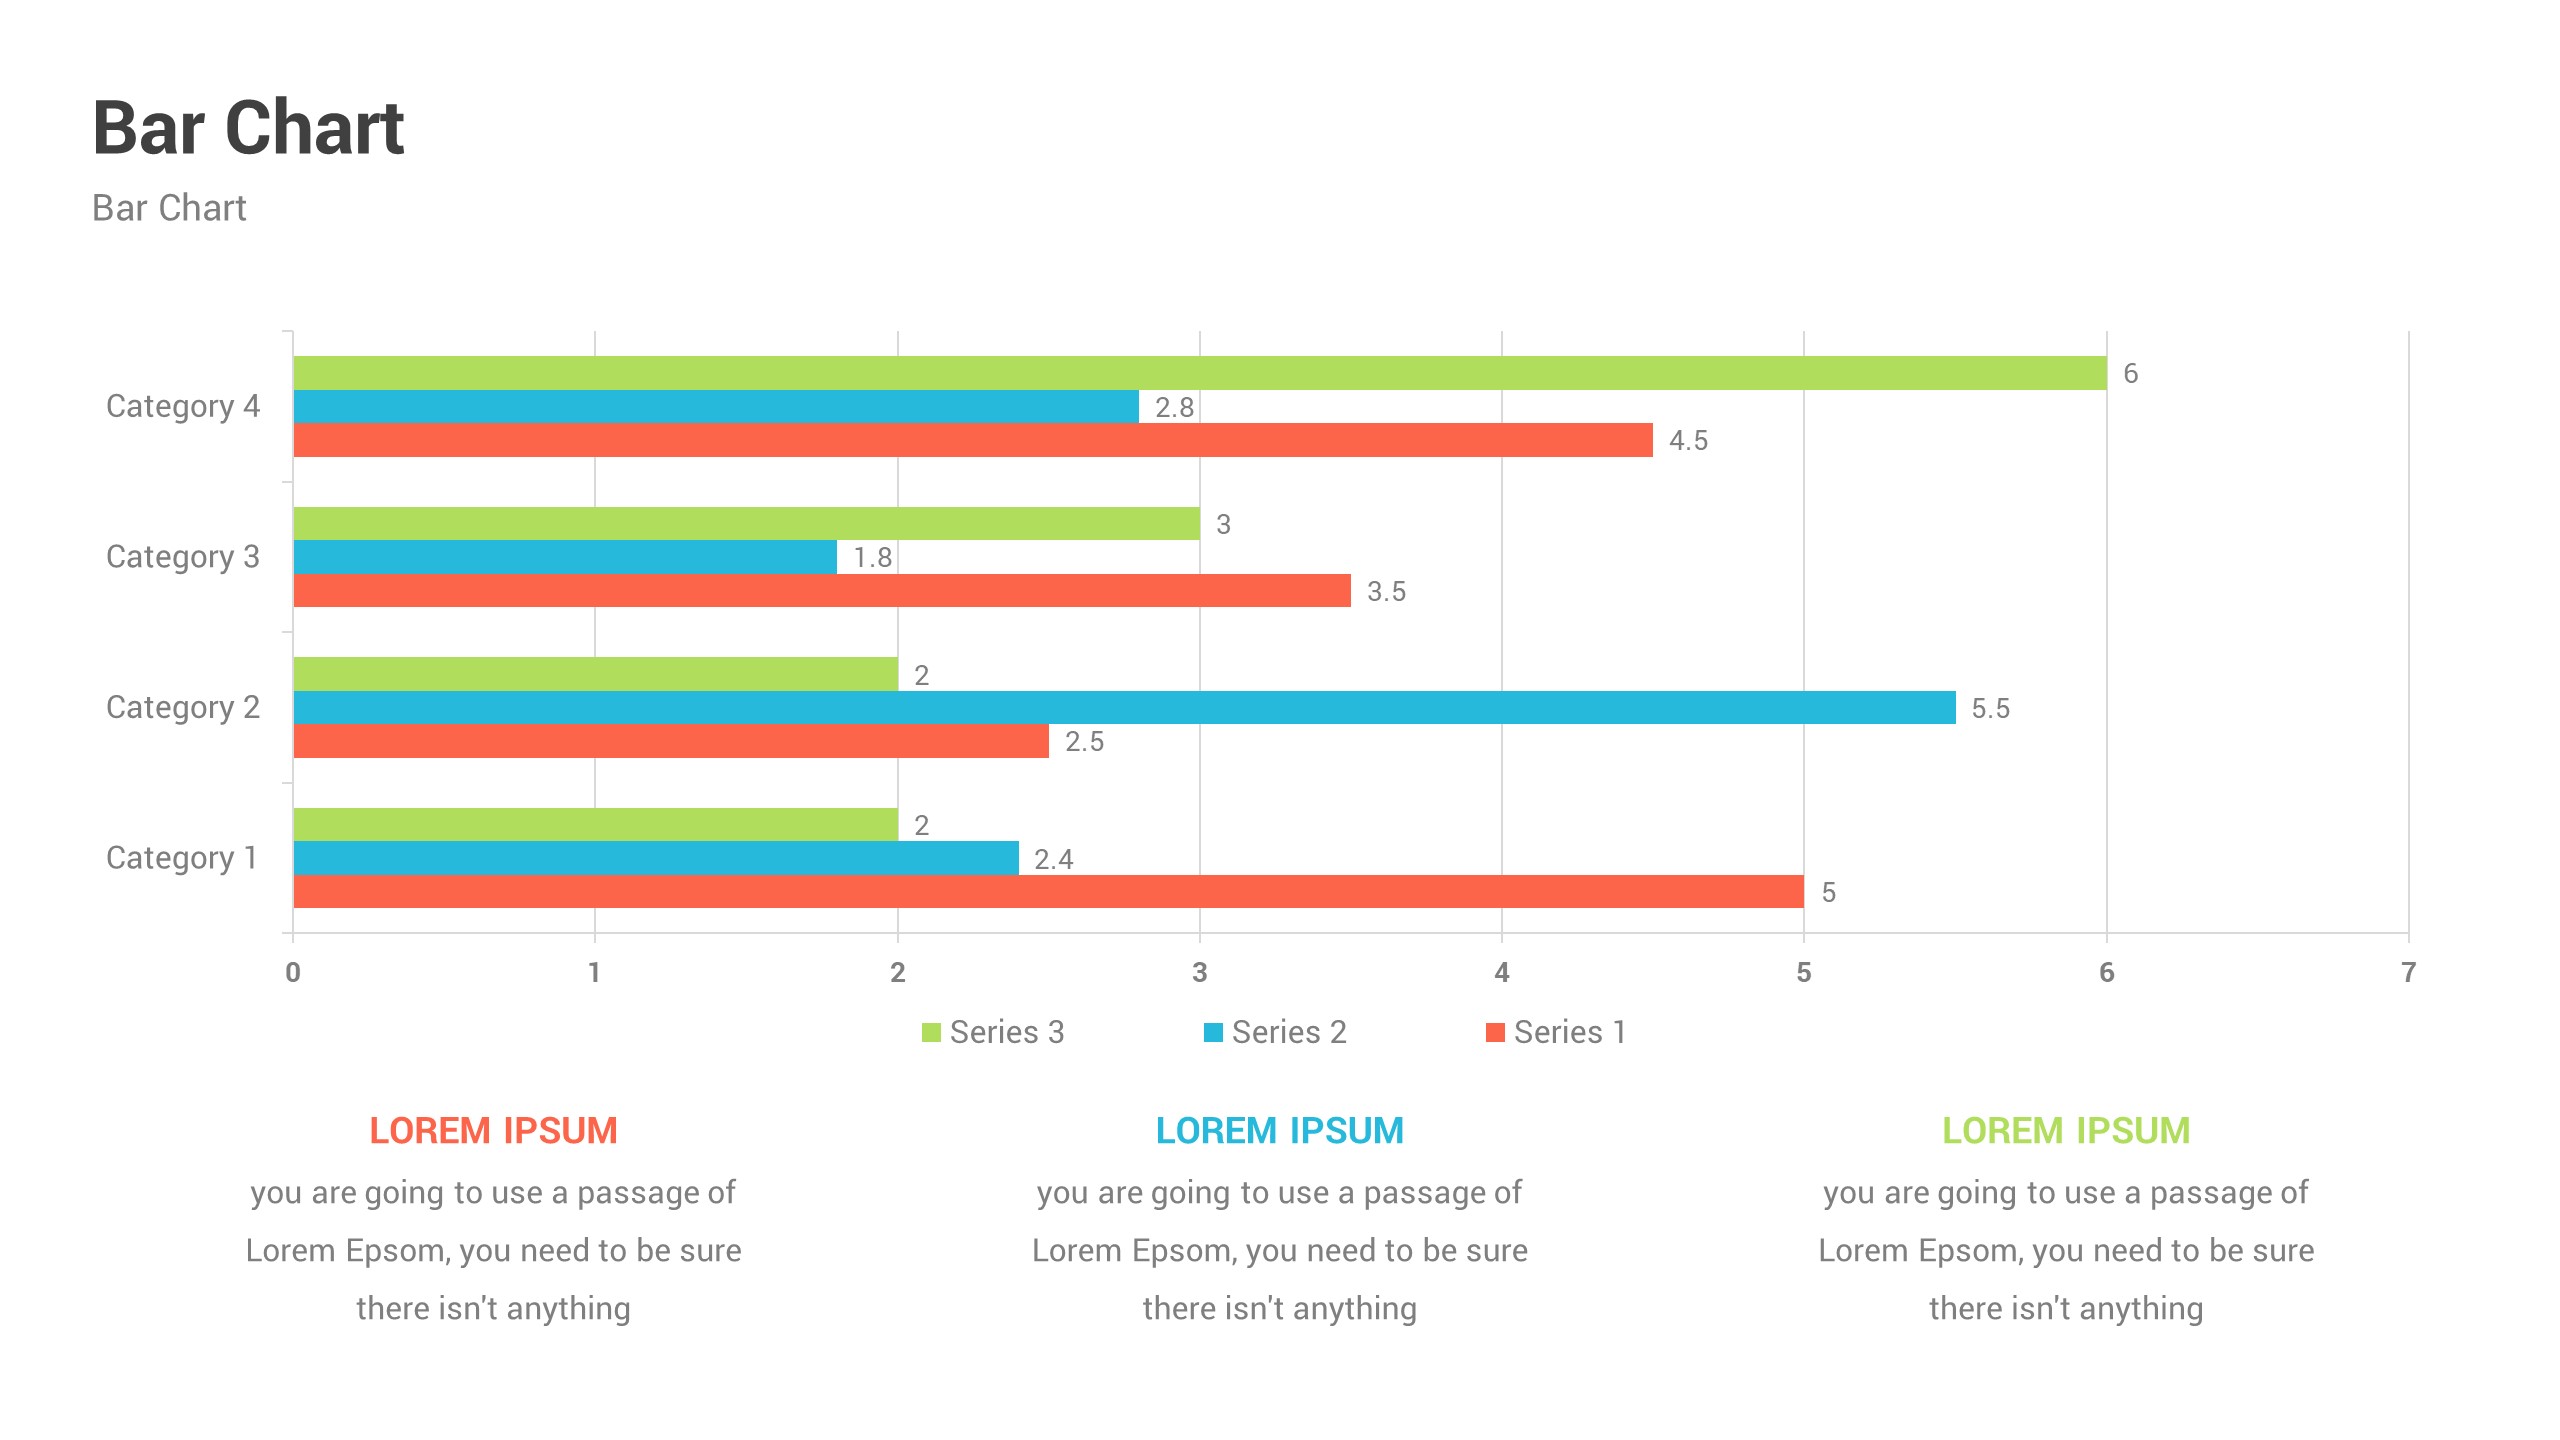
- Bar Charts
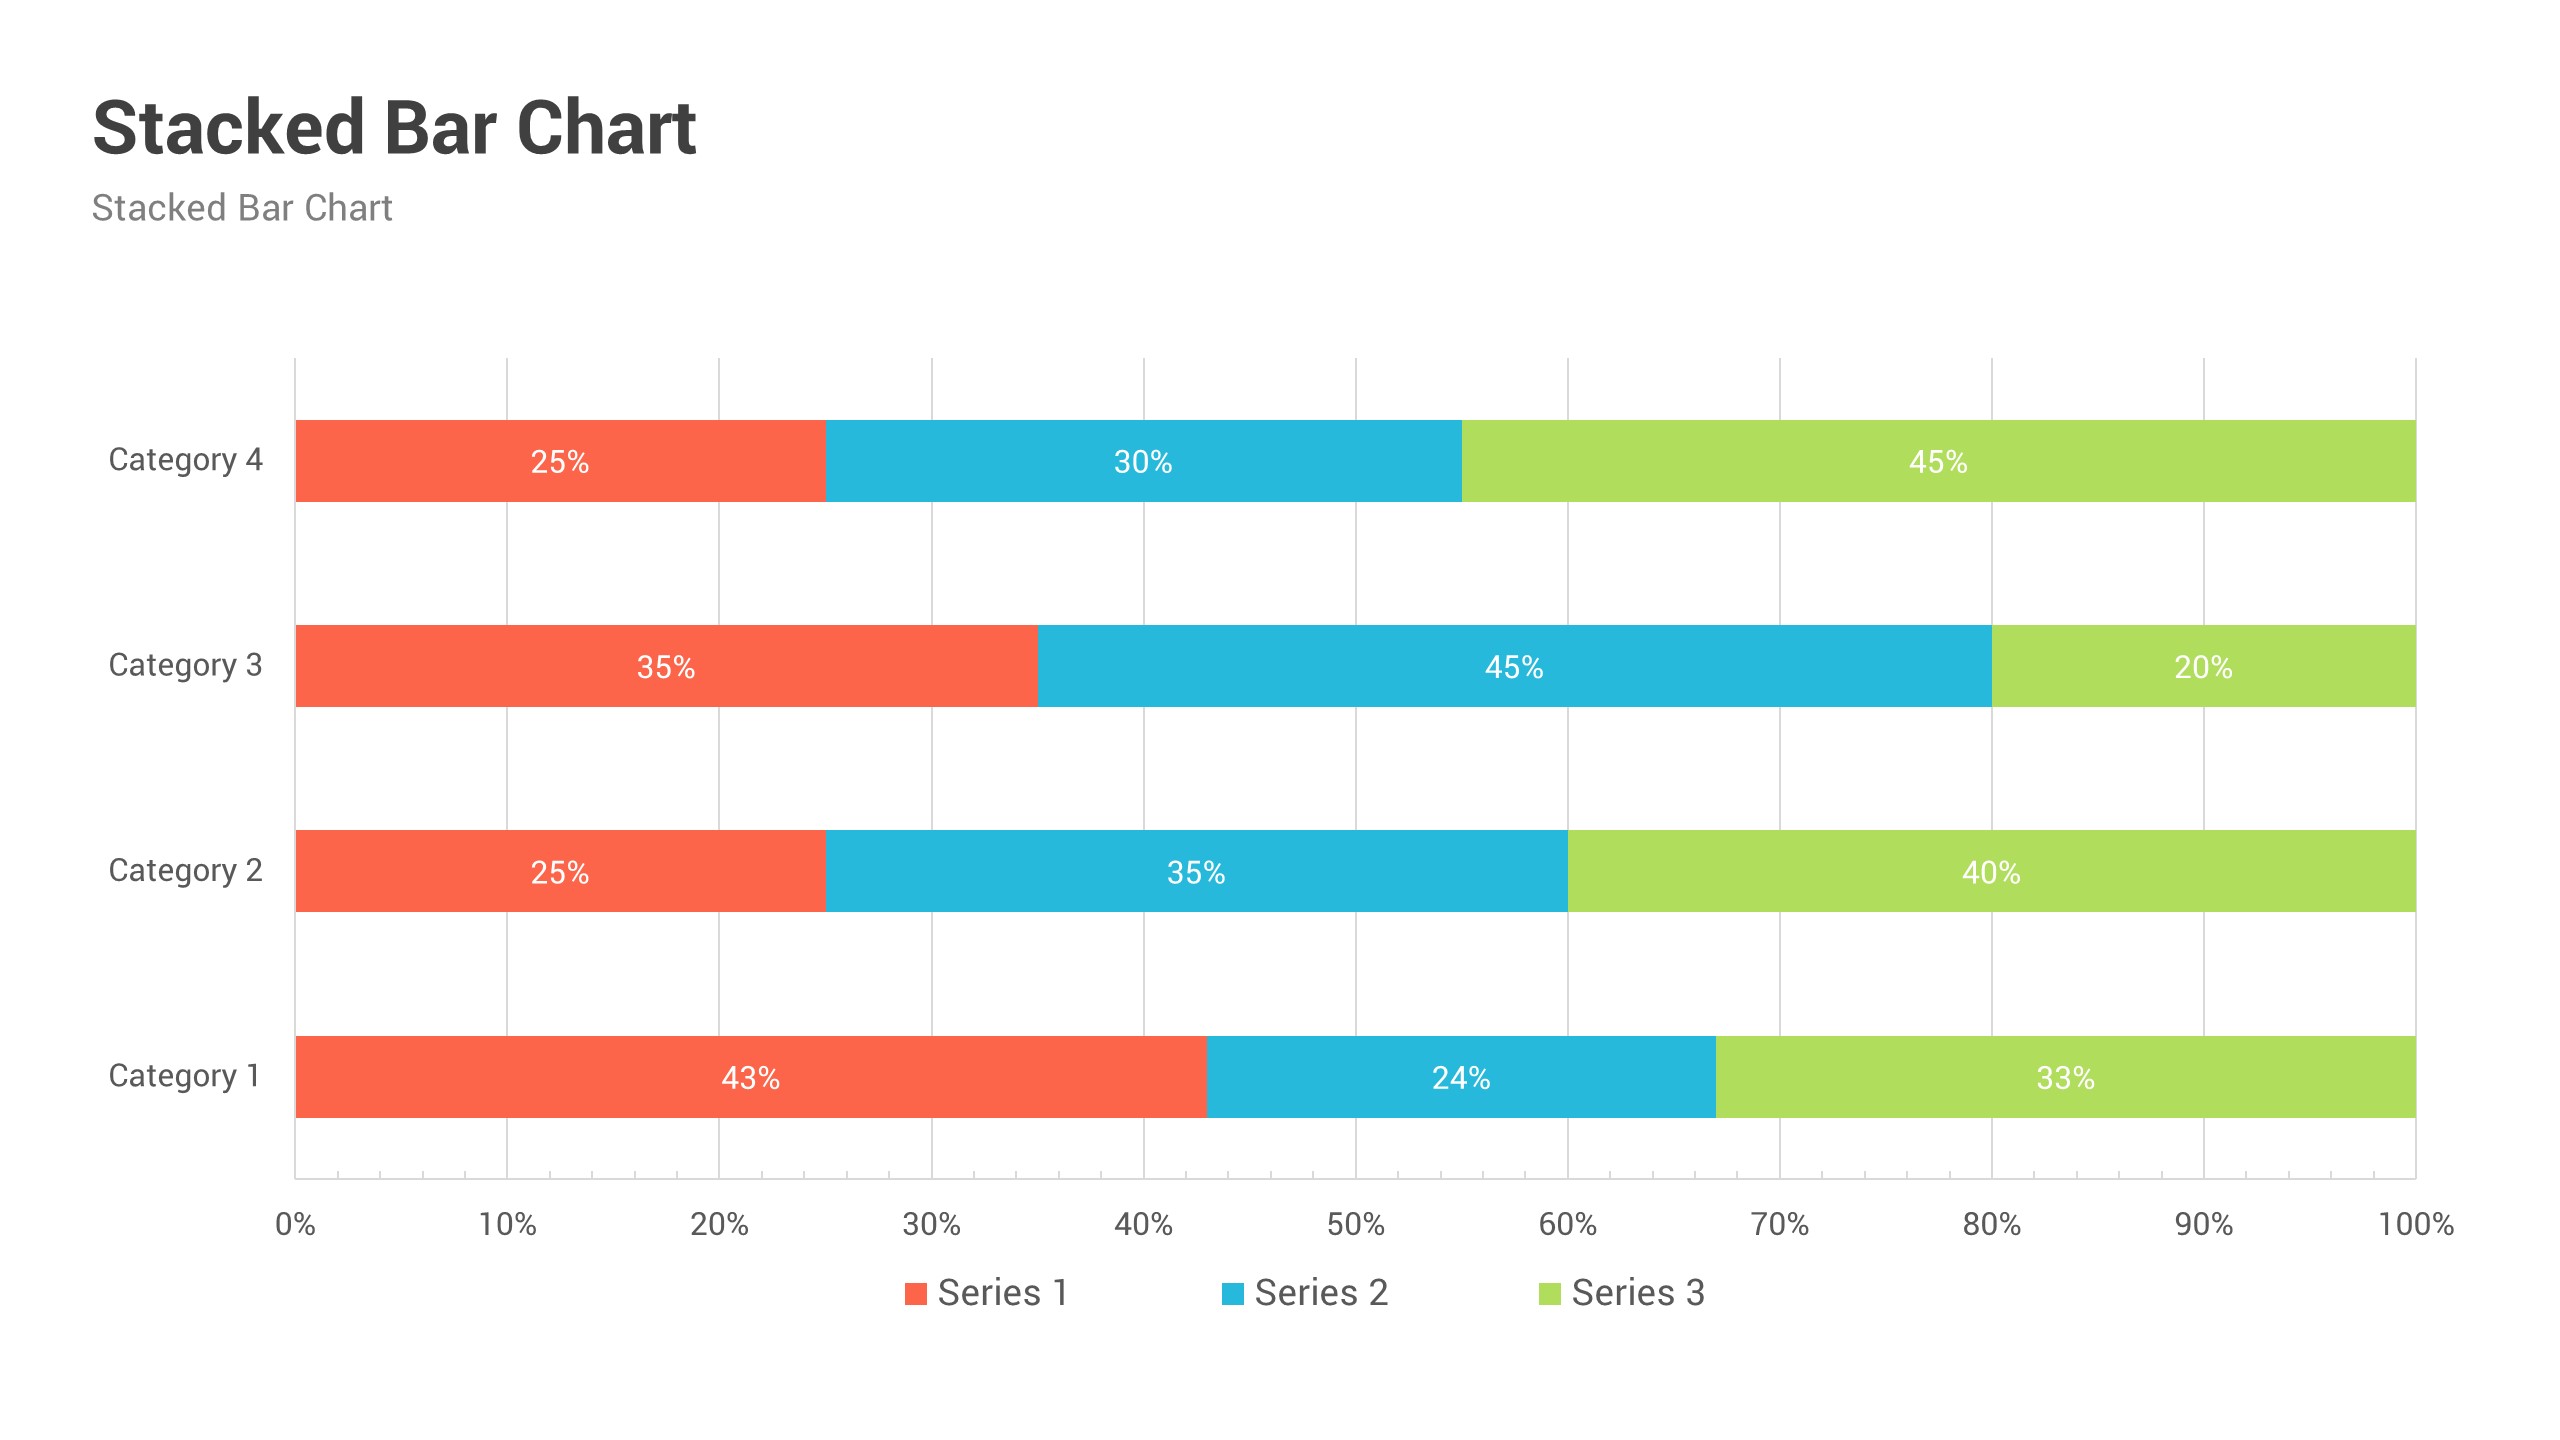
- Stacked Bar Charts
this package is helpful :< /strong>
- Business Strategy
- Business analysis
- Company profile
- Business corporate
- Multipurpose Business
- Business Plan
- Business Proposal
- Startups
- Pitch deck
- Investment
- Creative Agency
- Consulting
- Sales Deck
- Annual Report
- Sales and Marketing
- Management